Combined vitamin C and E deficiency induces motor defects in gulo−/−/SVCT2+/− mice
Marquicia R. Pierce, Danielle L. DiAsio, Laurisa M. Rodrigues, Fiona E. Harrison, James M. May
Nutritional Neuroscience 2013
http://dx.doi.org/10.1179/1476830512Y.0000000042
This paper was published with incorrect versions of and . The correct versions of the figures are presented below.
Figure 1. Experimental Scheme 1: combined vitamins C- and E-deficient diets. Mice started vitamin E treatments at 4–5 weeks of age with continued vitamin C supplementation. After 16 weeks of vitamin E treatments mice were tested (Test 1) to observe changes in behavior. Vitamin C treatment lasted 3 weeks, during which another set of behavior tests were performed (Test 2). Mice were then sacrificed for biochemical analysis.
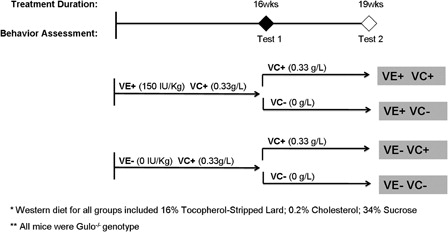
Figure 2. Experimental Scheme 2: combined vitamin deficiency effects on gulo−/− SVCT2+/− mice. Mice started vitamin E deprivation at 4–5 weeks of age with continued vitamin C supplementation. After 16 weeks mice were tested (Test 1) to observe changes in behavior. Vitamin C treatment lasted 3 weeks, after which another set of behavior tests were performed after 2 weeks and followed-up with another at 3 weeks (Tests 2 and 3, respectively). Mice were then sacrificed for biochemical analysis.
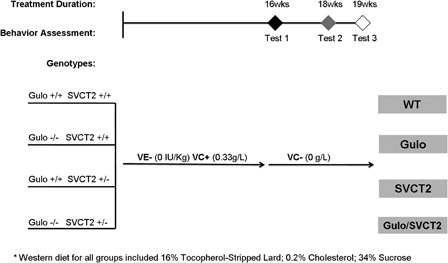
Figure 3. Behavioral phenotype of combined vitamin E and C deficiency. Behavioral assessments included changes in body weight (A) stride length (B) locomotor activity (C), and motor coordination on the Rota-rod (D). Displayed are group means ± standard error of means. ∧ Denotes a significant difference between Tests 1 and 2. * Denotes a significant difference between the respective VC+ and VC− groups for Test 2 (P < 0.05). # Denotes a significant difference between VC+ and VC− groups over time (P < 0.05).
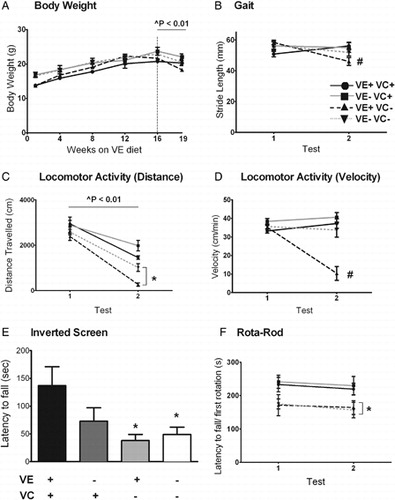
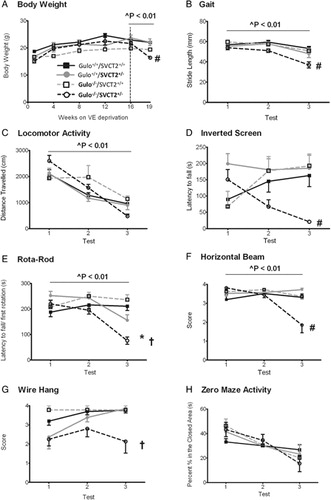
Figure 6. Genetic modification of gulo−/−/SVCT2+/− alters behavioral phenotype. Behavioral assessments included changes in body weight (A) stride length (B) locomotor activity (C) and motor coordination including inverted screen (D) Rota-rod (E) horizontal beam (F) wire hang (G), and zero-maze (H). * Denotes a significant difference between gulo+/+ and gulo−/− groups (P < 0.05). † Denotes a significant difference between SVCT2+/+ and SVCT2+/− groups (P < 0.05). # Denotes a gulo × SVCT2 interaction effect (P < 0.05).