Abstract
MicroRNAs (miRNA), as a class of non-coding RNAs, play a crucial role in normal hematopoiesis. Recent studies on miRNA profiling during hematopoiesis showed miR-10a down-regulation in megakaryocytic differentiation. Here we investigated whether decrease in miR-10a can differentiate umbilical cord blood CD133+ cells to megakaryocytic series. We ectopically induced miR-10a down-regulation by locked nucleic acid anti-miR-10a transfection of CD133+ cells. The megakaryocytic differentiation was evaluated by CD42/CD61 and CD41 surface expression and colonogenic capacity in Megacult media. In addition, real-time polymerase chain reaction was done for detection of miR-10a and its target HoxA1 mRNA. HOXA1 protein expression was detected by flow cytometry as mean fluorescent intensity that shows the antibody reaction proteins. Our findings showed megakaryocytic differentiation of about 28% of umbilical cord blood CD133+ stem cells with bright expression of CD42/CD61 and CD41 in parallel with increase in HoxA1 mRNA and protein level. Colony forming of CD61+ cells in Megacult demonstrated the colonogenic capacity of differentiated progenitor cells. In conclusion, MiR-10a has a role in megakaryocyte differentiation of stem cells via HOXA1 transcription factor targeting.
Introduction
MicoRNAs (miRNAs) are small non-coding RNAs of 19–26 nucleotides in length regulating gene expression by targeting 3′ untranslated region of mRNAs, and inducing mRNA degradation or protein translation inhibition according to the degree of complimentary between miRNAs and their targets.Citation1,Citation2 Several studies have provided evidence that miRNAs can control some major cellular processes including, proliferation, differentiation, apoptosis, metabolism, and development.Citation3,Citation4 Current studies have also indicated miRNAs involvement in hematopoietic differentiation.Citation5,Citation6 To understand the role of these molecules in normal and abnormal hematopoiesis, some systemic screening of miRNAs has been done in different cell types. Chen et al. cloned 150 miRNAs from murine bone marrow and reported that miR-181, miR-223, and miR-142 were preferentially expressed in hematopoietic cells.Citation6,Citation7 Ramkisson et al. examined expression levels of miR-142, miR-155, miR-181, and miR-223 in human granulocytes, monocytes, T, and B cells.Citation8,Citation9 Another study showed that miR-150 was specifically expressed in mature lymphocytes, and its expression in premature lymphocytes blocked B-cell development.Citation10 Masaki et al. have provided evidences for a key role of miR-451 in late stages of erythropoiesis.Citation11 Furthermore, miRNA-expression profiling in five peripheral blood samples defined up-regulation of miR-15b in reticulocytes, miR-24 in granulocytes and platelets, miR-30c, miR-223, and miR-142-5p in granulocytes, and down-regulation of miR-142-3p, miR-342, and miR-150 in reticulocytes, miR-451, miR-181a, and 106b in mononuclear cells (MNCs).Citation12
MiRNAs fingerprint during megakaryocytic differentiation by Garzon et al. identified down-regulation of six miRNAs. Within them, miR-10a showed sharp down-regulation in this lineage. The miR-10a gene-coding region is in 17q21 locus within the HoxB gene cluster; its expression also follows HoxB-like patternCitation13,Citation14 with a common regulatory element. According to acquired data in the MIRANDA software, we found some HoxA mRNAs as putative targets for miR-10a because of the HoxB family gene involvement in expansion and differentiation of hematopoietic stem cells.Citation15 In this study, we decided to down-regulate miR-10a in CD133+ umbilical cord blood (UCB) cells and investigate the level of its target mRNA and megakaryocyte (Mk) differentiation to evaluate the role of miR-10a in hematopoietic cell differentiation.
Methods
UCB CD133+ cell isolation
Three UCB samples were obtained from normal full-term deliveries with informed consent. MNCs were isolated using Ficoll hypaque (1.077 g/cm3, Pharmacia, Uppsala, Sweden). The CD133+ cell fraction was enriched with magnetic activated cell sorting (MACS) CD133 cell Isolation Kit (Miltenyi Biotec, Bergische, Germany) using a high-gradient magnetic field according to the manufacturer's instructions. The purity of separated cells was verified by flow cytometry (Partec CY-flow, Munster, Germany) counterstaining with phycoerythrin (PE) conjugated anti-CD133 (MoAb CD133-PE, Miltenyi Biotec, Bergische, Germany), and fluorescein isothiocyanate (FITC) conjugated anti-CD34 (MoAb CD34-FITC, DAKO- Glostrup, Denmark).
Ex vivo expansion of CD133+ cells
UCB CD133+ cells (5 × 10⁵) were seeded in a total volume of 2 ml culture media in a six-well plate (Costar- Cambridge, MA, USA) maintained at 37°C in a fully humidified atmosphere with 5% CO2. The cells were cultured for 7 days in the serum-free Stem span medium (Stem cell technologies- Ottawa, Canada) following this cytokine combinations: stem cell factor (100 ng/ml), thrombopoietin (TPO) (100 ng/ml), and interleukine-3 (10 ng/ml), (all from Stem cell technologies- Ottawa, Canada) that were added at first and fourth days. After 7 days of culture, the cells were analyzed by flow cytometry for confirmation of expansion without differentiation. The expansion was induced because of limited number of CD133+ cells in each UCB unit.
LNA anti-miR-10a treatment
After 7 days of expansion, the cells were counted and transferred (1 × 10⁵) to 24-well tissue-culture plate (Costar, Cambridge, MA, USA) in serum-free Stem span media. The TPO (100 ng/ml) was added twice a week in some plates as a positive control group. We used locked nucleic acid (LNA) type of anti-miR-10a (LNA anti-miR-10a, Exiqon, Woburn, MA, USA), which is more stable against enzymatic degradation, and FITC-conjugated scramble LNA (LNA FITC-Scr, Exiqon, Woburn, MA, USA) as a control for transfection efficiency. The day after cell plating, 20 nM of LNA anti-miR-10a plus 1 µl lipofectamin (Qiagen, Hilden, Germany) were added to the test groups, and the media was exchanged after 16 hours. The Mk differentiation was followed on the days 0, 4, 7, and 10 after transfection.
Megakaryocytic characterization
Flow cytometric analysis
Flow cytometric analysis was performed on a Partec CY-flow space instrument equipped with argon laser. A total of 10 000 events was acquired in each analysis. FITC-conjugated anti-CD42 and anti-CD41 and PE-conjugated anti-CD61 (Dako, Glostrup, Denmark) were used for phenotype characterization.
Mk-colony-forming unit assay
For evaluation of colonogenic capacity of Mk-differentiated cells, the CD61+ cells were separated by the MACS method (Miltenyi Biotec, Bergische, Germany) and cultured in the Megacult medium (StemCell Technologies, Vancouver, BC, Canada) formulated to allow optimal detection of Mk progenitors. Two hundred separated CD61+ cells were added to 2.0 ml of Megacult media and 1.2 ml of cold collagen solution (StemCell Technologies, Vancouver, BC, Canada) were mixed and transferred to two 35 mm Petri dishes in duplicate. These plates were placed in a 100-mm Petri dish along with an open 35-mm Petri dish containing 3 ml sterile water to maintain optimal humidity. The plates were transferred to a 37°C incubator with 5% CO2 and >95% humidity. After 14 days, the colonies were counted.
Real-time polymerase chain reaction of Hox A1 and miR-10a
Quantification of mRNA HoxA1, as a miR-10a target molecule, was done on RNA extracted from the cells. Total RNA was extracted using TRIzol (Qiagen, Hilden, Germany), and cDNA synthesis was carried out using cDNA synthesis kit (Bioneer, Alameda, CA, USA) according to the manufacturer's instructions. Primers were designed for HoxA1 FW, 5′-CAAAAGAAACCCTCCCAAAAC-3′; and RW, 5′-CGTCAGGTACTTGTTGAAG-3′ and mastermix for real-time polymerase chain reaction (PCR) from Roche-Fast Start SYBR Green Master (Roche, Nutley, NJ, USA). Gene expression level was quantified by Rotor-Gene 6000 system (Corbett, Auckland, New Zealand). For miR-10a quantification, we used the miRNA QRT-PCR detection kit (Stratagene, Houston, TX, USA). The procedure was based on the manufacturer's instructions, and the primer for miR-10a was FW, 5′-TACCCTGTAGATCCGAATT-3′ identical in sequence and length to the miR-10a, and universal reverse primer was in miRNA QRT-PCR detection kit. Relative expression was calculated using ΔCT values normalized with endogenous GAPDH mRNA in the same manner.
Comparison of HOXA1 protein expression
Cytoplasmic HOXA1 protein expression was detected in the treated and control groups by flow cytometry using primary MoAb against HOXA1 and FITC-conjugated secondary antibody (Santa Cruz, CA, USA). Before adding antibody, cell permeabilization was done by the permeabilization kit (DAKO, Glostrup, Denmark) according to the manufacturer's instructions. Mean fluorescence intensity (MFI) of MoAb-reacted proteins was compared in different groups as a protein expression level. We also examined the level of HOXA1 protein in human embryonic kidney (HEK) cell line as a control group that expresses the highest level of miR-10a within the eukaryotic cells.
Results
CD133+ cells expansion
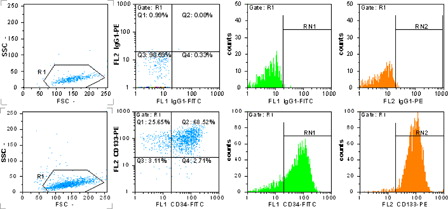
The purity of expanded CD133+ cells after 7 days of culture in expansion media was evaluated by flow cytometry. 94.7 ± 5.3% of total cells was positive for CD133. Whereas the majority of CD133+ cells expressed CD34 surface antigen, the cells were counterstained with both antibodies, and 79.6 ± 7.9% of the cells were positive for CD34, too ().
Figure 1. MACS separated and expanded CD133+ cells detection by flow cytometry. The upper row shows isotype-negative control, the lower row shows CD133- and CD34-positive cells percent. R1 = 98.6%, RN1 = 71.2% = CD34+ cells and RN2 = 94.1% = CD133+ cells.
LNA FITC-Scr treatment
The group treated with 20 nM LNA FITC-Scr showed the highest transfection ratio within other groups treated by different concentrations. 40.2 ± 5.3% of CD133+ cells were FITC positive in flow cytometry analysis together with immunofluorescent microscopy (, ). Therefore, this concentration was used for anti-miR-10a treatment.
Figure 2. (A) Immunoflourescent microscopic picture of LNA FITC-Scr CD133 +-treated cells. (B) Light microscopic picture of the same cells (Leica, Weltzar, Germany ×100). (C) Flow cytometry analysis of LNA FITC-ScrCD133 +-treated cells, R1 = 97.1%, RN1 = 43.2%.
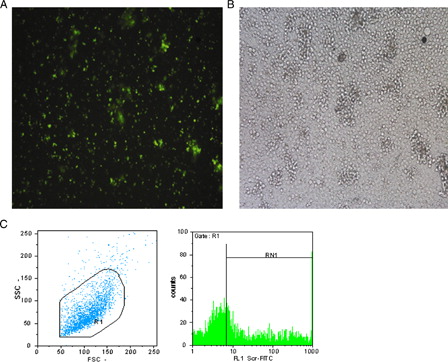
Table 1. The transfected CD133+ cells percentage in different concentration of LNA FITC-scramble
Megakaryocytic differentiation detection in anti-miR-10a-treated cells
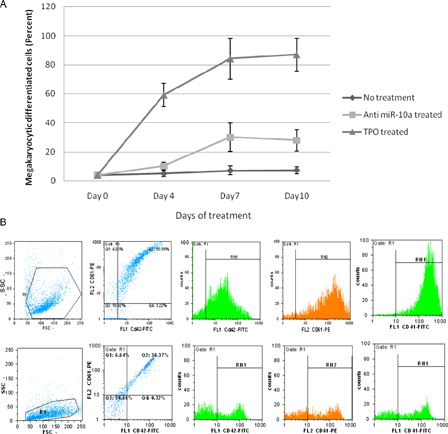
The mean ± SD percentage of CD42/CD61+ and CD41+ cells as Mk differentiation was 7.3 ± 2.5 and 4.0 ± 2.9 in no treatment group; this criterion in anti-miR-10a and TPO-treated groups for CD42/CD61+ cells was 28.5 ± 7.3 and 86.2 ± 11.5 and for CD41+ cells was 24.1 ± 3.9 and 87.3 ± 7.8, respectively (P value < 0.05) ().
Figure 3. The Mk differentiation of CD133+ Hematopoietic stem cells in different treatments. (A) The mean percentage of CD42/CD61- and CD41-positive cells in days of treatment. (B) Flow cytometric analysis of Mk differentiation detection, the upper row shows TPO-treated cells, R1 = 91.9%, CD42/CD61+ cells = 80.9%, CD41+ cells = 86.8%, the lower row shows anti-miR-10a-treated cells, R1 = 93.28%, CD42/CD61+ = 36.3%, CD41+ cells = 30.1%.
Three sizes of colonies were grown in Megacult media on day 14 with 39.1 ± 6.2 and 68.4 ± 16.5 colonies formed in anti-miR-10a and TPO-treated groups, respectively.
Over expression of hoxA1 mRNA and protein in anti-miR-10a-treated cells
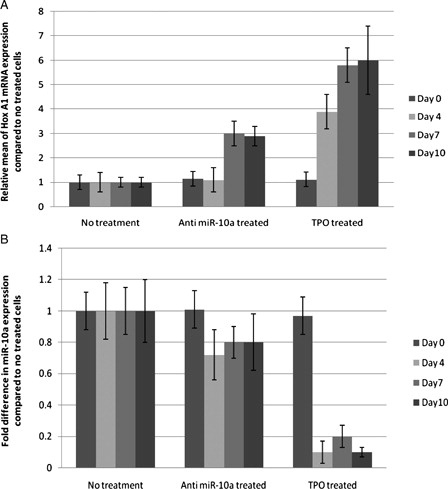
MiRNA target prediction using MIRANDA software showed several Hox genes as putative targets of miR-10a. According to the previous studies using luciferase activity, miR-10a could be an inhibitor of HOXA1 transcription factor (7), it has also been more complimentary with HoxA1 3′UTR, so we performed real-time PCR for the HoxA1. After normalization, we found that HoxA1 mRNA is up-regulated 3-fold in anti-miR-10a-treated and 5.8-fold in TPO-treated cells (P < 0.05). Real-time PCR for miR-10a showed 0.2-fold decrease in anti-miR-10a-treated and 0.8-fold decrease in TPO-treated cells (P value < 0.05) ().
Figure 4. Quantitative real-time PCR. (A) Fold expansion of HOX A1 mRNA in different treatments with respect to CD133+ untreated cells. (B) Fold difference of miR-10a in different treatments with respect to CD133+ untreated cells.
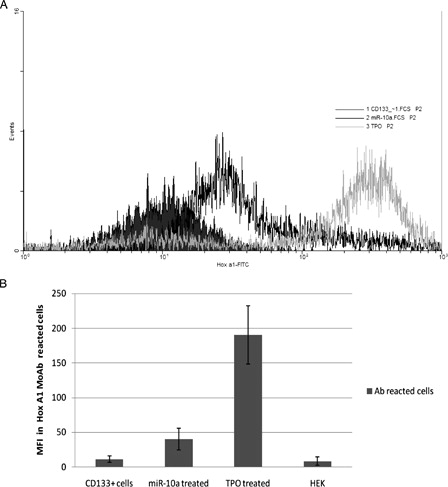
MFI, that shows the level of MoAb-reacted proteins, was compared in different treated cells. The protein expression level showed significant increase during anti-miR-10a treatment. This value in the HEK cell line was in the lowest level as control group ().
Figure 5. Comparison of MFI in the different treated cells that react by FITC-conjugated Hox A1 MoAb. (A) Flow cytometric analysis overlaid histograms. (B) MFI of reacted cells in no treatment CD133+ cells = 11.2 ± 4.6, anti-miR-10a-treated cells = 40.2 ± 15.4, TPO-treated cells = 190.0 ± 42.1, and in HEK cells as a cell line that expresses the most miR-10a level = 8.2 ± 6.2.
Discussion
MiRNAs are emerging as a class of important epigenetic elements that modulate major cellular processes.Citation16–Citation21 Studies in hematopoietic break points have identified several miRNAs together with transcription and growth factors that have critical roles in hematopoietic lineage differentiation.Citation22,Citation23 So far, our knowledge on miRNA expression in Mk series has been based on analysis of in vitro differentiated cells,Citation24–Citation28 and in a recent expression analysis on Mk-derived CD34+ bone marrow cells, 19 miRNAs showed 2- to 10-fold reductions in this lineage differentiation.Citation7 Within them, miR-10a was shown to decrease near 10-fold and targeted HOXA1 mRNA. Therefore, we ectopically induced down-regulation of miR-10a in UCB CD133+ cells and examined its effect on Mk differentiation. As noted, down-regulation of miR-10a promotes Mk differentiation in about 28% of the cells, and differentiation was confirmed by ‘bright expression’ of CD41, CD61, and CD42 surface markers that indicate the presence of more mature Mks.Citation28,Citation29 These cells could form megakaryocytic colonies in Megacult media and so have colonogenic capacity. Because of limited Megacult culture data in other studies, comparing our results to other achieved studies is not possible.
Our data demonstrated that miR-10a has a role in Mk differentiation. With regard to miRNAs function regulating target gene expression via mRNA instability or translation repression, using Target scan and MIRANDA software, we found some putative targets for miR-10a including: HoxA1, HoxA3, HoxD10, CRF, and FLT1. Within them, HoxA1 has more target sites for miR-10a and more sequence compatibility in its mRNA 3′UTR.Citation30,Citation31 In the previous study, direct interaction of miR-10a and 3′UTR sequence of HoxA1 mRNA has been demonstrated by the luciferase reporter assay. Also, Hox gene family has an important role in expansion and differentiation of hematopoietic stem cells, and it has been reported that HoxA1 mRNA is up-regulated during MK differentiation.Citation7,Citation32,Citation33 All together, these data indicate that miR-10a targets HoxA1 mRNA and in agreement with this, we found about 3-fold increase in HoxA1 mRNA expression when the cells were affected by anti-miR-10a, and about 6-fold increase in TPO-treated cells.
Also, we found slight decrease in miR-10a quantification. However, researchers highly recommend determination of the target mRNA and protein level instead of miRNAs quantification because during knockdown oligonucleotide transfection, some of these molecules or complexes are sequestered in internal vesicles and are physically separated from their miRNA targets in the cytoplasm. Then, during cell lysis these oligonucleotides are released and will interact with miRNAs in the lysate; hence, real-time PCR results should be under exact analysis.Citation34
HOXA1 protein level was also sharply up-regulated during Mk differentiation in TPO and less in anti-miR-10a-treated cells confirming the role of this transcription factor in Mk differentiation.
It has been reported in mouse embryo that miR-10a is expressed in Hox-like pattern and closely follows their host Hox cluster during evolution.Citation35 In human genome, miR-10a is located in chromosome 17q21 within the HoxB gene cluster. Reverse transcriptase-PCR showed parallel expression of miR-10a with HoxB4 and HoxB5, which are located at 5′ and 3′, respectively, to miR-10a in the HoxB cluster. It seems that when HoxB and miR-10a are expressed, HoxA1 as a miR-10a target will be decreased, and up-regulation of HOXB4 and down-regulation of HOXA1 transcription factors cause expansion in hematopoietic stem cells, and reverse down-regulation of HoxB and miR-10a genes cause less expansion and more differentiation in hematopoietic stem cells.
Finally, our results indicated the role of miR-10a in Mk differentiation via HoxA1 mRNA targeting. However, because of complexity in miRNAs production and function and their different targets, further studies are needed to determine whether cleavage or translational repression is the main mechanism of down-regulation of HoxA1, and whether miR-10a targets have any role in Mk differentiation. Furthermore, understanding the biological function of miRNAs in hematopoiesis will shed light on the roles of miRNAs in normal hematopoiesis and hematological disorders, and could lead to novel protocols for expansion, differentiation, and therapeutic strategies.
References
- Bartel DP. MicroRNAs: genomics, biogenesis, mechanisms, and function. Cell. 2004;116:281–97.
- Nelson P, Kiriakidou M, Sharma A, Maniataki F, Mourelatos Z. The microRNA world: small is mighty. Trends Biomed Sci. 2003;28:534–40.
- Georgantas W, Hildreth R, Morisot S, Alder J, Liu Ch, Heimfeld Sh, et al. CD34+ hematopoietic stem-progenitor cell microRNA expression and function: a circuit diagram of differentiation control. Proc Natl Acad Sci. 2006;104:2750–5.
- Shivdasani R. MicroRNAs: regulators of gene expression and cell differentiation. Blood. 2006;108:3646–53.
- Chen CZ, Li L, Lodish HF, Bartel DP. MicroRNAs modulate hematopoietic lineage differentiation. Science. 2004;303:83–6.
- Chen Ch, Lodish H. MicroRNAs as regulators of mammalian hematopoiesis. Semin Immunol. 2005;17:155–65.
- Garzon R, Croce C. MicroRNAs in normal and malignant hematopoiesis. Curr Opin Hematol. 2005;15:352–8.
- Ramkisson SH, Mainwaring LA, Ogasawara Y, Keyvanfar K, MC koy JP, Sloand EM, et al. Hematopoietic-specific microRNA expression in human cells. Leuk Res. 2006;30:643–7.
- Yu J, Wang F, Yang G, Wang F, Ma Y, Wen D, et al. Human microRNA clusters: genomic organization and expression profile in leukemia cell lines. Biochem Biophys Res Commun. 2006;349:59–68.
- Zhou B, Wang S, Mayr C, Bartel DP, Lodish HF. miR-150, a microRNA expressed in mature B and T cells, blocks early B cell development when expressed prematurely. Proc Natl Acad Sci. 2007;104:7080–5.
- Masaki S, Ohtsuka R, Abe Y, Muta K, Umemura T. Expression patterns of microRNAs 155 and 451 during normal human erythropoiesis. Biochem Biophys Res Commun. 2007;364:509–14.
- Bruchova H, Merkerova M, Prchal JT. Aberrant expression of microRNAs in polycythemia vera. Haematologica. 2008;93:1009–16.
- Garzon R, Pichiorri F, Palumbo T, Iuliano R, Cimmino A, Aqeilan R, et al. MicroRNA fingerprints during human megakaryocytopoiesis. Proc Natl Acad Sci. 2006;103:5078–83.
- Mansfield JH, Harfe BD, Nissen R, Obenauer J, Srineel J, Chaudhuri A, et al. MicroRNA-responsive ‘sensor’ transgenes uncover Hox-like and other developmentally regulated patterns of vertebrate microRNA expression. Nature. 2004;36:1079–83.
- Eklund EA. The role of HOX genes in malignant myeloid disease. Curr Opin Hematol. 2007;14:85–9.
- Meister G, Tuschl T. Mechanisms of gene silencing by double stranded RNA. Nature. 2004;431:343–9.
- Ambros V. The functions of animal microRNAs. Nature. 2004;431:350–5.
- Baulcombe D. RNA silencing in plants. Nature. 2004;431:356–63.
- Lippman Z, Martienssen R. The role of RNA interference in heterochromatic silencing. Nature. 2004;431:364–70.
- Mello CC, Conte D Revealing the world of RNA interference. Nature. 2004;431:338–42.
- Hannon GJ, Rossi JJ. Unlocking the potential of the human genome with RNA interference. Nature. 2004;431:371–8.
- Merkerova M, Belickova M, Bruchova H. Differential expression of microRNAs in hematopoietic cell lineages. Eur J Hematol. 2008;81:304–10
- Rahimian A, Soleimani M, Kavina S, Aqaee H, Atashi A, Arefian E, Nikougoftar M. Bypassing the maturation arrest in myeloid cell line U937 by over-expression of microRNA-424. Hematology. 2011;16:1–5.
- Choong M, Yang H, McNiece I. MicroRNA expression profiling during human cord blood-derived CD34 cell erythropoiesis. Exp Hematol. 2007;35:551–64.
- Liu C, Calin GA, Meloon B, Gamliel N, Sevignani C, Ferracin M, et al. An oligonucleotide microchip for genome-wide microRNA profiling in human and mouse tissues. Proc Natl Acad Sci. 2004;101:9740–4.
- Felli N, Fontana L, Pelosi E, Pelosi E, Botta R, Bonci D, et al. MicroRNAs 221 and 222 inhibit normal erythropoiesis and erytholeukemic cell growth via kit receptor down-modulation. Proc Natl Acad Sci. 2005;102:18081–6.
- Lewis BP, Shih IH, Jones-Rhoades MW, Bartel DP, Burge CB. Prediction of mammalian microRNA targets. Cell. 2003;115:787–98.
- Lepage A, Leboeuf M, Cazenave JP, La Salle C, Lanza F, Uzan G. The αIIβ β3integrin and GPIb-V-IX complex identify distinct complex stages in the maturation of CD34+ cord blood cells to megakaryocyte. Blood. 2000;96:4169–77.
- Bruno S, Gunetti M, Gammaitoni L, Dane A, Cavalloni G, Sanavio F, et al. In vitro and in vivo megakaryocyte differentiation of fresh and ex vivo expanded cord blood cells: rapid and transient megakaryocyte reconstitution. Hematologica. 2003;88:379–87.
- Krek A, Grun D, Poy MN, Wolf R, Rosenberg L, Epstein E, et al. Combinatorial microRNA target prediction. Nat Genet. 2005;37:495–500.
- John B, Enright AJ, Aravin A, Bino J, Tuschl T, Sander Ch, et al. Human microRNA targets. PLoS Biol. 2004;2:e363.
- Yekta S, Shih I, Bartel D. MicroRNA-directed cleavage of HOXB8 mRNA. Science. 2004;304:594–6.
- Pillai R. MicroRNA function: Multiple mechanisms for a tiny RNA. RNA. 2005;11:1753–61.
- Naguibneva A. An LNATM-based loss-of-function assay for microRNAs. Biomed Pharmacother. 2006;60:633–8.
- Tanzer A, Amemya C, Kim C, Stadler P. Evolution of microRNAs located within Hox gene clusters. J Exp Zool B Mol Dev Evol. 2005;304:75–85.