Abstract
Prognostic stratification of cytogenetic normal acute myeloid leukemia (CN-AML) is an area of active research. The aim of this study was to determine the prognostic importance of the meningioma 1 (MN1) gene expression levels in CN-AML. One hundred patients with CN-AML were diagnosed; MN1 expressions were analyzed using quantitative real-time polymerase chain reaction. High expressions were detected in 48 (48%) patients (expression range: 2.35–31.99, mean: 13.9 ± 8.49) in comparison with 52 (52%) patients with low expression (expression range: 0.02–2.3, mean: 0.68 ± 0.77). The course of the disease in patients with high MN1 expression was unfavorable. Patients with high MN1 expression was associated with significant low complete remission rate (62.5 vs. 8.4%, high vs. low MN1, P = 0.001) and high mortality rate (75% vs. 46.1, P = 0.03). AML patients with high MN1 expression tended to be refractory (37.5 vs. 19.2%, P = 0.00) and relapse risk (54.1 vs. 23%, P = 0.02). Multivariable analysis confirmed high MN1 expression as an independent risk factor for disease-free survival and overall survival. In conclusion, MN1 overexpression independently predicts bad clinical outcome in CN-AML patients.
Introduction
While morphological evaluation of bone marrow (BM) remains a cornerstone for the diagnosis of acute myeloid leukemia (AML), the presence or absence of specific cytogenetic and molecular abnormalities is not only useful for determining overall prognosis, but is also used to guide treatment.Citation1
Approximately 45% of patients with AML have a normal karyotype without chromosomal aberrations on standard cytogenetic analysis,Citation2 and this subgroup is heterogeneous with regard to molecular genetic alterations and therapeutic outcomes. Recently, this large cytogenetic group was shown to be composed of subsets differing for the presence of distinct submicroscopic genetic alterations.Citation3 Submicroscopic genetic lesions not only are relevant for the pathogenesis of the disease, but also influence response to therapy and survival.Citation3,Citation4
The meningioma 1 (MN1) gene is located at chromosome band 22q12 and encodes a protein that participates in a gene transcription regulator complex with the nuclear receptor RAR–RXR or the vitamin D receptor.Citation5,Citation6 The involvement of this gene in human neoplasia was initially discovered in a case of meningioma carrying t(4;22)Citation7 and also found in myeloid malignancies with t(12;22) including AML, myelodysplasia, and chronic myeloid leukemia.Citation8
The connection of MN1 with myeloid malignancy goes beyond MN1's involvement in the t(12;22): it is also overexpressed in inv(16) AML.Citation9,Citation10 In addition, MN1 is overexpressed in myeloid leukemia in which the immortalizing transcription factor EVI1 is overexpressed,Citation11 an AML subtype with a poor prognosis and in some adult AMLs without karyotypic abnormalities.Citation12 Overexpression of MN1 was associated with a worse prognosis and a shorter survival rate.Citation13 Although MN1 is a novel player in AML pathophysiology, the molecular mechanisms via which MN1 inhibits differentiation and stimulates proliferation of hematopoietic cells remain elusive. Several experiments have shown that MN1 functions as a transcriptional coactivator and appears not to bind DNA directly. Thus, its output is relayed via other transcription factors, which may be contacted directly or indirectly. Only indirect interaction via p300/CBP and RAC3 to RAR/RXR has been well documentedCitation5 and might elicit inhibition of differentiation of myeloid cells.Citation13 MN1 can also regulate the activity of the vitamin D receptor (VDR)Citation6 and the fact that this nuclear receptor plays a role in monocyte/macrophage differentiation,Citation14 it is possible that MN1 is also recruited to the VDR via 300/CBP in myeloid cells. The observation that MN1 can also mediate transcriptional up-regulation via CACCC-rich DNA sequences is a clear indication that it also targets transcription factors other than nuclear receptors.Citation1 Recently, Heuser et al.Citation15 reported that common myeloid (CMP) but not granulocyte-macrophage progenitors (GMPs) could be transformed by MN1. In their complementation studies of CMP-signature genes in GMPs demonstrated that MN1-leukemogenicity required the MEIS1/AbdB-like HOX-protein complex. They also identified by ChIP-sequencing common target genes of MN1 and MEIS1 and demonstrated identical binding sites for a large proportion of their chromatin targets. Transcriptional repression of MEIS1 targets in established MN1 leukemias demonstrated antileukemic activity.
The aim of this study was to determine the prognostic importance of the MN1 gene expression levels in cytogenetically normal AML (CN-AML).
Patients and methods
Patients
One hundred patients with AML were diagnosed, treated, and had been followed up until death or for periods up to 24 months (between 2010 and 2012) in Mansoura Oncology Center, Mansoura University. There were 56 males and 44 females; their age range was from 19 to 60 years (mean 40.9 ± 11.2). In addition, 10 healthy volunteers with matched age (24–55, mean 38.4 ± 8.5) and sex (4 females and 6 males) were included in the study as control group after signing consent. Cases were selected for analysis on the basis of sample availability (peripheral blood (PB) and BM). BM samples were the source for RNA extraction and PB when the blast cells counts were more than 20% and BM sample is not available. It has been reported that there is no difference in gene-expression profiles between BM and PB samples in AML by real-time PCR.Citation16
According to the French American British (FAB) classification and their immunophenotyping data, they were divided into: 8 M1, 11 M2, 13 M4, 12 M5, 5 M6, and 1 M7. All of the patients had normal cytogenetics.
AML patients received the standard ‘3 + 7’ induction chemotherapy protocol: doxorubicin (30 mg/m2 per day) for 3 days and cytarabine (100 mg/m2 per day as a continuous 24-hour intravenous infusion) for 7 days. BM aspiration was done between 21 and 28 days after initiation of chemotherapy. Consolidation comprised of three to four courses of high-dose cytosine arabinoside (3 g/m2 every 12 hours on days 1, 3, and 5; total 18 g/m2).Citation17 The total follow-up time was 24 months starting from the date of diagnosis to the date of last contact among patients known to be alive.
Cytogenetic analysis
Pretreatment cytogenetic analyses of BM or PB were performed. Metaphase chromosomes were banded by G-banding technique and karyotyped according to the International System for Human Cytogenetic Nomenclature. A minimum of 20 metaphases was required to be examined for a patient to be classified as having normal cytogenetics.Citation18
NPM1 mutation (NPM1mut) and FLT3-ITD mutation (FLT3-ITD+) were analyzed by polymerase chain reaction (PCR) and Gene Scan assays of BM samples obtained from newly diagnosed 100 CN-AML patients.
DNA isolation and PCR
Genomic DNA was extracted from the diagnostic BM or PB samples by using a DNA blood Mini kit (QIAamp; Qiagen, Valencia, CA, USA) according to the manufacturer's protocol. For NPM1mut analysis, NPM1 exon-12 was amplified by genomic PCR using primers NPM1 11f: 5′-CTG GTA GAA TGA AAA ATA GAT-3′ (6 FAM labeled), NPM1 12r: 5′-CTTGGCAATAGAACCTGGAC-3′. For FLT3-ITD+ analysis, wild-type FLT3 exon-11 and exon-12 were amplified by genomic PCR using primers 11f: 5′ GCA ATT TAG GTA TGA AAG CCA GC 3′ (6 FAM labeled), 12r: 5′ CTT TCA GCA TTT TGA CGG CAA CC 3′.
MN1 mRNA expression by quantitative real-time (QRT) PCR
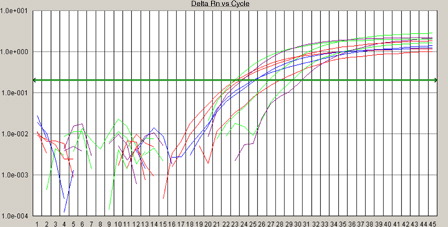
Total RNA was isolated using the QIAamp RNA Blood Mini kit (Qiagen, Hilden, Germany). One microgram total RNA was transcribed into cDNA using random hexamers and multiscribe reverse transcriptase enzyme (High Capacity cDNA Kit; Applied Biosystems, Foster City, CA, USA) under standard conditions. Comparative QRT PCR assays were performed. Each sample was analyzed in duplicate; glyceraldehyde-3-phosphate dehydrogenase (GAPDH) and MN1 were co-amplified in the same tube. GAPDH probe (FAM-5 CAAGCTTCCGTTCTCA-GCC-3-TMRA) with GAPDH forward (5′-GAAGGTGAAGGTCGGAG-TC3′) and reverse (5′-GAAG-AT GGTGATGGGAT-TTC-3′) primers, and MN1 forward (5′-GACGACGACAAGACGT-TGG-3′) and reverse (5′-GACAGACAGGCACTGCAAG-3′) primers. The reaction mixture was made in a final volume of 50 µl containing 5 µl cDNA, 400 µM of each primer and 25 µl Taq PCR master mix (2.5 units Taq DNA polymerase, 1× PCR buffer, and 200 µM of each dNTP) (Taq PCR master kit, Qiagen). Reactions were performed using real-time PCR 7000 sequence detection system (Applied Biosystems). Amplification was carried out at 50°C for 2 minutes, 95°C for 10 minutes, followed by 40 PCR cycles at 95°C for 15 seconds, and 60°C for 1 minute (Bienz et al., Citation2005; Baldus et al., Citation2006b). MN1 mRNA expression was normalized to the simultaneously analyzed GAPDH. The comparative cycle threshold (CT) method was used to determine the relative expression levels of MN1, and the cycle number difference (ΔCT = CT MN1 − CT GAPDH) was calculated for each sample. Relative MN1 expression values are expressed as 2 (ΔCT) (see ).
Figure 1. Amplification plots of MN1 gene and GAPDH using real-time PCR. Real-time analysis of MN1 gene expression; the comparative CT method was used to determine the relative expression levels of MN1, and the cycle number difference (ΔCT = CT MN1 − CT GAPDH) was calculated for each sample. Relative MN1 expression values are expressed as 2 (ΔCT).
Statistical analysis
To evaluate the impact of MN1 expression values on clinical outcome without seeking an optimal cut point, AML samples were dichotomized at the median expression value and divided into two expression groups: low MN1 if they had expression values within the lower 50% and as high MN1 if they had MN1 expression values within the upper 50%. Baseline clinical features across groups were compared using the χ2 or a two-sided Fisher's exact test, and the non-parametric Mann–Whitney U test for continuous variables. A P value less than 0.05 was considered significant.
Results
MN1 expression and clinical features
Based on the median level of MN1 expression (2.337),Citation18 out of 100 AML patients there are 48 (48%) patients with high MN1 expression (range: 2.35–31.99, mean ± SD: 13.9 ± 8.49) and 52 (52%) patients with low MN1 expression (range: 0.02–2.3, mean ± SD: 0.68 ± 0.77). No statistical differences were observed between patients with low and high MN1 expression as regard to age (P = 0.77), sex (P = 0.88), WBC count (P = 0.27), hemoglobin concentration (P = 0.14), platelet count (P = 0.35), percentage of BM blasts (P = 0.22) and PB blast (P = 0.79), or other presenting physical and chemical laboratory findings ().
Table 1. AML patients characteristics according to MN1 expression status
The distribution of high MN1 expression was more frequent in M2, M4, and M5 subtypes (18.7, 31.2, and 20.8%, respectively,) as compared with low MN1 expression (15.3, 19.2, and 17.3%, respectively). On the other hand, high expression was less frequent in M0, M1, and M6 subtypes (6.25, 10.4, and 12.5%, respectively,) as compared with low MN1 expression (11.5, 21.1, and 15.3%, respectively; P = 0.504) ().
MN1 expression in relation to other molecular prognostic markers
The frequency of FLT3+ and NPM1wt was the highest among the AML group with high MN1expression; whereas FLT3− and NPM1mut are of high frequency among a group of AML patients with low MN1 expression ().
Table 2. Interrelation between NPM1 and FLT3-ITD mutations and MN1 expression
MN1 expression and prognostic impact
The course of the disease in AML patients with high MN1 expression was unfavorable. Patients with high MN1 expression was associated with significant low complete remission (CR) rate achieved after induction therapy (62.5 vs. 88.4%, high vs. low MN1, P = 0.001) and high mortality rate (75 vs. 46.1%, P = 0.03). Again, AML patients with high MN1 expression tended to be refractory (37.5 vs. 19.2%, P = 0.00) and relapse risk (54.1 vs. 23%, P = 0.02) more frequently than those with low MN1 expression ().
Table 3. Comparison between high and low expression of MN1 as regards to AML patients outcome
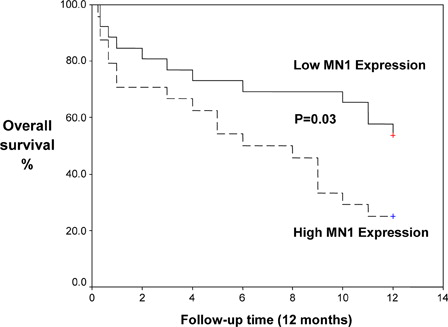
Kaplan–Meier analysis demonstrated that high MN1 expression was associated with significantly shorter disease-free survival (DFS; mean 5.3 vs. 8.8 months, P = 0.04) and overall survival (OS; mean 6.4 vs. 10.82 months, P = 0.03) ( and ).
Figure 2. Kaplan–Meier curve for DFS in CN-AML patients according to MN1 expression.
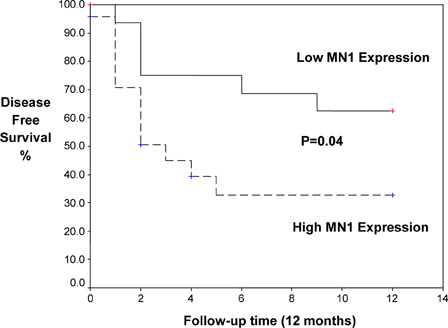
Figure 3. Kaplan–Meier curve for OS in CN-AML patients according to MN1 expression.
Applying odds ratio of higher to lower MN1 expression showed that patients with high MN1 expression were 3.5 (95% confidence interval (CI): 1.05–11.6; P = 0.03) times more likely to die than patients with low MN1 expression. Furthermore, higher MN1 expression cases were 0.06 (95% CI: 0.013–0.355; P = 0.001) times likely to be completely remission in comparison with lower MN1 expression, meanwhile there was statistically non-significant increase of the relapse (3.93, 95% CI: 1.16–13.28, P = 0.02) and refractory risk ratio (12.66, 95% CI: 3.3–48.5, P = 0.23) for higher to lower MN1 expression, respectively ().
Table 4. Odds ratio assessment in patients with higher MN1 expression as compared with those with lower expression
A multivariable analysis was conducted to determine whether MN1 expression represents an independent prognostic marker in normal karyotype AML. After adjusting for the other covariates including age, WBCs, and FAB subtype, high MN1 expression remained a significant independent predictor for OS and DFS ().
Table 5. OS and DFS as dependent parameters studied with other covariates (multivariate analysis)
Discussion
In the present study, high MN1 expression was detected in 48% of CN-AML patients. Similar finding was reported by Heuser et al.,Citation12 who found that 50% of AML patients had high MN1 expression and they stated that MN1 is a very potent oncogene in hematopoiesis that both promotes proliferation/self-renewal, and blocks differentiation by repressing transcription of differentiation-associated genes. Ectopic MN1 expression not only inhibited granulocytic differentiation, but also vitamin D3, macrophage-colony stimulating factor (M-CSF), or growth factor-induced monocytic differentiation of human CD34+ cells, primary hematopoietic cells, and AML cell lines in vitro. Several reports suggested that high MN1 levels are important for the growth of leukemic cells, and that increased MN1 expression can synergize with other transforming fusion genes in leukemia induction through a distinct gene expression program that is able to expand the leukemia-initiating cell population.Citation19–Citation21
The MN1 high expression was significantly more frequent in M2, M4, and M5 subtypes; On the other hand, high expression was significantly less frequent in M0, M1, and M6 subtypes. Sun et al.Citation22 suggested that high MN1 expression is associated with all inv(16) AML, retinoic acid-resistance, a worse prognosis as well as a shorter survival in AML patients with a normal karyotype. In addition, Rosenbauer and TenenCitation23 found that forced expression of MN1 in human CD34+ cells increased their self-renewal, proliferation, survival, and cell cycle traverse in response to hematopoietic growth factors in vitro.
The association between high MN1 expression and FLT3-ITD+/NPMwt and low MN1 expression and FLT3-ITD-/NPMmut is pointing for the prognostic impact of MN1 overexpression. The negative impact of FLT3-ITD+/NPM1− has been emerged in several studies.Citation23,Citation24
The course of the disease in patients with high MN1 expression was unfavorable. Patients with high MN1 expression was associated with significant low CR rate achieved after induction therapy (62.5 vs. 88.4%, high vs. low MN1, P = 0.001) and high mortality rate (75 vs. 46.1%, P = 0.03). Again, AML patients with high MN1 expression tended to be refractory (37.5 vs. 19.2%, P = 0.00) and relapse risk (54.1 vs. 23%, P = 0.02) more frequently than those with low MN1 expression. This is in agreement with the findings reported by Heuser et al.Citation25 who found that MN1 is as an independent prognostic marker in AML patients. MN1 overexpression is associated with treatment failure, specifically a significantly worse day 15 response rate, higher relapse rate, and shorter relapse-free and OSs. GrosveldCitation26 showed that the levels of MN1 expression directly correlated with the risk of failing remission induction chemotherapy, relapse, and/or death, and predicted outcome independently of other clinical and molecular variables. Heuser et al.Citation12 discovered that AML patients overexpressing MN1 without karyotypic abnormalities had a worse prognosis and a shorter survival rate. Relapse-free survival for patients with good response was significantly shorter in patients with high MN1 expression compared with low MN1 expression.
The odds ratio of AML with higher to lower MN1 expression showed that patients with high MN1 expression were 3.5 (95% CI: 1.05–11.6; P = 0.03) times more likely to die than patients with low MN1 expression; furthermore, higher MN1 expression cases were 0.06 (95% CI: 0.013–0.355; P = 0.001) times likely to have completely remission in comparison with lower MN1 expression, meanwhile there was statistically non-significant increase of the relapse (3.93, 95% CI: 1.16–13.28, P = 0.02) and refractory risk ratio (12.66, 95% CI: 3.3–48.5, P = 0.23) for higher to lower MN1 expression, respectively. Heuser et al.Citation25 reported that high levels of MN1 expression negatively impact on the outcome of CN-AML. They showed that the levels of MN1 expression directly correlated with the risk of failing remission induction chemotherapy, relapse, and/or death, and predicted outcome independently of other clinical and molecular variables. Schwind et al.Citation27 found that low MN1 expression associated with favorable prognosis in younger adults with CN-AML, low MN1 expressers had higher CR rates, and longer OS and event-free survival. In multivariable models, low MN1 expression was associated with better CR rates and event free survival (EFS). Low MN1 expression confers better prognosis in older CN-AML patients and may refine the European Leukemia Net classification. Biological features associated with MN1 expression may help identify new treatment targets.
In the current study multivariate analysis after adjusting for the other covariates including age, WBCs, and FAB subtype, high MN1 expression remained a significant independent predictor for OS and DFS. This is in agreement with the results reported by Langer et al.Citation28 who found that in multivariable analyses, higher MN1 expression associated with a lower CR rate (P = 0.00), shorter DFS (P = 0.01), and shorter survival (P = 0.04). In addition, Junghanss et al.Citation29 revealed that MN1 is an independent prognostic parameter for OS in addition to age and Eastern Cooperative Oncology Group (ECOG) performance status.
Damm et al.Citation30 construct integrated prognostic risk score (IPRS). The IPRS involved nine clinical, hematological, and molecular factors, including age, white blood cell count, mutation status of NPM1, FLT3-ITD, CEBPA, and SNP rs16754, and expression levels of BAALC, ERG, MN1, and WT1. Other markers, such as NRAS, MLL-PTD, WT1, IDH1, or IDH2 mutations, were not significant and thus not included in the IPRS. Patients in the learning set had a median score of 10 (range, 2–15). Patients with 0–7, 8–10, or 11–15 points were assigned to the low-, intermediate-, or high-risk groups, respectively.
In conclusion, MN1 overexpression independently predicts bad clinical outcome in CN-AML patients. MN1 overexpression is associated with poor induction response, shorter relapse-free survival, and shorter OS. This will lead to improve risk stratification of this heterogeneous group of patients with AML.
References
- Byrd JC, Mrózek K, Dodge RK, Carroll AJ, Edwards CG, Arthur DC, et al. Pretreatment cytogenetic abnormalities are predictive of induction success, cumulative incidence of relapse, and overall survival in adult patients with de novo acute myeloid leukemia: results from Cancer and Leukemia Group B (CALGB 8461). Blood 2002;100:4325–36.
- Mrozek K, Heerema NA, Bloomfield CD. Cytogenetics in acute leukemia. Blood Rev. 2004;18:115–36.
- Mrózek K, Marcucci G, Paschka P, Whitman SP, Bloomfield CD. Clinical relevance of mutations and gene-expression changes in adult acute myeloid leukemia with normal cytogenetics: are we ready for a prognostically prioritized molecular classification? Blood 2007;109:431–48.
- Baldus CD, Mrozek K, Marcucci G, Bloomfield CD. Clinical outcome of de novo acute myeloid leukaemia patients with normal cytogenetics is affected by molecular genetic alterations: a concise review. Br J Haematol. 2007;137:387–400.
- Van Wely KHM, Molijn AC, Buijs A, Meester-Smoor MA, Aarnoudse AJ, Hellemons A, et al. The MN1 oncoprotein synergizes with coactivators RAC3 and p300 in RAR-RXR-mediated transcription. Oncogene 2003;22:699–709.
- Sutton ALM, Zhang X, Ellison TI, Macdonald PN. The 1,25(OH)2D3-regulated transcription factor MN1 stimulates vitamin D receptor-mediated transcription and inhibits osteoblastic cell proliferation. Mol Endocrinol. 2005;19:2234–44.
- Deprez RHL, Riegman PHJ, Groen NA, Warringa UL, van Biezen NA, Molijn AC, et al. Cloning and characterization of MN1, a gene from chromosome 22q11, which is disrupted by a balanced translocation in a meningioma. Oncogene 1995;10:1521–8.
- Buijs A, Sherr S, van Baal S, van Bezouw S, van der Plas D, Geurts van Kessel A, et al. Translocation (12;22)(p13;q11) in myeloproliferative disorders results in fusion of the ETS-like TEL gene on 12p13 to the MN1 gene on 22q1. Oncogene 1995;10:1511–9.
- Du Y, Jenkins NA, Copeland NG. Insertional mutagenesis identifies genes that promote the immortalization of primary bone marrow progenitor cells. Blood 2005;106:3932–9.
- Barjesteh van Waalwijk van Doorn-Khosrovani S, Erpelinck C, van Putten WL, Valk PJ, van der Poel-van de Luytgaarde S, Hack R, et al. High EVI1 expression predicts poor survival in acute myeloid leukemia: a study of 319 de novo AML patients 3. Blood 2003;101:837–45.
- Carella C, Bonten J, Sirma S, Kranenburg TA, Terranova S, Klein-Geltink R, et al. MN1 overexpression is an important step in the development of inv(16) AML. Leukemia 2007;21:1679–90.
- Heuser M, Argiropoulos B, Kuchenbauer F, Yung E, Piper J, Fung S, et al. MN1 overexpression induces acute myeloid leukemia in mice and predicts ATRA resistance in AML patients. Blood 2007;110:1639–47.
- O'Kelly J, Hisatake J, Hisatake Y, Bishop J, Norman A, Koeffler HP. Normal myelopoiesis but abnormal T lymphocyte responses in vitamin D receptor knockout mice. J Clin Invest. 2002;109:1091–9.
- Meester-Smoor MA, Molijn AC, Zhao Y, Groen NA, Groffen CA, Boogaard M, et al. The MN1 oncoprotein activates transcription of the IGFBP5 promoter through a CACCC-rich consensus sequence. J Mol Endocrinol. 2007;38:113–25.
- Heuser M, Yun H, Berg T, Yung E, Argiropoulos B, Kuchenbauer F, et al. Cell of origin in AML: susceptibility to MN1-induced transformation is regulated by the MEIS1/AbdB-like HOX protein complex. Cancer Cell 2011;20(1):39–52.
- Sakhinia E, Farahangpour M, Tholouli E, Liu Yin JA, Hoyland JA, Byers RJ. Comparison of gene expression profiles in parallel bone marrow and peripheral blood samples in acute myeloid leukemia by real time polymerase chain reaction. J Clin Pathol. 2006;59(10):1059–65.
- Greer J, Baer M, Kinnery M. Acute myelogenous leukemia. In: , Lee G, Foester J, Leukens J, Pareskerva F, Greer J, Rogers G (eds.) Wintrobe's clinical hematology. 12th ed. Philadelphia: Lippincott Williams and Wilkins; 2009. p. 2045–62.
- Michael W. Pfaffl. Quantification strategies in real-time PCR. A–Z of quantitative PCR 2004;3:87–112.
- Liu T, Jankovic D, Brault L, Ehret S, Baty F, Stavropoulou V, et al. Functional characterization of high levels of meningioma 1 as collaborating oncogene in acute leukemia. Leukemia 2010;24:601–12.
- Valk PJ, Verhaak RG, Beijen MA, Erpelinck CA, Barjesteh van Waalwijk van Doorn-Khosrovani S, Boer JM, et al. Prognostically useful gene-expression profiles in acute myeloid leukemia. N Engl J Med. 2004;350:1617–28.
- Kawagoe H, Grosveld GC. Conditional MN1-TEL knock-in mice develop acute myeloid leukemia in conjunction with over expression of HOXA9 13. Blood 2005;106:4269–77.
- Sun HM, Qian SX, Li JY. Advance of study on MN1 gene in acute myeloid leukemia. Zhongguo Shi Yan Xue Ye Xue Za Zhi. 2009;17:504–8.
- Rosenbauer F, Tenen DG. Transcription factors in myeloid development: balancing differentiation with transformation. Nat Rev Immunol. 2007;7:105–17.
- Verhaak RG, Goudswaard CS, van Putten W, Bijl MA, Sanders MA, Hugens W, et al. Mutations in nucleophosmin (NPM1) in acute myeloid leukemia (AML): association with other gene abnormalities and previously established gene expression signatures and their favorable prognostic significance. Blood 2005;106:3747–54.
- Heuser M, Beutel G, Krauter J, Döhner K, von Neuhoff N, Schlegelberger B, et al. High meningioma 1 (MN1) expression as a predictor for poor outcome in acute myeloid leukemia with normal cytogenetics. Blood 2006;108:3898–905.
- Grosveld GC. MN1, a novel player in human AML. Blood Cells Mol Dis. 2007;39:336–9.
- Schwind S, Marcucci G, Kohlschmidt J, Radmacher MD, Mrózek K, Maharry K, et al. Low expression of MN1 associates with better treatment response in older patients with de novo cytogenetically normal acute myeloid leukemia. Blood 2011;118:4188–98.
- Langer C, Marcucci G, Holland KB, Radmacher MD, Maharry K, Paschka P, et al. Prognostic importance of MN1 transcript levels, and biologic insights from MN1-associated gene and microRNA expression signatures in cytogenetically normal acute myeloid leukemia: a cancer and leukemia group B study. J Clin Oncol. 2009;27:3198–204.
- Junghanss C, Waak M, Knopp A, Kleine HD, Kundt G, Leithäuser M, et al. Multivariate analyses of prognostic factors in acute myeloid leukemia: relevance of cytogenetic abnormalities and CD34 expression. Neoplasma 2005;52:402–10.
- Damm F, Heuser M, Morgan M, Wagner K, Görlich K, Grosshennig A, et al. Integrative prognostic risk score in acute myeloid leukemia with normal karyotype. Blood 2011;117:4561–8.
- Baldus CD, Thiede C, Soucek S, Bloomfield CD, Thiel E, Ehninger G. BAALC expression and FLT3 internal tandem duplication mutations in acute myeloid leukemia patients with normal cytogenetics: prognostic implications. J Clin Oncol. 2006;24(5):790–7.
- Bienz M, Ludwig M, Leibundgut EO, Mueller BU, Ratschiller D, Solenthaler M, et al. Risk assessment in patients with acute myeloid leukemia and a normal karyotype. Clin Cancer Res. 2005;11(4):1416–24.