Abstract
Measurement of minimal residual disease (MRD) maintains an important role in the clinical management of acute lymphoblastic leukemia (ALL). Recently, we identified Fat1 cadherin as a unique and independent prognostic factor for relapse-free and overall survival in pediatric pre-B-ALL. Here, we analyzed Fat1 mRNA for its potential as a novel marker of MRD in cases of pre-B- and T-ALL. Analyses of microarray data from 125 matched diagnosis/relapse samples across three independent datasets indicate that Fat1 mRNA is detectable in an average of 31.3% of diagnosed pre-B-ALL, of which 67.5% of cases remained positive at relapse. Furthermore, some 20% of cases with undetectable levels of Fat1 mRNA at diagnosis became positive upon relapse. T-ALL cases were 83.3% positive for Fat1 expression at diagnosis with 77.7% remaining positive at relapse. Towards proof of concept, we developed a quantitative polymerase chain reaction assay and demonstrate detection of Fat1 mRNA in leukemic cells mixed with normal peripheral blood cells at a sensitivity of 1 in 10 000 to 100 000 cells. Fat1 may therefore provide a new marker of MRD for patients with ALL lacking known genomic aberrations or within a multiplex approach to MRD detection.
Introduction
Advances in leukemia therapy have resulted in 5-year event-free survival rates of nearly 90% in children with acute lymphoblastic leukemia (ALL). However, a considerable proportion of these patients suffer relapse due to the persistence of leukemic cells (termed minimal residual disease; MRD) within the peripheral blood (PB) or bone marrow (BM). Levels of MRD are often proportional to risk of relapse, and have been shown in numerous studies to provide the most reliable prognostic indication of treatment outcome.Citation1,Citation2 Results of early tests for MRD often determine future management strategies by indicating response to treatment, providing valuable information for adjusting the chemotherapy intensity and proper timing for stem cell transplantation.Citation3,Citation4
Unfortunately, approximately 60% of both adult and pediatric cases of ALL lack a recurrently identified genetic abnormality that can be used for MRD studies in clinical samples.Citation4,Citation5 For these patients, the only alternative is to design allele-specific oligonucleotides to the unique gene rearrangement coding for the B- or T-cell receptor that identifies their leukemic clone. Establishment of such laborious patient-specific assays is not practical in a diagnostic setting, and up to 10% of all cases remain initially unsuitable for this approach.Citation3 Moreover, false-negative results at relapse can occur due to clonal evolution and/or oligoclonality of a lesser dominant leukemic sub-clone from 2 to 6% that is no longer detected by the assay.Citation6,Citation7 Accordingly, this has prompted the search for more generic MRD markers for ALL that are developmentally genotype independent.Citation8
We have recently shown that a type I transmembrane protein belonging to the cadherin superfamily, Fat1, is overexpressed in 29 and 63% of clinical samples diagnosed as B and T subtypes of ALL, respectively, while having no significant expression across all normal multi-potent lineages during hematopoiesis.Citation9 Further, the level of Fat1 expression was prognostic for relapse and overall survival in paired diagnosis-relapse samples of pediatric pre-B-ALL patients. Hence, we considered whether Fat1 could provide a new diagnostic marker for MRD assessment. Here, we provide proof of concept using in silico microarray data analysis and the establishment of a quantitative real-time polymerase chain reaction (PCR) (qPCR)-based assay.
Methods
Analysis of microarray gene expression data
Publicly available microarray datasets deposited in NCBI GEO database for paired diagnosis/relapse children with B-cell acute lymphoblastic leukemia (B-ALL) (GSE28460,Citation10 GSE18497,Citation11 and GSE391012) and T-ALL (GSE1849711 and GSE391012) were used together with GSE28497.Citation8 Data were analyzed using the MAS5.0 algorithm (Expression Console software V1.1, Affymetrix, Santa Clara, CA, USA) to generate an absolute call for each gene according to their signal P values. The level of the Fat1 transcript was defined as present if P value ≤0.05, absent if P value >0.065, and marginal if the P value falls in between these definitions. The GSE2475913 dataset showing gene expression signatures throughout multi-lineage hematopoiesis was similarly analyzed but using the RMA algorithm to generate expression values in the form of signal intensity for selected genes in each hematopoietic subpopulation.
qPCR titration assay
Initial optimization of Fat1-specific primers () was carried out using cDNA isolated from the Fat1-positive pre-B acute lymphoblastic cell line LK63 (data not shown). To measure the detectable sensitivity of specified transcripts, normal PB samples were artificially spiked with serial dilutions of either LK63 preB-ALL, MOLT-4T-ALL, or THP-1 acute monocytic leukemia cell lines as indicated. Briefly cells were 10-fold serially diluted in healthy whole PB to achieve a ratio of 0.1–0.001% of leukemic cells to normal white blood cell counts. Subsequently, mononuclear cells (MNCs) were separated on Ficoll and collected for RNA extraction (Illustra RNAspin Mini Kit, GE Healthcare, Rydalmere, NSW, Australia). Total RNA was reverse transcribed to cDNA using the Transcriptor High Fidelity cDNA synthesis kit with random hexamer primers (Roche Diagnostics, Castle Hill, NSW, Australia) and qPCR reactions performed using the SensiMix™ SYBR green master mix (30 ng cDNA diluted in final volume of 12.5 µl; Bioline, Eveleigh, NSW, Australia). Cycling conditions were 10 minutes at 95°C followed by 45 cycles at 95°C/15 seconds and 60°C/60 seconds with subsequent melt curve analysis (95°C 15 seconds/60°C 60 seconds/95°C 15 seconds) using an ABI-Applied Biosystems 7500 Thermal Cycler (Life Technologies, Mulgrave, VIC, Australia). Results were normalized against two housekeeping genes Gus B and ABL1 using relative comparative quantification algorithms (ΔCt methodCitation14).
Table 1. Oligonucleotide primer sequences used for the qPCR assay
Results and discussion
Fat1 cadherin as a putative MRD marker
The first major criterion for a candidate MRD marker is its differential expression between leukemic and normal cells – being high in leukemic and low or negative in normal counterparts – since MRD is the measurement of rare cells, ideally other normal blood cells do not express the MRD marker. To assess Fat1 on this criterion, gene expression levels of a selection of previously proposed leukemia biomarkersCitation8,Citation15–Citation17 () were compared with Fat1 using analysis of gene expression array dataset of the major hematopoietic populations obtained from healthy BM.Citation13 displays the rank order of signal intensity for each of the 22 genes analyzed with a corresponding specific lineage marker shown for each subpopulation. From the analysis it is evident that some of the previously reported genes appear to be technically limited in their usefulness as MRD markers because they were highly expressed in normal hematopoietic populations. Moreover, in several instances their relative expression exceeded that of the lineage-specific markers. With respect to Fat1 transcript levels determined throughout hematopoiesis, its expression was consistently ranked as very low or negligible within all multi-lineal hematopoietic populations examined with the exception of the later stages of erythropoiesis (refer to Late ERY in B).
Figure 1. Expression profiles of candidate MRD genes including Fat1 in normal hematopoietic stem cells and in defined hematopoietic lineages isolated from human BM. Gene expression depository data GSE24759 were used to generate signal intensity values using Affymetrix console package under RMA algorithm. Except for late erythropoiesis, expression of Fat1 (highlighted in red box) remains negative to low in all hematopoietic populations analyzed. Full definitions of the hematopoietic sub-populations are presented in Table S1.
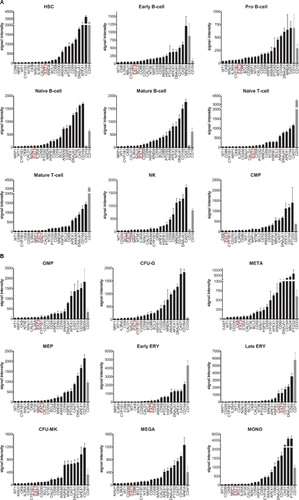
Table 2. Genes proposed as potential markers of MRD in pre B-ALL
As MRD assessment is frequently performed on BM samples where significant numbers of erythroid precursors are present, it was pertinent to consider whether Fat1 expression in the erythroid precursors would interfere with the detection of leukemic cells. Notably, while the expression of Fat1 is clearly above background levels in the erythroid precursor subsets, the levels of expression are still relatively low compared with the lineage-specific marker CD71 (B). We have previously established that PBMNCs have no detectable levels of Fat1 using qPCR and Western blotting.Citation9 Comparative testing of PBMNCs versus whole BM using the same qPCR assay against Fat1 showed that the baseline readings in either cell isolate are equivalent (28.2 ± 5.2 for PBMNC and 27.7 ± 2.36 for BM). These results indicate that the low levels of Fat1 detected within the erythroid precursor signature would not compromise detection of Fat1 in the context of an MRD assay.
In addition to differential expression, a marker for MRD should be expressed in a significant proportion of leukemic cells from patients and/or provide an alternative marker for a smaller proportion of cases for which no marker is currently available. For example, in the case of some pre-B-ALL patients their tumor cells are without any suitable chromosomal aberrations frequently used for MRD detection. From the analysis of multiple datasets we have previously shown that Fat1 is overexpressed in 63% of T-ALLs and 29% of the more frequent subtype, B-lineage ALL.Citation9 Using the dataset of Coustan-Smith et al.Citation8 we found that 15.6% of pre-B-ALL tumors that are without known chromosomal translocations and gene mutations overexpress Fat1. Thus Fat1 could be readily utilized as an appropriate MRD marker in these patients. Notwithstanding this application, given Fat1 is also overexpressed in the context of a significant proportion of ALL cases, its inclusion as part of multiplex gene set would provide value in the context of generic solution for MRD detection.
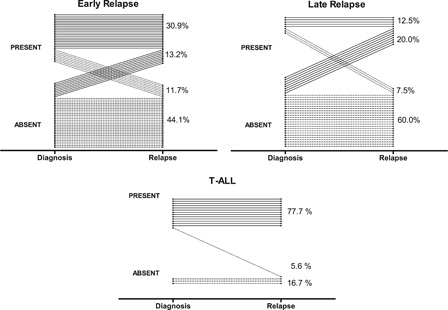
Finally, the stability of expression of a marker at diagnosis and at the time of relapse is another essential feature for a marker to be considered in MRD molecular-based assays. To determine the stability pattern of Fat1 expression in pediatric ALL at the time of diagnosis and relapse, we analyzed the microarray data generated by three independent groups,Citation10–Citation12 who each performed genome-wide expression arrays on matched samples collected at diagnosis and relapse. Using this resource, we rationalized the Fat1 expression levels as either present, absent, or marginal (see Methods) from a total number of 108 and 17 children diagnosed with pre-B- and T-ALL, respectively (). Overall, Fat1 mRNA was recorded as present in 31.3 and 83.3% of de novo B-ALL and T-ALL samples, respectively, consistent with our own previous analysis of clinical ALL samples using qPCR.Citation9 Importantly as illustrated in A and B, within the pre-B-ALL cases scored Fat1-postive at diagnosis, 72.5 and 62.5% of these remained as present calls at early and late relapse, respectively. Most interestingly, 13.2 and 20% of the cases deemed absent for Fat1 expression at the time of diagnosis became Fat1-positive in the early and late relapse samples, respectively. Conversely, only a very small number of patients showed loss of detectable Fat1 transcript either at early (11.7%) or late (7.5%) relapse. Overall, 38.3% of pre-B-ALL cases were positive for Fat1 at the time of relapse. Additionally, the vast majority of T-ALL cases remained Fat1-positive at relapse (C). Therefore as Fat1 is both sustainably expressed and even frequently acquired in pre-B ALL during the course of the disease, the expression of Fat1 fulfils this further requirement for a reliable marker of MRD.Citation1
Figure 2. Comparative determination of Fat1 transcript expression in childhood ALL samples at the time of diagnosis and relapse in pre-B-ALL (top) and T-ALL (bottom). Relapse events in B-ALL cases were categorized at early (<36 months) and late (≥36 months). The GSE28460, GSE18479, and GSE391010–12 microarray datasets were analyzed according to the Methods section to generate Fat1 transcript expression levels as absolute calls of absent, marginal, or present in matched diagnosis/relapse BM samples. Fat1 expression is plotted for individual patients as diagnosis and relapse calls for each of 125 pairs of samples across all three datasets. No calls were defined as marginal in this analysis. Separate data analyses of individual pre B-ALL datasets are shown in Fig. S1.
A qPCR assay to sensitively measure Fat1 levels
A useful marker of MRD also requires the practical ability to measure these differences in a robust and sensitive manner that is compatible with clinical standards. We have previously developed a qPCR assay to show the expression of Fat1 mRNA in a range of blood and BM samples from patients with leukemic blasts, and to demonstrate its absence in normal PB and whole BM cells from healthy donors.Citation9 To establish the quantitative limits of our assay, here we establish the sensitivity of Fat1 detection in a mock MRD samples made by spiking leukemia cell lines into normal PB. To compare the sensitivity and specificity of the Fat1 primers, we qualified our results against the transcript levels of Wilms' tumor gene 1 (WT1) that has extensively being studied and standardized as a pan-leukemic MRD marker in acute myeloid leukemia.Citation10 WT1 is also expressed by some ALLs,Citation11 although it has been ruled out as practical MRD marker in lymphoid malignancies.Citation12,Citation13 In our experiments expression of WT1 could be detected in both MOLT-4 and THP-1 but not in LK-63 leukemic cells. The measured levels of both Fat1 and WT1 were normalized against two housekeeping genes Gus B and ABL1 using relative comparative quantification algorithms (ΔCt methodCitation14). Our results are summarized in and demonstrate the maximal sensitivity of the qPCR assay with detection of Fat1 signals down to a quantitative level of 1 leukemic cell per 100 000 normal cells using LK-63 cells (A). Detection of Fat1 in MOLT-4 and THP-1 cells was detectable down to 1 in 10 000 cells that matched the sensitivity observed using WT1 primers (B and C, respectively).
Figure 3. Determination of sensitivity of Fat1 detection using qPCR in a simulated MRD assay. Dilution experiments were performed on three leukemic cell lines: (A) LK-63 (B-lymphoid), (B) MOLT-4 (T-lymphoid), and (C) THP-1 (myeloid) expressing Fat1 at relatively high, medium, and low expression levels, respectively.9 Samples were processed and qPCR assays were performed to measure Fat1 transcript levels using GusB and ABL housekeeping genes according to the text, inclusive of assays for WT1 that served as a standard for sensitivity measurements. LK-63 cells do not express WT1. Values plotted are the mean cDNA copy number ±SEM calculated from determinations using three different blood donors. A two-tailed Student's t-test was used to compare the cDNA copy number of individual tests against data obtained from PBMNCs alone (*P < 0.05, **P < 0.01). The mean Ct value is also plotted above each histogram bar. Similar results were obtained in independent experiments with PB collected from three different individuals.
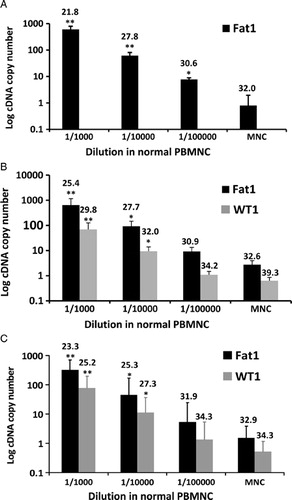
Guidelines for MRD have been established by the European Study Group on MRD detection in ALL who developed a working definition to consider both the quantitative range and sensitivity of the MRD measurements.Citation18 The ‘quantitative range’ is the highest dilution of sample that meets two criteria: first the cycle threshold (Ct) of the highest replicates should be at least 3.0 Ct lower than that of the lowest background and second, all the positive Ct's should fall within a 1.5 cycle difference. However, ‘maximal sensitivity’ is the dilution in which at least one of the three replicates is positive in quantitative range and the lowest Ct is at least one cycle less than background. Evaluation of our results by these criteria shows that Fat1 detection in leukemic cells has a quantitative sensitivity of 1 leukemic cell per 10 000 normal cells in all three leukemic cell lines evaluated. Performance of the Fat1 qPCR assay was similar to primer sets detecting WT1 (B and C). Collectively, these data indicate that the qPCR assay devised for Fat1 matches the accepted technical requirements for use as a marker of MRD.
Concluding remarks
As a single marker, Fat1 cadherin has not been previously highlighted within the genes identified as being differentially expressed in leukemias, although it comprises part of a risk cluster designated by Staal et al.Citation19 Inherent in the global approach to marker discovery are risks where biologically significant genes can be inadvertently lost to fixed selection criteria. The original report by Hogan et al.Citation10 analyzed as part of this work did not determine Fat1 to be over- or under-expressed, but did find that the Fat1 promoter was hyper-methylated at relapse in 28% of cases. More recently, Sandoval et al.Citation20 corroborated this analysis showing that Fat1 was differentially methylated in cases of B-ALL that displayed aberrant methylation patterns. The significance of this finding is currently unclear but does further support our notion that Fat1 could play an important role in the biology of ALL relapse.Citation9 Following our previous report on the prognostic value of Fat1 in pediatric B-ALL, our present work provides evidence through an independent clinical study which support the potential use of Fat1 as MRD marker together with the detailed experimental information which validate its detection to current standards of MRD quantification. Our findings therefore promote Fat1 to be considered in future studies as a new MRD marker: one that serves to cover a subset of currently undetectable patients or as a valuable addition within a panel of markers to provide better overall coverage of MRD detection in ALL.
Acknowledgements
This work was supported by grants from the National Health and Medical Research Council, Australia (455531), Hunter Medical Research Institute (HMRI-09-23) sponsored by Gallerie Fine Jewellery), the Hunter Children's Research Foundation, and the Leukemia Foundation Australia. AA is the recipient of the Arrow Bone Marrow Transplant Foundation Scholarship. RFT was awarded a Career Development Fellowship by the Cancer Institute NSW.
References
- Campana D. Minimal residual disease studies in acute leukemia. Am J Clin Pathol. 2004;122( Suppl):S47–57.
- Stow P, Key L, Chen X, Pan Q, Neale GA, Coustan-Smith E, et al. Clinical significance of low levels of minimal residual disease at the end of remission induction therapy in childhood acute lymphoblastic leukemia. Blood. 2010;115:4657–63.
- Campana D. Minimal residual disease in acute lymphoblastic leukemia. Hematology/the Education Program of the American Society of Hematology. American Society of Hematology. Educ Program. 2010;2010:7–12.
- Campana D. Role of minimal residual disease monitoring in adult and pediatric acute lymphoblastic leukemia. Hematol/Oncol Clin North Am. 2009;23:1083–98, vii.
- Bruggemann M, Schrauder A, Raff T, Pfeifer H, Dworzak M, Ottmann OG, et al. Standardized MRD quantification in European ALL trials: proceedings of the Second International Symposium on MRD assessment in Kiel, Germany, 18–20 September 2008. Leukemia. 2010;24:521–35.
- Germano G, del Giudice L, Palatron S, Giarin E, Cazzaniga G, Biondi A, et al. Clonality profile in relapsed precursor-B-ALL children by GeneScan and sequencing analyses. Consequences on minimal residual disease monitoring. Leukemia. 2003;17:1573–82.
- Guggemos A, Eckert C, Szczepanski T, Hanel C, Taube T, van der Velden VH, et al. Assessment of clonal stability of minimal residual disease targets between 1st and 2nd relapse of childhood precursor B-cell acute lymphoblastic leukemia. Haematologica. 2003;88:737–46.
- Coustan-Smith E, Song G, Clark C, Key L, Liu P, Mehrpooya M, et al. New markers for minimal residual disease detection in acute lymphoblastic leukemia. Blood. 2011;117:6267–76.
- de Bock CE, Ardjmand A, Molloy TJ, Bone SM, Johnstone D, Campbell DM, et al. The Fat1 cadherin is overexpressed and an independent prognostic factor for survival in paired diagnosis-relapse samples of precursor B-cell acute lymphoblastic leukemia. Leukemia. 2012;26:918–26.
- Hogan LE, Meyer JA, Yang J, Wang J, Wong N, Yang W, et al. Integrated genomic analysis of relapsed childhood acute lymphoblastic leukemia reveals therapeutic strategies. Blood. 2011;118:5218–26.
- Staal FJ, de Ridder D, Szczepanski T, Schonewille T, van der Linden EC, van Wering ER, et al. Genome-wide expression analysis of paired diagnosis-relapse samples in ALL indicates involvement of pathways related to DNA replication, cell cycle and DNA repair, independent of immune phenotype. Leukemia. 2010;24:491–9.
- Bhojwani D, Kang H, Moskowitz NP, Min DJ, Lee H, Potter JW, et al. Biologic pathways associated with relapse in childhood acute lymphoblastic leukemia: a Children's Oncology Group study. Blood. 2006;108:711–17.
- Berenson RJ, Bensinger WI, Hill RS, Andrews RG, Garcia-Lopez J, Kalamasz DF, et al. Engraftment after infusion of CD34+ marrow cells in patients with breast cancer or neuroblastoma. Blood. 1991;77:1717–22.
- Pfaffl MW. Quantification strategies in real time PCR. In: , Bustin SA, (ed.) A-Z of quantitative PCR. La Jolla, CA: International University Line; 2004. pp.87–112.
- Chen JS, Coustan-Smith E, Suzuki T, Neale GA, Mihara K, Pui CH, et al. Identification of novel markers for monitoring minimal residual disease in acute lymphoblastic leukemia. Blood. 2001;97:2115–20.
- Arai F, Hirao A, Ohmura M, Sato H, Matsuoka S, Takubo K, et al. Tie2/angiopoietin-1 signaling regulates hematopoietic stem cell quiescence in the bone marrow niche. Cell. 2004;118:149–61.
- Tohmiya Y, Koide Y, Fujimaki S, Harigae H, Funato T, Kaku M, et al. Stanniocalcin-1 as a novel marker to detect minimal residual disease of human leukemia. Tohoku J Exp Med. 2004;204:125–33.
- van der Velden VH, Cazzaniga G, Schrauder A, Hancock J, Bader P, Panzer-Grumayer ER, et al. Analysis of minimal residual disease by Ig/TCR gene rearrangements: guidelines for interpretation of real-time quantitative PCR data. Leukemia. 2007;21:604–11.
- Staal FJ, van der Burg M, Wessels LF, Barendregt BH, Baert MR, van den Burg CM, et al. DNA microarrays for comparison of gene expression profiles between diagnosis and relapse in precursor-B acute lymphoblastic leukemia: choice of technique and purification influence the identification of potential diagnostic markers. Leukemia. 2003;17:1324–32.
- Sandoval J, Heyn H, Mendez-Gonzalez J, Gomez A, Moran S, Baiget M, et al. Genome-wide DNA methylation profiling predicts relapse in childhood B-cell acute lymphoblastic leukaemia. Br J Haematol. 2013;160:406–9.