Abstract
In Tunisia, β-thalassemia is a common hereditary disease with a carrying rate of 2.21%. Up to now, detection of responsible mutations was made by laborious, expensive, and/or time consuming methods. The aim of this study is to develop and validate a specific assay for detection of the two most frequent mutations in Tunisian population, the IVS-I-110 (G → A) and Cd39 (C → T) mutations. In this study, we optimize high resolution melting analysis (HRMA) conditions for these mutations, using control DNAs. Then, we evaluate the strength of this methodology by screening a cohort of patients with β-thalassemia. All examined reference DNA samples were unambiguously distinguished from each other. For the blinded test, the results were completely compatible with direct sequencing, performed after the HRMA. As HRMA represents a highly sensitive and high-throughput gene scanning method, it can provide timely diagnosis at low cost for effective clinical management of β-thalassemia.
Introduction
β-Thalassemia is an endemic disease in many regions of the world, especially in the mediterranean region. In Tunisia, it is one of the most common hereditary diseases with a carrying rate of 2.21%.Citation1–Citation2 As a consequence of the reduction (b+-thalassemia) or absence (b0-thalassemia) of the β globin chain, an ineffective erythropoiesis, a bone marrow massive erythroid hyperplasia, and a hemolytic anemia can be observed.Citation3 The most common genetic lesion of β-thalassemia is point mutations. More than 200 mutations have been reported so far worldwide. Patients of each ethnic population carry their own specific types of mutations, consisting of a few very common ones and a variable number of rare ones.Citation4 In Tunisian population, 21 types of mutations have been identified. The most common mutations include a splice site mutation at intron 1 and a nonsense mutation at codon 39 of the beta-globin gene (HBB gene), named IVS-I-110 (G → A) and Cd39 (C → T), respectively (or c.93–21 G > A and c.118 C > T according to the HGMD nomenclature). These two mutations account for over 70% of cases of β-thalassemia.Citation1–Citation2
High-resolution melting analysis (HRMA) is a new gene scan tool that identifies sequences alterations without requiring post-polymerase chain reaction (PCR) treatment. HRMA can be used to detect single-base sequence variations. It generates DNA melt curve profiles that are both specific and sensitive enough to distinguish nucleic acid species based on small sequence differences, enabling mutation scanning.Citation5 The transition from double to a single strand in the presence of double-stranded DNA dye leads to signal modification. The melting profile is related to the sequence allowing discrimination between wild-type sequences and homozygote–heterozygote variants.Citation5 Recently, it has also been used in the detection of HBB gene Taiwanese mutations.Citation6 The aim of this study was to develop and validate a specific assay for rapid diagnosis of IVS-I-110 (G → A) and Cd39 (C → T) HBB mutations, the two most frequent mutations in Tunisian populations, which have not been tested by Shih et al.Citation6
Methods
Patients and DNA extraction
Genomic DNA was extracted from peripheral whole blood by standard phenol–chlorophorm procedures.Citation7 A total of 22 DNA samples were used in this study: 8 carrying IVS-I-110 or Cd39 mutations at homozygous or heterozygous state and 2 control samples free of HBB sequence variations previously identified by direct sequencing (); and 12 samples of patients with β-thalassemia (HRMA screening).
Table 1. HBB genotypes of the 10 control DNA samples used to set up the HRMA assay
To avoid a variable amplification that might lead to an increased number of false positives, genomic DNAs used for HRMA were extracted using the same method and, subsequently, adjusted to a concentration of 20 ng/μl.
PCR and HRM assays
In a first step, PCR primers were selected on basis of the Shih et al.'sCitation6 study (coded P5 and P9 in Shih's study). Then, we designed new reverse primers (BEX2R-A and BEX2R-B) to amplify a fragment of the exon 2 of HBB gene, which comprised the mutations IVS-I-110 and Cd39 (GenBank: NG_000007.3). Amplicon length was kept short for maximum genotype discrimination. Each primer was previously analyzed by BLAST (http://blast.ncbi.nlm.nih.gov/Blast.cgi) to select specific and efficient primers, and checked with wos-tatefold for the absence of possible secondary structure formation (http://dinamelt.bioinfo.rpi.edu/twos-tatefold.php). The primers synthesized were all of standard molecular biology quality ().
Table 2. PCR primers used in HRMA
PCR and HRM were done on a LightCycler® 480 Instrument (Roche Diagnostics, Mannheim, Germany) provided with the software LightCycler® 480 Gene Scanning Software Version 1.0 (Roche Diagnostics).
PCR reactions were performed in 20 µl final volume using LightCycler® 480 High-Resolution Melting Master (Roche Diagnostics) ×1 – contains Taq, nucleotides and the dye ResoLight – and 50 ng DNA. The MgCl2 were used between 1.5 and 3.5 mM, and the primer at 0.25 µM.
The PCR program requires SYBR Green I filter (533 nm). It consists of an initial denaturation–activation step at 95°C for 10 min, followed by a 45-cycle program of a denaturation step at 95°C for 15 s, an annealing step at 52°C for 15 s and an elongation step at 72°C for 15 s with single reading of the fluorescence. After 45 cycles of PCR, reaction products were denatured at 95°C and renatured at 40°C for 1 min each to allow heteroduplex formation, and then the high-resolution melt consisted of a continuous fluorescent reading from 60 to 90°C at 50 acquisitions per °C.
Because the specificity of the amplified PCR products is critical in HRM analysis, all PCR products were electrophoresed on an agarose gel to assess whether each primer set generated single PCR products of the expected size.
Gene scanning
The HRM curve analysis was performed using the LightCycler® 480 Gene Scanning Software (Roche). It normalizes the raw melting curve data by setting pre-melt (initial fluorescence) and post-melt (final fluorescence) signals of all samples to uniform values. This step equals to 100% the initial fluorescence and to 0% the fluorescence traces after DNA dissociation. Then, the normalized curves are shifted along the temperature axis to the point where the entire double-stranded DNA in each sample is completely denatured. Finally, a difference plot was generated: the shifted, normalized curves are subtracted from a reference curve (wild-type sample) to get a clearer display of the differences in melting curve shape. Therefore, the difference plot helps clustering the samples into groups of similar melting curve shape.
Direct DNA Sequencing
To confirm HRM analysis results, sequencing was performed for the 12 samples of patients with β-thalassemia. After HRM analysis, samples were purified with 5 U exonucleaseI (20 U/μl), and 0.5 U shrimp alkaline phosphatase (1 U/μl) in a 10-μl final volume. The purified products were sequenced on an ABI prism 3130 DNA Genetic Analyzer (Applied Biosystems, Foster City, CA, USA) in accordance with the manufacturer's recommendations.
DNA sequences were then compared to the reference sequence from the NCBI Entrez Nucleotide database.
Results
Optimization of HRM conditions
In a first step, PCR and HRM establishment and optimization were performed using a cohort of 10 control DNAs which were previously directly sequenced on both strands in order to determine their IVS-I-110 and Cd39 mutational states.
Initially, we used the primer set and the same PCR-HRMA conditions described in Shih et al.'sCitation6 study. Surprisingly, we are unable to differentiate the different genotypes. Despite the use of different amplification protocols (modifications of primer concentrations, MgCl2 concentrations, DNA quantity) and different HRM conditions (modifications of melting temperature, acquisitions/°C), the results were not satisfying. Precisely, amplification results present abnormal PCR characteristics such as high Ct values or presence of extra products in agarose gel test, reducing amplicon quality for subsequent HRM analysis.
As no optimized PCR/HRM conditions could be defined, and because the ideal amplicon length is less than 250 bp for HRM analysis,Citation8 we designed two new primer sets to cover IVS-I-110 (G > A) and Cd39 (C > T) mutations. All new designed primer sets (P5/BEX2R-A and P5/BEX2R-B) created smaller amplicons (144 and 247 bp respectively), which maximize the potential for variant detection by HRM. Firstly, HRMA was optimized using a small cohort of three control DNAs with a titration of MgCl2, in order to determine the optimal MgCl2 concentration for the amplification. Melting curve shows one melting pic for the P5/BEX2R-A primer set, and two for the P5/BEX2R-B primer set. Moreover, for the first primer set, 3 mM of MgCl2 shows the best results (low Ct value and good amplification).
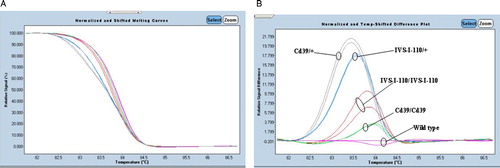
In order to examine the discrimination ability, we applied these optimized PCR conditions (P5/BEX2R-A primers and 3 mM MgCl2), in HRM analysis on wild-type DNAs but also on DNAs containing IVS-I-110 (G > A) and Cd39 (C > T) mutations in homozygous and heterozygous states. shows that we were able to differentiate the two mutations from the melting curve by using these new primer set. Indeed, difference plot data compared the mutation and normal samples, but also, between the samples that carry the same mutation at homozygous and heterozygous states. The sensitivity of mutation detection was 100% for all samples.
Figure 1. Optimization of HRMA. (A) High-resolution melting curves and (B) difference plots with redesigned new primer set (P5/BEX2R-A). In the temperature-shifted difference plots, a wild-type control was used to normalize melting profiles of the other samples against this predefined horizontal baseline (violet curve). HRM can easily distinguish the two frequent Tunisian HBB mutations and heterozygous genotype from homozygous genotypes for each mutation.
Validation
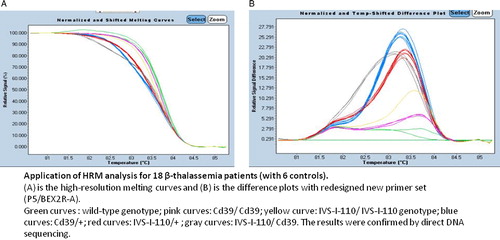
In a second step, and to validate our optimized experimental procedures, we performed a blinded study with DNA from 30 patients with β-thalassemia. All the positive controls and the negative controls were also added in the same run. Melting curves generated from these amplicons allowed an identification of all HBB genetic variants thanks to the LightCycler® 480 Gene Scanning Software (Roche). Comparing the normalized melting curve and the temp-shifted difference plot of each amplicon with those generated from the reference samples, we were able to distinguish the unknown sample whether it is mutant or normal (, and see Appendix 1). Those results were confirmed by direct sequencing of PCR products (a part of sequencing results is shown in ). One sample, DNA S13, generated a melting curve completely different from the control ones (), suggesting that this sample presents a different genotype. Direct sequencing detected the two mutations, IVS-I-110 (G > A) and Cd39 (C > T), at heterozygous state each.
Figure 2. Application of HRM analysis for 12 patients with β-thalassemia. (A) High-resolution melting curves and (B) difference plots with redesigned new primer set (P5/BEX2R-A). Blue curves represent wild-type HRM profiles. The results were confirmed by direct DNA sequencing.
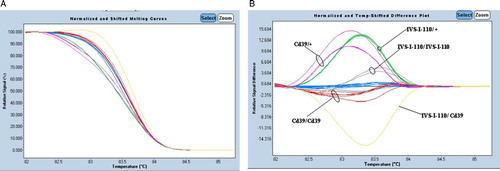
Table 3. List of 12 HBB genetic variants identified by HRM analysis and confirmed by direct sequencing
Discussion
β-Thalassemia is a genetic disease characterized by extremely decreased or completely absent production of the normal b-globin chain. That produce an excess of alpha-globin chains, which precipitate in red blood cells' precursors in the bone marrow, causing their premature death. The common β-thalassemia mutations in Tunisia are the mutations IVS-I-110 (G > A) and Cd39 (C > T). There are many techniques used to screen β-thalassemia mutations, like restriction fragment length polymorphism, amplification refracted mutation system, allele-specific oligonucletide, reverse dot-blot analysis, single-base extension, single-strand conformation polymorphism, denaturing gradient gel electrophoresis, denaturing high-performance liquid chromatography, and direct sequencing.Citation9 However, these methods are time consuming and costly.
Unlike these assays, HRM analysis offers a faster, cost-effective, and more convenient closed-tube genotyping approach. Besides, the closed-tube system reduces the contamination risk. HRMA thus well adapted for high-throughput mutation scanning on genes for which large cohorts of patients has to be investigated. Many applications of HRM analysis have been described.Citation5 Nevertheless, the main application of HRM analysis is gene scanning which has been applied to many genetic disorders these recent years.Citation8
Our aim was to develop an optimized protocol for scanning the two prevalent mutations causing β-thalassemia in Tunisia. Similar study was previously reported for HBB gene in Taiwanese patients, but this study did not test the IVS-I-110 (G > A) and Cd39 (C > T) mutations.Citation6 This could explain that the described optimization could not detect the Tunisian mutations. New primer set was designed, and PCR/HRM conditions were established on 10 control DNAs. By this approach, we demonstrate the sensitivity of HRMA by correctly identifying the two mutations in homozygous and heterozygous states. Optimized conditions were subsequently applied on a cohort of 12 new cases with β-thalassemia. Identification of a new genotype (combination of IVS-I-110 (G > A) and Cd39 (C > T) mutations) in the absence of reference positive controls during our blinded HRMA assay suggests that, even if not totally validated for all sequence variations, HRMA could be used as an alternative for HBB screening.
Sensitivity and specificity of mutation detection by HRM analysis could be affected by the presence of unexpected SNP which interferes in the mutation of interest. According to NCBI's dbSNP, the polymorphisms between the primers are very rare and have a maximum frequency of 0.1%. Although this low frequency, and in order to limit the probability of such event, we have designed amplicons that are as short as possible and 100 amplicons from Tunisian controls have been sequenced and analyzed. None showed polymorphism. Good amplicon design is essential to obtain robust and reproducible HRM assays, which could be affected by the length of the amplicon but also by the presence of many melting domains within an amplicon. With increasing product length, the differences between the wild type and heterozygote curves becomes smaller and hence more difficult to differentiate.Citation10 Complicated melting curve with more than one melting domain will preclude proper analysis.Citation11 Variable concentrations of nucleic acids or salts represent also a limitation of HRMA.Citation12 It is therefore recommended to use the same extraction procedure for DNA samples. Furthermore, because scanning accuracy depends on high-quality amplicons, PCR optimization plays a crucial role in successful HRM analysis. A variable amplification or presence of primer dimers or non-specific products might alter the melt curve characteristics leading to an increased number of false positives.Citation11 For the above conditions, DNA sequencing should be used to confirm whether the mutations truly exist or not and to recheck the samples without mutations detected by HRM. Therefore, HRM analysis will not replace DNA sequencing.
Conclusion
We showed in this study the feasibility and the efficiency of analyzing the HBB gene region of the two most frequent Tunisian mutations by HRMA. We demonstrated that the sensitivity and the specificity of the technique reach 100%.
HRM analysis is clearly faster, less laborious and represents a high-capacity low-cost pre-screening technology prior to sequencing.Citation13 This fulfills all the conditions required for the systematic detection of IVS-I-110 (G > A) and Cd39 (C > T) mutations in clinical molecular diagnosis of β-thalassemia in Tunisia.
Acknowledgements
Houyem Ouragini and Faten Haddad contributed equally to this article. We thank Dr Radhouane Aniba, for reading the manuscript and for his helpful comments.
References
- Chouk I, Daoud BB, Mellouli F, Bejaoui M, Gérard N, Dellagi K, et al. Contribution to the description of the beta-thalassemia spectrum in Tunisia and the origin of mutation diversity. Hemoglobin 2004;28:189–95.
- Fattoum S. Evolution of hemoglobinopathy prevention in Africa: results, problems and prospect. Mediterr J Hematol Infect Dis. 2009;1:1–9.
- Lo L, Singer ST. Thalassemia: current approach to an old disease. Pediatr Clin North Am. 2002;49:1165–91.
- Cao A, Galanello R. Beta-thalassemia. Genet Med. 2010;12:61–76.
- Erali M, Wittwer CT. High resolution melting analysis for gene scanning. Methods 2010;50:250–61.
- Shih HC, Er TK, Chang TJ, Chang YS, Liu TC, Chang JG. Rapid identification of HBB gene mutations by high-resolution melting analysis. Clin Biochem. 2009;42:1667–76.
- Sambrook J, Fritsh EF, Maniatis T. Molecular cloning: a laboratory manual. Cold spring Harbor: Cold Spring Laboratory Press; 1989.
- Er TK, Chang JG. High-resolution melting: applications in genetic disorders. Clin Chim Acta. 2012;414C:197–201.
- Patrinos GP, Kollia P, Papadakis MN. Molecular diagnosis of inherited disorders: lessons from hemoglobinopathies. Hum Mutat. 2005;26:399–412.
- Reed GH, Wittwer CT. Sensitivity and specificity of single-nucleotide polymorphism scanning by high-resolution melting analysis. Clin Chem. 2001;50:1748–54.
- Lin CW, Er TK, Tsai FJ, Liu TC, Shin PY, Chang JG. Development of a high-resolution melting method for the screening of Wilson disease-related ATP7B gene mutations. Clin Chim Acta. 2010;411:1223–31.
- Montgomery JL, Sanford LN, Wittwer CT. High-resolution DNAmelting analysis in clinical research and diagnostics. Expert Rev Mo. Diagn. 2010;10:219–40.
- Wittwer CT, Reed GH, Gundry CN, Vandersteen JG, Pryor RJ. High-resolution genotyping by amplicon melting analysis using LCGreen. Clin Chem. 2003;49:853–60.
Appendix 1