
Abstract
Background/Objective
Bone marrow stromal cells (BMSCs) can support multiple myeloma (MM) disease progression and resistance to chemotherapy. The proliferation of MM cells may be suppressed by modifying the hematopoietic microenvironment (HME). We have previously isolated human umbilical cord blood-derived stromal cells (hUCBDSCs) and observed that hUCBDSCs suppressed proliferation and induced apoptosis in KM3 cells. To examine the mechanism by which hUCBDSCs drive the inhibition of MM, KM3 cells were co-cultured with hUCBDSCs.
Methods
Interleukin (IL)-6 and soluble IL-6 receptor (sIL-6R) expression levels were measured by enzyme-linked immunosorbent assay. The expression levels of membrane IL-6 receptor (mIL-6R), intercellular cell adhesion molecule-1 (ICAM-1), B-cell lymphoma/leukemia-2 (Bcl-2), and Bcl-XL as well as the location of nuclear factor κB (NF-κB) were assessed by laser confocal microscopy. The expression profiles of mIL-6R and ICAM-1 were also more precisely examined by flow cytometry, and Bcl-2, Bcl-XL and inhibitor kappa B expression levels were analyzed by western blot. The mRNA expression levels of IL-6R, ICAM-1, Bcl-2, and Bcl-XL were assessed by real-time polymerase chain reaction. NF-κB DNA-binding activity was examined by electrophoretic mobility shift assay.
Results
The protein expression levels of both sIL-6R and mIL-6R were reduced in culture conditions when KM3 cells were co-cultured with hUCBDSCs; moreover, the mRNA expression levels of IL-6R were also reduced. Nuclear translocation of the NF-κB p65 subunit was inhibited in KM3 cells by co-culture with hUCBDSCs. Moreover, hUCBDSCs inhibited NF-κB DNA-binding activity, thereby resulting in the downregulation of NF-κB-regulated proteins.
Conclusion
hUCBDSCs can suppress proliferation and induce apoptosis in KM3 cells by both downregulating IL-6R expression and inhibiting NF-κB activity.
Introduction
The hematopoietic microenvironment (HME) is the site of origin, proliferation, differentiation, and development of hematopoietic stem cells (HSCs).Citation1 Bone marrow stromal cells (BMSCs) are an important component of the HME, as they not only provide both the structural and physiological support for the self-renewal, proliferation, differentiation, and homing of HSCs,Citation2 but are also closely associated with the occurrence, progress, and prognosis of hematologic malignancies.Citation3,Citation4
Multiple myeloma (MM) is a fatal neoplastic plasma cell disorder that develops within the bone marrow microenvironment.Citation5 The components of the microenvironment such as BMSCs support MM disease progression and resistance to chemotherapy.Citation6–Citation8 Both the direct adhesive interactions between BMSCs and myeloma cells as well as the BMSC-mediated secretion of cytokines, chemokines, growth factors, and other components contribute to the symbiotic cycle that maintains a myeloma-promoting microenvironment and allows for tumor cell survival.Citation9–Citation11 For example, BMSCs promote MM cells survival and proliferation by producing high levels of interleukin (IL)-6, an essential MM cells growth factor.Citation12 The adhesive interactions between MM cells and marrow stromal cells activate multiple signaling pathways in myeloma cells including the nuclear factor κB (NF-κB), p38 mitogen-activated protein kinase (MAPK), and Jun N-terminal kinase pathways, which play a pivotal role in the pathogenesis of MM.Citation13,Citation14 Because the HME plays a crucial role in MM pathogenesis and MM remains an incurable disease, therapies targeting the HME and cytokines network would be key.Citation15 The proliferation of myeloma cells may be suppressed by modifying and reconstructing the HME.
We have previously isolated a novel population of adherent fibroblast-like cells called human umbilical cord blood-derived stromal cells (hUCBDSCs) from human umbilical cord blood CD34+ cells and confirmed that hUCBDSCs can support the growth of hematopoietic stem and progenitor cells.Citation16–Citation18 Additionally, we have confirmed that the hUCBDSC-simulated HME significantly suppressed proliferation and promoted apoptosis in Jurkat cells compared with the HME simulated by normal BMSCs.Citation19 Moreover, we have confirmed that hUCBDSCs suppress acute graft-versus-host disease (aGVHD) development by inhibiting the proliferation of CD3 T lymphocytes.Citation20 MM is a B-cell malignancy and its pathogenesis relies on the HME, whether hUCBDSCs affect the development of MM or not. We have established in vitro models of KM3 cells and an hUCBDSC-simulated HME and confirmed that hUCBDSCs suppress the proliferation and induce apoptosis in KM3 cells (an MM cell line) and showed that KM3 cells underwent S phase cell cycle arrest when co-cultured with hUCBDSCsCitation21 when compared with multiple myeloma bone marrow stromal cells (MM-BMSCs).
The aim of the current study was to further examine the differences between hUCBDSCs and MM-BMSCs as well as to clarify the mechanism by which hUCBDSCs suppress proliferation and induce apoptosis in KM3 cells.
Materials and methods
Cell lines and stromal cells
Human umbilical cord blood (hUCB) was collected from 25 normal full-term deliveries at Xinqiao and Xinan Hospital, Chongqing, China. The volume of blood collected ranged from 70 to 120 ml. Bone marrow was isolated from 36 patients who were diagnosed with MM according to WHO criteria. Informed patient consent was obtained in all cases. This study was approved by the local ethical committee. The KM3 cell line was kindly provided by Dr Hou Jian of Changzheng Hospital, Shanghai, China.
All hUCB samples were separated 6 hours after collection. Cell culture procedures were performed according to our previous report.Citation20 Once the cell density reached at least 80% confluence, the hUCBDSCs were sub-cultured under the same conditions. hUCBDSCs at P1 or P2 were used for experiments.
Bone marrow was isolated from patients by bone marrow aspiration. Cell culture procedures were performed according to our previous report.Citation16 BMSCs were detached using trypsin and were cultured once (103 cells/cm2) under the same conditions as described above. BMSCs at P1 or P2 were used for experiments.
KM3 cells were cultured in RPMI1640 medium supplemented with 10% fetal bovine serum. MM-BMSCs and hUCBDSCs were seeded separately in 12-well plates, and 1 × 10⁴ KM3 cells were plated when their density had risen above 80% confluence. After the cells were co-cultured 3 days, the KM3 cells and supernatant were collected for analysis.
Enzyme-linked immunosorbent assay
The IL-6 and soluble IL-6 receptor (sIL-6R) concentrations in cultured supernatants were measured using an Enzyme-linked immunosorbent assay (ELISA) Quantikine kit (R&D System, Minneapolis, MN, USA) according to the manufacturer's protocol. The supernatants were stored at −80°C immediately after collection and until 1 hour before analysis. The ELISA was read at a wavelength of 450 nm with a 570-nm reference filter.
Laser confocal microscopy
KM3 cells from each of the three groups were plated on glass slides by centrifugation using a cytospin (Thermo Electron Corp, Waltham, MA, USA) and fixed in paraformaldehyde for 20 minutes. After a brief washing in phosphate-buffered saline (PBS), slides were blocked with goat serum albumin for 15 minutes and then incubated with mouse monoclonal antihuman membrane IL-6 receptor (mIL-6R), intercellular cell adhesion molecule-1 (ICAM-1), B-cell lymphoma/leukemia-2 (Bcl-2), or Bcl-XL antibody (dilution 1:50, Santa Cruz Biotechnology, Dallas, TX, USA). After overnight incubation at 4°C, the slides were washed and then incubated with either tetraethyl rhodamine isothiocyanate-labeled anti-mouse immunoglobulin goat antibody or fluorescein isothiocyanate-labeled anti-mouse immunoglobulin goat antibody (dilution 1:100, eBioscience, San Diego, CA, USA) for 1 hour at 37°C. Next, the slides were washed and incubated with 4,6-diamidino-2-phenylindole (DAPI, Molecolar Probes, Eugene, OR, USA) for 10 minutes at 37°C. Stained slides were then mounted with glycerol and analyzed using laser confocal microscopy. The method used for p65-NF-κB analysis (mouse monoclonal antihuman p65-NF-κB antibody, Santa Cruz Biotechnology) was similar except for an incubation step with 1% Triton X-100 PBS for 10 minutes before blocking with goat serum albumin.
Flow cytometer
KM3 cells from each of the three groups were collected and resuspended in PBS at a concentration of 1 × 10⁶ cells/ml. Cells were then incubated with phycoerythrin (PE)-labeled mouse anti-human mIL-6 and an ICAM-1 monoclonal antibody (eBioscience) for 10 minutes at 4°C. PE mouse IgG1 isotype (eBioscience) was used as a control. Levels of mIL-6 and ICAM-1 in KM3 cells were analyzed by flow cytometry.
Western blot
KM3 cells from each of the three groups were washed and resuspended in ice-cold PBS at a concentration of 1 × 10⁶ cells/ml. KM3 cells were then incubated in ice-cold RIPA buffer. After a 20-minute incubation period, the cell suspensions were centrifuged and the supernatant was collected. The supernatant protein content was measured by Bradford assay. After thawing and boiling the protein samples in Laemmli buffer for 5 minutes, 50 mg protein extracts were separated by sodium dodecylsulfate-polyacrylamide gel electrophoresis with 10% polyacrylamide gels and were subsequently transferred onto nitrocellulose membranes. After blocking the membranes with 5% non-fat milk, the membranes were incubated overnight with Bcl-2, Bcl-XL, or inhibitor kappa B (IκB) antibody (dilution 1:200, Santa Cruz Biotechnology). After washing the membranes, they were incubated with horseradish peroxidase-conjugated secondary antibodies (Santa Cruz Biotechnology) at room temperature for 1 hour. Blots were then developed with enhanced chemiluminescence solution. β-Actin was used as a control.
Real-time polymerase chain reaction
Total ribonucleic acid (RNA) was isolated from KM3 cells from each of the three groups using Tripure RNA extraction reagent (Boehringer, Mannhem, Germany) according to the manufacturer's instructions. Reverse transcription polymerase chain reaction RT-PCR assays were performed using 1 µg of RNA (A260/280 ratio 1.8–2.0). The transcribed complementary deoxyribonucleic acid (cDNA) was amplified using IL-6R, ICAM-1, Bcl-2 and Bcl-XL primers. The primer sequences utilized are as follows: IL-6R forward, 5′-CCCATCCCTGACGACAAA-3′, reverse, 5′-CTACTGGCGACGCACAT-3′; ICAM-1 forward, 5′-GTCTGCTGGGAATTTTCTGG-3′, reverse, 5′-AGCTTCTCCTGCTCTGCAAC-3′; Bcl-2 forward, 5′-CTGGTGGGAGCTTG CATCAC-3′, reverse, 5′-ACAGCCTGCAGCTTTGTTTC-3′; Bcl-XL forward, 5’-GTAAACTGGGGTCGCATTGT-3′; and reverse, 5′-TGCTGCATTGTTCCCATAGA-3′. GAPDH served as an internal standard and control for reverse transcription efficiency. The GAPDH primer sequences are as follows: GAPDH forward, 5′-AGCCACATCGCTCAGACAC-3′, reverse, 5′-GCCCAATACGACCAAATCC-3′. All PCR primers were designed using Premier Primer 5.0 software (Premier Biosoft, Palo Alto, CA, USA), and BLAST searches were performed for each primer to avoid sequence homology with other genes. cDNA was analyzed by real-time PCR (ABI 7500 Sequence Detector, Applied Biosystems, Life Technologies, Darmstadt, Germany) using SYBR Green PCR reagents (TaKaRa, Tokyo, Japan). Reactions were incubated at 95°C for 10 seconds, and then 40 cycles at 95°C for 5 seconds followed by 60°C for 34 seconds. Experiments were performed in duplicate for both the target and the endogenous genes. The relative quantification of target gene expression was calculated using the comparative threshold cycle (Ct) method. The value of target normalized to the endogenous control (GAPDH) and relative to an experiment-specific calibrator (control cells) was expressed as 2−ΔΔCt (fold), where ΔCt = Ct of the target −Ct of GAPDH, and ΔΔCt = ΔCt of samples for target −ΔCt of the calibrator for the target. Results from monocultures (control cells) were normalized by setting the corresponding value to 1.
Electrophoretic mobility shift assay for NF-κB
KM3 cells from each of the three groups were harvested and nuclear extracts were prepared using a nuclear extract kit (Pierce Biotechnology, Inc., Rockford, IL, USA). NF-κB DNA binding activity was then examined by electrophoretic mobility shift assay (EMSA). The double-stranded oligonucleotide containing the NF-κB binding site with Biotin end-labeled: 5′-TCAACTCCCCTGAAAGGGTCCG-Biotin-3′ was used as a probe.
The binding reactions contained 10 µg of nuclear extract protein, buffer (1× binding buffer, 5 mM MgCl2, 1 mM dithiothreitol, 0.05% Nonidet P-40, and 2.5% glycerol), 5 ng poly(dI-dC), and 20 fM of biotin-labeled DNA. The reactions were incubated at 23°C for 20 minutes. The competition reactions were performed by adding 200-fold excess unlabeled double-stranded oligonucleotide to the reaction mixture. The reactions were electrophoresed on a 5% Tris-borate-ethylene diamine tetraacetic acid (EDTA) gel at 150 V for 1 hours in a 100 mM Tris-borate-EDTA buffer. The reactions were then transferred to a nylon membrane. The biotin-labeled DNA was assessed using the LightShift Chemiluminescent EMSA kit (Pierce Biotechnology, Inc.).
Statistical analysis
All experiments were repeated at least three times. The results are expressed as mean ± SE. Statistical evaluation was performed using the Student's t-test with SPSS software (version 10.0, SPSS Inc., Chicago, IL, USA). A significance level of P < 0.05 was employed.
Results
Involvement of the IL-6 pathway in the proliferation of KM3 cells co-cultured with hUCBDSCs
hUCBDSCs secret IL-6
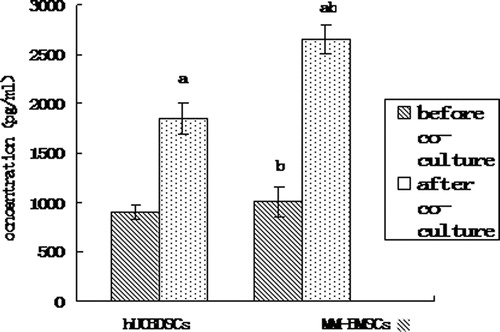
We analyzed the IL-6 expression levels in culture solution by ELISA. Similar to BMSCs results, hUCBDSCs secreted IL-6, albeit at lower levels than that of MM-BMSCs (P < 0.05) (). The results also showed that KM3 cells secreted low levels of IL-6 (22.43 ± 1.65 pg/ml), compared with the hUCBDSC and MM-BMSC levels of IL-6 secretion (P < 0.01; ). After co-culture, the difference between the levels of IL-6 secreted by hUCBDSCs and MM-BMSCs was more significant (P < 0.01; ).
Figure 1. IL-6 concentrations in hUCBDSC/MM-BMSC culture solution as assessed by ELISA. (a) After co-culture vs. before co-culture (P < 0.01). (b) hUCBDSCs vs MM-BMSCs (P < 0.05). After sub-culture for 4 days, the cultured serum was collected, and IL-6 expression levels were examined by ELISA. hUCBDSCs displayed lower IL-6 concentrations than MM-BMSCs. Each experiment was performed three times. hUCBDSCs, human umbilical cord blood-derived stromal cells; MM-BMSCs, multiple myeloma bone marrow stromal cells.
hUCBDSCs inhibit the expression of IL-6R
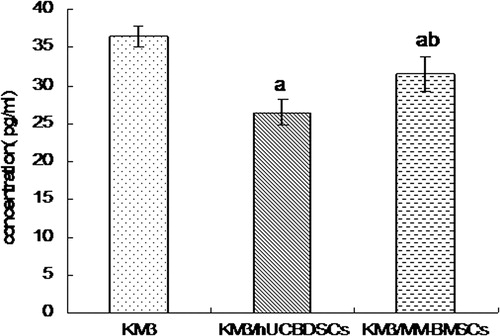
The IL-6R consists of two subunits: an α-chain (gp80, CD126) specific to the cytokine and a common β-chain (gp130, CD130) that is responsible for signal transduction. In addition, IL-6R consists of both soluble and membrane CD126. KM3 cell sIL-6R expression levels were analyzed using ELISA both before and after co-culture with hUCBDSCs and MM-BMSCs. After co-culture, the release of sIL-6R was found to be downregulated compared with levels observed before co-culture (P < 0.01); moreover, co-culture with hUCBDSCs caused KM3 cells to release sIL-6R at lower levels than those observed in MM-BMSC co-culture conditions (P < 0.01; ).
Figure 2. sIL-6R concentration levels in KM3 cell culture solution assessed by ELISA. (a) KM3/hUCBDSCs and KM3/MM-BMSCs vs KM3 (P < 0.01). (b) KM3/hUCBDSCs vs KM3/MM-BMSCs (P < 0.01). After sub-culture for 4 days, the culture medium was collected, and the expression levels of sIL-6R were examined by ELISA. The sIL-6R concentration was lowest after co-culture with hUCBDSCs. Each experiment was performed three times. sIL-6R: soluble IL-6 receptor; hUCBDSCs, human umbilical cord blood-derived stromal cells; MM-BMSCs, multiple myeloma bone marrow stromal cells.
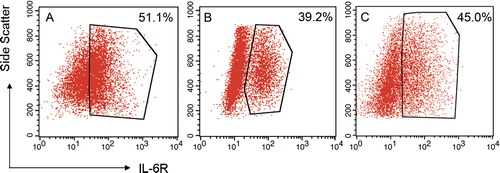
We also observed the expression of mIL-6R as displayed by the uniform red fluorescence on the cell surface of KM3 cells when analyzed by laser confocal microscopy but did not find a difference amongst the three groups (no data shown). We also assessed mIL-6R expression on KM3 cells using flow cytometry. The expression levels of mIL-6R on KM3 cells were markedly decreased after co-culture (P < 0.05); moreover, the expression level of mIL-6R in KM3 cells from KM3/hUCBDSCs co-culture conditions was the lowest expression level observed (P < 0.05; ).
Figure 3. Expression levels of IL-6R on the surface of KM3 cells as detected by flow cytometry. (A) KM3 group. (B) KM3/hUCBDSC co-culture group C: KM3/MM-BMSC co-culture group. After sub-cultured for 4 days, the KM3 cells from each of the three groups were collected, and the expression levels of mIL-6R were then examined by flow cytometry. The expression levels of mIL-6R for KM3 cells in the KM3/hUCBDSC group were lower than in the KM3/MM-BMSC group. Each experiment was performed three times. hUCBDSCs, human umbilical cord blood-derived stromal cells; MM-BMSCs, multiple myeloma bone marrow stromal cells; IL-6R, IL-6 receptor.
The RNA transcripts obtained from purified KM3 cells under different conditions were analyzed by real-time PCR. The IL-6R messenger RNA (mRNA) expression levels of KM3 cells in the KM3/hUCBDSC group and KM3/MM-BMSC group were only 31 ± 4% (P < 0.01) and 71% ± 16% (P < 0.01), respectively, compared with levels observed in the mono-culture group. Moreover, the IL-6R mRNA expression level of KM3 cells in the KM3/hUCBDSC group was lower than that observed in the KM3/MM-BMSC group (P < 0.05).
NF-κB activity in KM3 cells was suppressed by hUCBDSCs
hUCBDSCs prevent the nuclear translocation of the NF-κB p65 subunit to the in KM3 cells
When NF-κB becomes activated, the NF-κB p65 subunit, which contains the transactivation domain, is translocated to the nucleus. In the inactive state, the NF-κB p65 subunit is retained in the cytoplasm. We directly analyzed the localization of the NF-κB p65 subunit in KM3 cells using laser confocal fluorescence microscopy. Analysis revealed that the NF-κB p65 subunit exhibited an almost exclusively nuclear localization pattern in KM3 cells co-cultured with MM-BMSCs. However, the analysis revealed that NF-κB p65 localized to the nucleus in only some of the KM3 cells co-cultured with hUCBDSCs. These results confirmed that hUCBDSCs suppress the nuclear retention of the NF-κB p65 subunit. It also indicated that MM-BMSCs enhanced the translocation of the NF-κB p65 subunit to the nucleus in KM3 cells, while hUCBDSCs prevented nuclear translocation ().
Figure 4. Localization of the NF-κB p65 subunit in KM3 cells as assessed by laser confocal fluorescence microscopy. (A) KM3 group. (B) KM3/hUCBDSC co-culture group. (C) KM3/MM-BMSC co-culture group After sub-culture for 4 days, KM3 cells from each of the three groups were collected, and the localization of the NF-κB p65 subunit in KM3 cells was examined by laser confocal fluorescence microscopy. In KM3 cells co-cultured with MM-BMSCs the NF-κB p65 subunit was almost exclusively localized to the nucleus, whereas the NF-κB p65 subunit was localized to the nucleus in only some KM3 cells when co-cultured with hUCBDSCs. Each experiment was performed three times. hUCBDSCs, human umbilical cord blood-derived stromal cells; MM-BMSCs, multiple myeloma bone marrow stromal cells; NF-κB, nuclear factor κB.
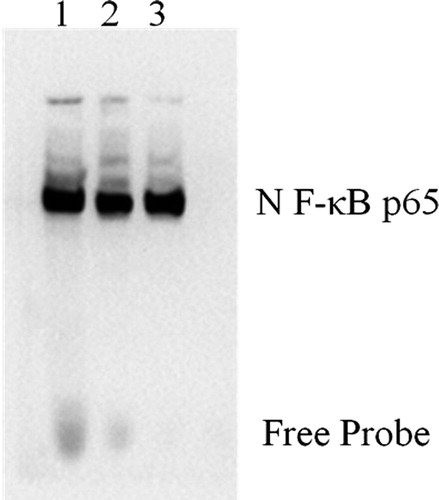
hUCBDSCs suppresses NF-κB activity in KM3 cells
The EMSA results indicated a decrease in NF-κB DNA-binding activity in the KM3 cells of the KM3/hUCBDSC group, whereas an increase in NF-κB DNA-binding activity was observed in KM3 cells from the KM3/MM-BMSC group (P < 0.05). These observations indicate that hUCBDSCs suppress NF-κB activity in KM3 cells ().
Figure 5. NF-κB activity in KM3 cells under various culture conditions as assessed by EMSA. (1) KM3/MM-BMSC co-culture group, (2) KM3/hUCBDSC co-culture group, (3) KM3 group. After sub-culture for 4 days, KM3 cells from the three groups were collected, and NF-κB activity in KM3 cells was assessed by EMSA. NF-κB DNA-binding activity in KM3 cells was decreased in the KM3/hUCBDSC group, while the level of NF-κB DNA-binding activity was elevated in the KM3/MM-BMSC group. Each experiment was performed three times. hUCBDSCs, human umbilical cord blood-derived stromal cells; MM-BMSCs, multiple myeloma bone marrow stromal cells; NF-κB, nuclear factor kappa B; EMSA, electrophoretic mobility shift assay.
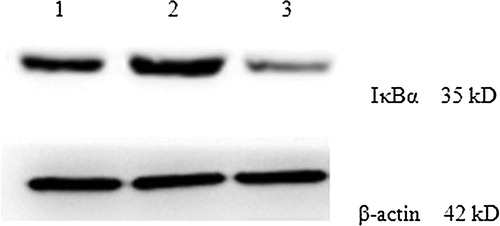
hUCBDSCs influence the increased expression of IκB in KM3 cells
Cytoplasmic extracts were prepared to assess the expression levels of IκB in KM3 cells under various conditions. The Western blot results showed that the IκB expression levels in KM3 cells from the KM3/hUCBDSC group were increased compared with the KM3/MM-BMSC group (P < 0.05; ).
Figure 6. IκB expression levels in KM3 cells under various culture conditions as assessed by western blot. (1) The KM3 group 2: The KM3/hUCBDSC co-culture group 3: The KM3/MM-BMSC co-culture group. After sub-culture for 4 days, KM3 cells from each of the three groups were collected, and the expression levels of IκB were examined by Western blot. The IκB expression levels in KM3 cells from the KM3/hUCBDSC group were increased compared with the KM3/MM-BMSC group. Each experiment was performed three times. hUCBDSCs, human umbilical cord blood-derived stromal cells; MM-BMSCs, multiple myeloma bone marrow stromal cells; IκB, inhibitor kappa B.
hUCBDSCs downregulate the expression of NF-κB-regulated genes
Because ICAM-1, Bcl-2, and Bcl-XL have all been shown to be regulated by NF-κB, we examined the effect of hUCBDSCs on the expression of these proteins by flow cytometry, western blot, laser confocal fluorescence microscopy, and real-time PCR.
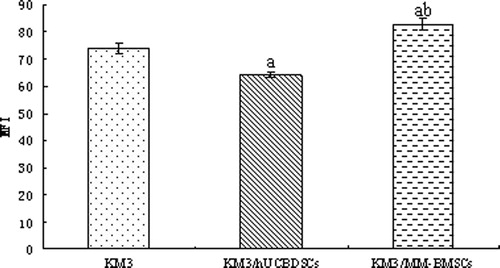
hUCBDSCs inhibit the expression of ICAM-1
We analyzed the expression levels of ICAM-1, as indicated by the uniform green fluorescence on the cell surface of KM3 cells, by laser confocal microscopy. The green fluorescence signal was lowest in the KM3/hUCBDSC co-culture group (). We then more precisely assessed the mean fluorescence intensity corresponding to ICAM-1 expression using flow cytometry. The mean fluorescence intensity of ICAM-1 on the cell surface of KM3 cells was lowest in the KM3/hUCBDSC co-culture group (P < 0.01; ). Although, nearly all KM3 cells expressed ICAM-1 among the three groups, the differences in the percentage of ICAM-1-positive cells of each group were not significant (P > 0.05).
Figure 7. Expression of ICAM-1 in KM3 cells was analyzed by laser confocal fluorescence microscopy. (A) The KM3 group. (B) The KM3/hUCBDSC co-culture group. (C) The KM3/MM-BMSC co-culture group. After sub-culture for 4 days, KM3 cells from each of the three groups were collected, and the expression levels of ICAM-1 were examined by laser confocal fluorescence microscopy. The MFI of ICAM-1 in KM3 cells from the KM3/hUCBDSC group was lower than in the KM3/MM-BMSC group. Each experiment was performed three times. hUCBDSCs, human umbilical cord blood-derived stromal cells; MM-BMSCs, multiple myeloma bone marrow stromal cells; ICAM-1, intercellular adhesion molecule-1; MFI, mean fluorescence intensity.
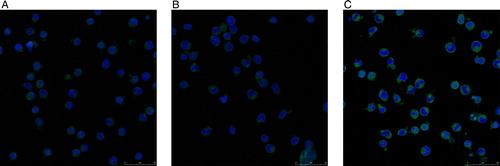
Figure 8. MFI of ICAM-1 in KM3 cells as assessed by flow cytometry. (a) KM3/hUCBDSCs or KM3/MM-BMSCs vs. KM3 (P < 0.01). (b) KM3/hUCBDSCs vs. KM3/MM-BMSCs (P < 0.01). After sub-culture for 4 days, KM3 cells from each of the three groups were collected, and the MFI of ICAM-1 was examined by flow cytometry. The MFI of ICAM-1 in KM3 cells from the KM3/hUCBDSC group was lower than that observed in the KM3/MM-BMSC group. Each experiment was performed three times. hUCBDSCs, human umbilical cord blood-derived stromal cells; MM-BMSCs, multiple myeloma bone marrow stromal cells; ICAM-1, intercellular adhesion molecule-1; MFI, mean fluorescence intensity.
The mRNA expression levels of ICAM-1 in KM3 cells varied significantly among the three groups. The mRNA expression levels of ICAM-1 in KM3 cells from the KM3/hUCBDSC group was only 47 ± 6% (P < 0.01), and the expression levels increased by 1.52 ± 0.27 fold in the KM3/MM-BMSCs group (P < 0.01) compared with that observed in monoculture group.
hUCBDSCs inhibit the expression of Bcl-2 and Bcl-XL
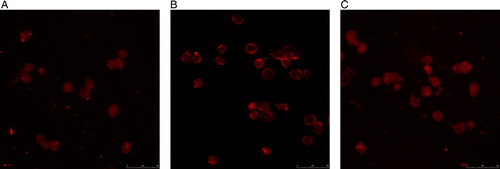
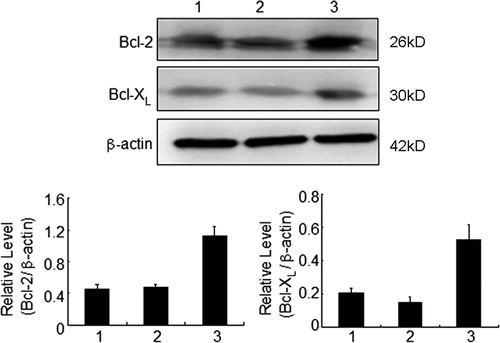
We analyzed the expression of Bcl-2 and Bcl-XL, as indicated by red fluorescence in the cytoplasm of KM3 cells, using laser confocal microscopy. The red fluorescence representing the expression levels of Bcl-2 and Bcl-XL were lowest in the KM3/hUCBDSC co-culture group ( and ). Moreover, the semi-quantitative expression level results showed that the expression of Bcl-2 and Bcl-XL in KM3 cells was lower in the KM3/hUCBDSC group than that observed in the KM3/MM-BMSC group, as assessed by western blot (P < 0.05) ().
Figure 9. Expression levels of Bcl-2 in KM3 cells as assessed by laser confocal fluorescence microscopy. (A) The KM3 group. (B) The KM3/hUCBDSC co-culture group. (C) The KM3/MM-BMSC co-culture group. After sub-culture for 4 days, KM3 cells from each of the three groups were collected, and the expression of Bcl-2 was examined by laser confocal fluorescence microscopy. The expression of Bcl-2 in KM3 cells from the KM3/hUCBDSC group was lower than that observed in the KM3/MM-BMSC group. Each experiment was performed three times. hUCBDSCs, human umbilical cord blood-derived stromal cells; MM-BMSCs, multiple myeloma bone marrow stromal cells.
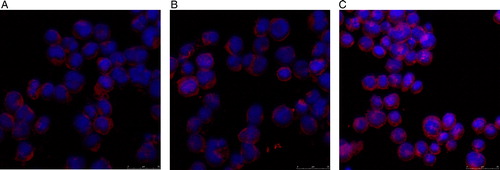
Figure 10. Expression of Bcl-XL in KM3 cells as assessed by laser confocal fluorescence microscopy. (A) The KM3 group. (B) The KM3/hUCBDSC co-culture group. (C) The KM3/MM-BMSC co-culture group. After sub-culture for 4 days, KM3 cells from each of the three groups were collected, and the expression of Bcl-XL was then examined by laser confocal fluorescence microscopy. The expression levels of Bcl-2 in KM3 cells from the KM3/hUCBDSC group were lower than that observed in the KM3/MM-BMSC group. Each experiment was performed three times. hUCBDSCs, human umbilical cord blood-derived stromal cells; MM-BMSCs, multiple myeloma bone marrow stromal cells.
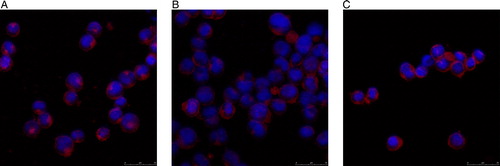
Figure 11. Expression levels of Bcl-2 and Bcl-XL in KM3 cells under various culture conditions as assessed by western blot. (1) The KM3 group, (2) The KM3/hUCBDSC co-culture group, (3) The KM3/MM-BMSC co-culture group. After sub-culture for 4 days, KM3 cells from each of the three groups were collected, and the expression levels of Bcl-2 and Bcl-XL were then examined by western blot. The expression levels of Bcl-2 and Bcl-XL in KM3 cells from the KM3/hUCBDSC group were lower than that observed in the KM3/MM-BMSC group. Each experiment was performed three times. hUCBDSCs, human umbilical cord blood-derived stromal cells; MM-BMSCs, multiple myeloma bone marrow stromal cells.
We further analyzed the mRNA expression levels of Bcl-2 and Bcl-XL in KM3 cells using real time PCR. The mRNA expression level of Bcl-2 in KM3 cells from the KM3/hUCBDSC group was only 45 ± 5% (P < 0.01), while the level was increased by 1.35 ± 0.07 fold in the KM3/MM-BMSC group (P < 0.05) compared to that observed in the monoculture group. In addition, the expression level of Bcl-XL mRNA in KM3 cells from the KM3/hUCBDSC group decreased by 50 ± 20% (P < 0.01), while the expression level increased by 1.52 ± 0.22 fold in the KM3/MM-BMSC group (P < 0.01) compared to that observed in the monoculture group.
Discussion
BMSCs play an important role in the development of MM by producing a variety of soluble factorsCitation22 and influencing cell–cell contact between myeloma cells and BMSCs. MM-BMSCs have been confirmed to support the growth of myeloma cells more effectively than normal BMSCs.Citation3,Citation6,Citation23 Feng et al.Citation3 have found that myeloma cells formed more colonies when grown on myeloma BMSCs than on control BMSCs. Moreover, myeloma cells in a mouse model grew at an increased rate when mice were inoculated with myeloma BMSCs compared with those inoculated with control BMSCs. The effect on the HME is the important characteristic of MM development; therefore, we have concentrated on targeting the HME as a means of treating MM.
Our previous study has revealed that hUCBDSCs could suppress proliferation and promote apoptosis and differentiation in Jurkat cells.Citation19 Furthermore, we confirmed that hUCBDSCs suppress aGVHD development by inhibiting the proliferation of CD3 T lymphocytes.Citation20 MM is a B-cell malignancy, which has a close relationship with the HME. In our previous study, we established in vitro models of KM3 cells and an hUCBDSC-simulated HME. We then confirmed that hUCBDSCs suppressed proliferation, induced apoptosis, and induced S phase cell cycle arrest in KM3 cells.Citation21 The aim of the present study was to elucidate the mechanism by which hUCBDSCs affect myeloma cells.
IL-6 is a major factor influencing proliferation and survival in myeloma cells via paracrine and autocrine systems.Citation24 IL-6 functions by binding to IL-6R and subsequently triggering downstream pathways; therefore, we analyzed both IL-6 and IL-6R activity. IL-6R consists of two polypeptide chains, a ligand-binding chain (IL-6R alpha) and a non-ligand-binding signal transducing chain (gp130). IL-6Rα exerts an agonist function and plays an important role in the proliferation of some myeloma cell lines.Citation24 Although the majority of myeloma cells do not secrete IL-6, a minority of IL-6-secreting cells have been identified.Citation12,Citation25 Although myeloma cells spontaneously produce IL-6 and express IL-6R, some studies have confirmed that most of the IL-6 detected is released by other cells, which suggests that BMSCs are the main source of IL-6.Citation12,Citation25,Citation26 Recent studies have indicated that the BMSCs of MM patients differ from those of healthy donors and that the BMSCs of MM patients produced more IL-6 than those of healthy controls.Citation12,Citation26,Citation27 Some authors have stressed that direct contact between the two types of cells was necessary for IL-6 production,Citation26 but others found that a significant increase in IL-6 production was caused by myeloma cell-mediated basic fibroblast growth factor (bFGF) expression, which bound with bFGF receptors on BMSCs and stimulated IL-6 production.Citation28 In our present study, first we confirmed that hUCBDSCs can secret IL-6, but the level of IL-6 production was significantly lower than that observed in MM-BMSCs. Although KM3 cells secreted small amounts of IL-6, KM3 cells could stimulate IL-6 production in hUCBDSCs and MM-BMSCs. After co-culture with KM3 cells, the differences in the levels of IL-6 secreted by hUCBDSCs and MM-BMSCs were more striking. hUCBDSCs secreted relatively high levels of IL-6 compared with KM3 cells; although the production level was significantly lower than that observed in MM-BMSCs. Therefore, these results indicate that IL-6 is not an important factor in the inhibition of myeloma by hUCBDSCs.
As IL-6 functions exclusively via binding with IL-6R, we also analyzed IL-6R expression. We found that both hUCBDSCs and MM-BMSCs influenced the downregulation of IL-6R expression in KM3 cells, and the effect induced by hUCBDSCs was more significant. As IL-6 affects signaling exclusively by binding with IL-6R,Citation22 the downregulation of IL-6R induced the suppression of growth in KM3 cells. In the hUCBDSCs-simulated HME, the expression of IL-6R in KM3 cells was the lowest among all groups analyzed; therefore, the proliferation of KM3 cells was at the lowest rate in these conditions. The results indicate that hUCBDSCs suppress the proliferation of KM3 cells via downregulation of IL-6R. The regulation of IL-6R expression in human myeloma cells is complex, and the mechanism is currently unknown. Some studies have showed that IL-6 strongly upregulates IL-6R expression in OPM-2 and XG-6 cells but downregulates the expression of its corresponding receptors in RPMI-8226 and XG-1 myeloma cell lines.Citation29–Citation31 In our present study, both hUCBDSCs and MM-BMSCs were shown to secrete high levels of IL-6; although, the expression of IL-6R in KM3 cells was suppressed when co-cultured with hUCBDSCs and MM-BMSCs. Our results indicate that hUCBDSCs and MM-BMSCs downregulate the expression of sIL-6R and mIL-6R in KM3 cells via IL-6. Direct interaction between KM3 cells, stromal cells and other cytokines may also participate in the downregulation of IL-6R. We plan to address this issue using a Transwell model in the future. In our previous study, we surprisingly found that during co-culture with MM-BMSCs, the proliferation of KM3 cells was suppressed. However, some studies have showed that MM-BMSCs promoted the growth of myeloma cells.Citation3,Citation6,Citation23 Moreover, KM3 cells co-cultured with hUCBDSCs underwent S phase cell cycle arrest, while KM3 cells co-cultured with MM-BMSCs arrested at the G0/G1 phases of the cell cycle.Citation21 This indicates that MM-BMSCs induced KM3 cell arrest at the G0/G1 cell cycle phase, resulting in drug resistance, while hUCBDSCs induced KM3 cell arrest at the cell cycle S phase, resulting in apoptosis and drug sensitiveness. Therefore, the suppression of growth of KM3 cells was not exclusively due to inhibition of IL-6R.
In addition to IL-6, many studies have focused on the important effect of NF-κB signaling in MM development. NF-κB activity in MM is dependent on the bone marrow milieu, and activation of NF-κB can promote proliferation and inhibit apoptosis in myeloma cells by upregulating NF-κB-regulated proteins.Citation6 When NF-κB is activated, the NF-κB p65 subunit, which contains the transactivation domain, is translocated to the nucleus. While, in the inactive state, the p65 subunit of NF-κB is retained in the cytoplasm. NF-κB activity in primary and established MM cells has been shown to increase in response to a number of factors found in the bone marrow microenvironment.Citation10,Citation11,Citation23,Citation25 For example, adhesion of myeloma cell lines to fibronectin results in increased NF-κB DNA-binding and correlates with the induction of NF-κB-regulated genes.Citation6,Citation11 Markovina et al.Citation8 have confirmed that when RPMI8226 cells were co-cultured with BMSCs isolated from MM patients, NF-κB activity was enhanced by severalfold, while BMSCs derived from non-MM patients did not significantly affect NF-κB activity in these cells. The observed difference in fold-induction in NF-κB activity between the MM and non-MM groups was statistically significant. The analyses demonstrate that BMSCs can activate NF-κB in primary MM cells, while those from normal bone marrow often fail to activate NF-κB. In contrast to other reports, Conticelloa et al.Citation32 have demonstrated that at least the p65 (RelA) member of the NF-κB family, which belongs to the canonical pathway, resides mainly in the cytoplasm (the inactive form) of plasma cells (PCs) from all newly diagnosed MM patients, the majority of relapsed patients and some MM cell lines. But Conticelloa et al.Citation32 did not exclude other members of the NF-κB family belonging to non-canonical pathway that may be present in the active form. We were interested in the potential functional differences and employed KM3 cells to assess the differential effects of hUCBDSCs and MM-BMSCs on NF-κB activation in myeloma cells. Laser confocal fluorescence microscopy results clearly demonstrated that hUCBDSCs prevented the translocation of the NF-κB p65 subunit to the nucleus in KM3 cells, while MM-BMSCs enhanced this effect. EMSA analysis showed a decrease in NF-κB DNA-binding activity in KM3 cells co-cultured with hUCBDSCs and an increase in NF-κB DNA-binding activity in cells co-cultured with MM-BMSCs. NF-κB is inactivated by its association with IκB family inhibitors; therefore, IκBα plays a crucial role in the regulation of NF-κB activation. In our study, western blot results showed that the expression of IκB in KM3 cells increased in co-culture conditions with hUCBDSCs compared with cells co-cultured with MM-BMSCs. These results indicate that hUCBDSCs suppress NF-κB activity in KM3 cells. Some studies have shown that NF-κB activated by cytokines and/or growth factors modulates the expression of adhesion molecules, cytokines, and anti-apoptotic proteins in MM cells.Citation6,Citation8,Citation11 Markovina et al.Citation8 have indicated that BMSC-induced NF-κB activity in MM cells was mediated by a soluble secreted protein factor that is greater than 3 kDa. In our current study, we did not observe this effect with hUCBDSCs. We then confirmed that NF-κB-regulated proteins in KM3 cells, such as ICAM-1, Bcl-2, and Bcl-XL, were downregulated by hUCBDSCs; although, the effect mediated by MM-BMSCs was the converse. Adhesive interactions between myeloma cells and BMSCs affect several key functions in the progression of MM, including genetic and epigenetic instability, proliferation, and cell adhesion-mediated drug resistance. Bcl-2 and Bcl-XL expression are linked to MM cell survival and resistance to chemotherapeutic agents. Therefore, hUCBDSCs suppress proliferation and induce apoptosis in KM3 cells via decreased expression of ICAM-1, Bcl-2, and Bcl-XL.
In conclusion, our previous studies have confirmed that hUCBDSCs suppressed proliferation and induced apoptosis in KM3 cells. Here, our results show that this effect may be due to the downregulation of IL-6R and the inhibition of NF-κB activity mediated by hUCBDSCs. The mechanism by which hUCBDSCs affect myeloma cells in vitro and in vivo requires further in-depth research.
Acknowledgements
This work was supported by the Chinese National Natural Science Foundation (No. 81170467), the Natural Science Foundation Project of CQ CSTC(cstc2012jjA10049), State Key Laboratory of trauma and burn combined wound open topic (No. SKLKF201104), Research Foundation of Janssen Research Council China (JRCC2011Tumor01), and the Special Funds for Major State Basic Research Program of China (973 Program) (2012CB518103). We thank Mr. Jian Hou for donating the KM3 cells.
References
- Gao L, Chen X, Zhang X, Liu Y, Kong P, Peng X, et al. Human umbilical cord blood-derived stromal cell, a new resource of feeder layer to expand human umbilical cord blood CD34+ cells in vitro. Blood Cell Mol Dis 2006;36:322–8.
- Méndez-Ferrer S, Frenette PS. Hematopoietic stem cell trafficking: regulated adhesion and attraction to bone marrow microenvironment. Ann N Y Acad Sci. 2007;11(16):392–413.
- Feng Y, Wen J, Mike P, Choi DS, Eshoa C, Shi ZZ, et al. Bone marrow stromal cells from myeloma patients support the growth of myeloma stem cells. Stem Cells Dev. 2010;19(9):1289–96.
- Basak GW, Srivastava AS, Malhotra R, Carrier E. Multiple myeloma bone marrow niche. Curr Pharm Biotechnol. 2009;10(3):345–6.
- Fowler JA, Edwardsa CM, Croucherb PI. Tumor–host cell interactions in the bone disease of myeloma. Bone 2011;48:121–8.
- Hiruma Y, Honjo T, Jelinek DF, Windle JJ, Shin J, Roodman GD, et al. Increased signaling through p62 in the marrow microenvironment increases myeloma cell growth and osteoclast formation. Blood 2009;113(20):4894–902.
- Zdzisińska B, Bojarska-Junak A, Walter-Croneck A, Kandefer-Szerszeń M. Dysregulation of the receptor activator of NF-kappaB ligand and osteoprotegerin production influence the apoptosis of multiple myeloma patients’ bone marrow stromal cells co-cultured with myeloma cells. Arch Immunol Ther Exp. (Warsz) 2010;58(2):153–63.
- Markovina S, Callander NS, O'Connor SL, Xu G, Shi Y, Leith CP, et al. Bone marrow stromal cells from multiple myeloma patients uniquely induce bortezomib resistant NF-κB activity in myeloma cells. Mol Cancer. 2010;9:176–89.
- Görgün G, Calabrese E, Soydan E, Hideshima T, Perrone G, Bandi M, et al. Immunomodulatory effects of lenalidomide and pomalidomide on interaction of tumor and bone marrow accessory cells in multiple myeloma. Blood 2010;116(17):3227–37.
- Zdzisiñska B, Roliñski J, Piersiak T, Kandefer-Szerszeñ M. A comparison of cytokine production in 2-dimensional and 3-dimensional cultures of bone marrow stromal cells of muliple myeloma patients in response to RPMI8226 myeloma cells. Folia Histochem Cytobiol. 2009;47(1):69–74.
- Hideshima T, Chauhan D, Kiziltepe T, Ikeda H, Okawa Y, Podar K, et al. Biologic sequelae of IκB kinase (IKK) inhibition in multiple myeloma: therapeutic implications. Blood 2009;113(21):5228–36.
- Mahtouk K, Moreaux J, Hose D, Rème T, Meißner T, Jourdan M, et al. Growth factors in multiple myeloma: a comprehensive analysis of their expression in tumor cells and bone marrow environment using Affymetrix microarrays. BMC Cancer 2010;10:198.
- Hideshima T, Podar K, Chauhan D, Anderson KC. Cytokines and signal transduction. Best Pract Res Clin Haematol. 2005;18:509–24.
- Azab AK, Runnels JM, Pitsillides C, Moreau A-S, Azab F, Leleu X, et al. CXCR4 inhibitor AMD3100 disrupts the interaction of multiple myeloma cells with the bone marrow microenvironment and enhances their sensitivity to therapy. Blood 2009;113(18):4341–51.
- Monika E, Roland M. 160 years of multiple myeloma: progress and challenges. Eur J Cancer 2006;42:1507–9.
- Gao L, Chen X-H, Feng Y-M, Zhang X, Yu S-C, Gao L, et al. Human umbilical cord blood-derived stromal cells Multifaceted regulators of megakaryocytopoiesis. Cell Cycle 2010;9(7):1–12.
- Feng Y, Chen X, Gao L. Hypothesis: human umbilical cord blood-derived stromal cells promote megakaryocytopoiesis through the influence of SDF-1 and PECAM-1. Cell Biochem Biophys. 2010;58:25–30.
- Liu Y, Yi L, Zhang X, Gao L, Zhang C, Feng Y-M, et al. Cotransplantation of human umbilical cord blood-derived stromal cells enhances hematopoietic reconstitution and engraftment in irradiated BABL/c mice. Cancer Biol Ther. 2010;11(1):1–11.
- Liang X, Hao L, Chen X, Zhang X, Kong P, Peng X, et al. Effects of bone marrow stromal cells and umbilical cord blood-derived stromal cells on daunorubicin-resistant residual Jurkat cells. Transplant Proc. 2010;42:3767–72.
- Zhang C, Chen X-H, Zhang X, Gao L, Kong PY, Peng XG, et al. Human umbilical cord blood-derived stromal cells, a new resource in the suppression of acute graft-versus-host disease in haploidentical stemcell transplantation in sublethally irradiated mice. J Biol Chem. 2011;286(15):13723–32.
- Gao L, Zhang X, Gao L, Chen XH. Effect of stromal cells derived from different origins on proliferation and apoptosis of KM3 cells. Acta Acad Med Militaris Tertiae 2009;31(10):879–82.
- Pellegrino A, Ria R, Di Pietro G, Cirulli T, Surico G, Pennisi A. Bone marrow endothelial cells in multiple myeloma secrete CXC-chemokines that mediate interactions with plasma cells. Br J Haematol. 2005;129:248–56.
- Feng Y, Ofek G, Soon Choi D, Wen J, Hu J, Zhao H, et al. Unique biomechanical interactions between myeloma cells and bone marrow stroma cells. Prog Biophys Mol Biol. 2010;103:148–56.
- Scheller J, Rose-John S. Interleukin-6 and its receptor: from bench to bedside. Med Microbiol Immunol. 2006;195:173–83.
- Jourdan M, Mahtouk K, Veyrune JL, Couderc G, Fiol G, Redal N, et al. Delineation of the roles of paracrine and autocrine interleukin-6 (IL-6) in myeloma cell lines in survival versus cell cycle. A possible model for the cooperation of myeloma cell growth factors. Eur Cytokine Netw. 2005;16(1):57–64.
- Zdzisińska B, Bojarska-Junak A, Dmoszyńska A, Kandefer-Szerszeń M. Abnormal cytokine production by bone marrow stromal cells of multiple myeloma patients in response to RPMI8226 myeloma cells. Arch Immunol Ther Exp. (Warsz) 2008;56(3):207–21.
- Arnulf B, Lecourt S, Soulier J, Lacassagne MN, Crinquette A, Dessoly J, et al. Phenotypic and functional characterization of bone marrow mesenchymal stem cells derived from patients with multiple myeloma. Leukemia 2007;21:158–63.
- Bisping G, Leo R, Wenning D, Dankbar B, Padro T, Kropff M, et al. Paracrine interactions of basic fibroblast growth factor and interleukin-6 in multiple myeloma. Blood 2003;101:2775–83.
- Kovacs E. How does interleukin-6 affect the membrane expressions of interleukin-6 receptor and gp130 and the proliferation of the human myeloma cell line OPM-2? Biomed Pharmacother. 2003;57:489–94.
- Lasfar A, Wietzerbin J, Billard C. Differential regulation of interleukin-6 receptors by interleukin-6 and interferons in multiple myeloma cell lines. Eur J Immunol. 1994;24:124–30.
- Thabard W, Collette M, Mellerin M-P, Puthier D, Barillé S, Bataille R, et al. IL-6 upregulates its own receptor on some human myeloma cell lines. Cytokine. 2001;14(6):352–6.
- Conticelloa C, Giuffridab R, Adamob L, Anastasi G, Martinetti D, Salomonec E, et al. NF-κB localization in multiple myeloma plasma cells and mesenchymal cells. Leuk Res. 2011;35:52–60.