Abstract
We investigated the role of protein tyrosine phosphatase-alpha (PTPα) expression in the cell death profile of the A431 human carcinoma cell line that was induced by cytotoxic concentrations of the nitric oxide (NO) donors sodium nitroprusside (SNP) and 3,3-bis-(aminoethyl)-1-hydroxy-2-oxo-1-triazene (NOC-18). Both NO donors promoted extensive cell detachment in A431 parental cells as compared to the detachment observed for A431 cells that ectopically expressed PTPα (A431 (A27BPTPα) cells). The NO-induced cell death characteristics for both cell lines were examined. After incubation for 10 hours with 2.0 mM SNP, attached or detached A431 cells underwent apoptosis. Cells were highly positive for Annexin-V, featured increased cleavage of procaspase-8, activation of downstream caspase-3, and activation of poly-ADP-ribose polymerase 1 (PARP-1). In contrast, exposure of A431 (A27BPTPα) cells to 2.0 mM SNP produced an increase in the release of lactate dehydrogenase and enhanced incorporation of propidium iodide. In addition, A431 (A27BPTPα) cells showed partial inhibition of the activities of caspase-8, caspase-3, and PARP-1 upon detachment and cell death induced by SNP treatment. Results indicate that necrotic cell damage was induced, characterized by cellular swelling and lysis. We conclude from these results that PTPα regulates the A431 tumor cell death profile mediated by NO donors. Expression of PTPα or its absence may determine the occurrence of NO-induced cell death with necrotic or apoptotic features, respectively.
Introduction
Nitric oxide (NO), a signaling molecule and free radical, is derived enzymatically from l-arginine and O2 from a reaction catalyzed by the NO synthases (NOS). This family of enzymes encompasses the neuronal isoform, the inducible isoform (iNOS), and the endothelial isoform. The neuronal and endothelial isoforms are Ca2+/calmodulin-dependent and are constitutively expressed, producing low levels of NO. Lipopolysaccharides, toxins, and cytokines stimulate the expression of iNOS with the corresponding production of high NO concentrations.Citation1 In addition, NO can be generated under physiological conditions by the decomposition of NO donors, e.g. S-nitroso-N-acetylpenicillamine (SNAP), 3,3-bis-(aminoethyl)-1-hydroxy-2-oxo-1-triazene (NOC-18), and sodium nitroprusside (SNP).
SNP, which is the most well-studied NO donor, is a coordination complex of ferrous iron, five cyanide anions, and a nitrosonium cation (NO+); SNP releases NO by two distinct mechanisms. The first mechanism involves photochemical decomposition and has no physiological relevance. The second mechanism depends exclusively on tissue culture conditions. NO and NO+ are released from SNP when this donor is incubated in the dark with vascular tissue cultures, rabbit aortic fractions, and human plasma. NO release involves the participation of biological reducing agents, such as thiol groups from amino acids, peptides and proteins, ascorbic acid, hemoglobin, myoglobin, and others.Citation2,Citation3
In contrast to its physiological role when generated in low concentrations,Citation4,Citation5 NO generated in high concentrations by iNOS or by NO donors at millimolar concentrations leads to cell death. Early descriptions of the morphological alterations associated with NO-mediated apoptosis were followed by increasing experimental evidence for apoptotic signaling pathways that are initiated by NO. Accumulation of p53, an increased ratio of Bax/Bcl2 protein expression, changes in mitochondrial function, and induction of the expression and activation of caspase-8 have been consistently associated with cell exposure to elevated concentrations of NO.Citation6
Recently, we reviewed the accumulated experimental evidence on the role of NO as an inducer of extracellular matrix detachment and of modifications to the cell cytoskeleton.Citation7 In addition to its inhibitory effects on cell adhesion, NO interferes with the assembly of focal adhesion complexes. Stimulation of tyrosine phosphorylation by NO of two major components of the focal adhesion complexes, focal adhesion kinase (FAK) and Src kinase, has been consistently reported.Citation8–Citation11
In addition to protein tyrosine kinases, protein tyrosine phosphatases (PTPs), such as the two non-receptor PTPs FAP-1 and PTP-1B, can modulate apoptosis.Citation12,Citation13 However, the role of receptor-like PTPs as modulators of apoptosis remains largely unexplored. A431 human tumor cells do not express the receptor-like PTPα, but they express high levels of the epidermal growth factor (EGF) receptor on their surface.Citation14 Stimulation of A431 cells with elevated concentrations of EGF (≥100 ng/ml) causes dramatic changes in cell morphology, including cell rounding and detachment from the substratum. Ectopic expression of PTPα in A431 cells protected them from EGF-induced cell detachment.Citation14 Recently, our group showed that NO derived from the nitrosothiol SNAP exhibited differential effects on the proliferation of mouse embryonic fibroblasts that depended on the expression of PTPα.Citation15 SNAP stimulated cell proliferation in fibroblasts that expressed PTPα and promoted growth arrest in fibroblast knockouts for PTPα.
In this study, we evaluated the ability of PTPα to modulate the death process associated with cell detachment and induced by reactive nitrogen species in the human vulvar carcinoma cell line A431. Parental A431 cells that do not express PTPα were exposed to millimolar concentrations of the NO-donor SNP for extended periods. Cell death was evaluated by phosphatidylserine exposure, propidium iodide (PI) labeling, lactate dehydrogenase (LDH) release, caspase-3 activation, caspase-8 activation, and the activation of poly-ADP ribose polymerase-1 (PARP1). We measured the same parameters to determine cell death in A431 cells that were permanently transfected with a plasmid encoding the PTPα gene. Finally, we have established and discussed the differences between SNP-induced mechanisms of cell death in A431 parental cells and those operative in A431 cells overexpressing PTPα.
Materials and methods
Reagents
SNP, 0.4% Trypan Blue solution, and EGF were purchased from Sigma (St Louis, MO, USA). Anti-mouse beta-actin monoclonal antibody and NOC-18-DETA NONOate were obtained from Calbiochem (San Diego, CA, USA). A Cytotoxicity LDH Detection Kit was purchased from Roche Applied Science (Penzberg, Germany). 3-(4,5-dimethylthiazol-2-yl)-2,5-diphenyl tetrasodium bromide (MTT) was obtained from Millipore (Bedford, MA, USA). Analytical grade isopropanol was purchased from Merck (Darmsdadt, Germany). Mouse monoclonal and rabbit polyclonal secondary antibodies conjugated with horseradish peroxidase (HRP) were obtained from Pierce (Rockford, IL, USA). A caspase-3 DEVD-R110 Fluorometric Assay Kit was obtained from Biotium (Hayward, CA, USA), and trypsin 0.25%, Geneticin®, Dulbecco's modified Eagle's medium (DMEM), and the cell culture medium antibiotics were obtained from Invitrogen (Camarillo, CA, USA). Anti-rabbit caspase-8 polyclonal antibody, anti-mouse PARP-1 monoclonal antibody, anti-mouse FAK monoclonal antibody, Annexin-V-FITC, Annexin-V Binding Buffer (10× concentrate), and PI staining solution were purchased from BD-Pharmingen (San Diego, CA, USA). Anti-rabbit Src polyclonal antibody was obtained from Santa Cruz Biotechnology (Santa Cruz, CA, USA). A rabbit polyclonal antibody against the intracellular domain of PTPα was produced in the laboratory of Dr Jan Sap (University of Copenhagen, Copenhagen, Denmark) and was kindly provided for this study.
Cell cultures and transfections
A431 (human epithelial carcinoma cell line) was obtained from the American Type Culture Collection. Clones A431(A27BPTPα) and A431(A18BPTPα) were selected after transfection of A431 cells with a plasmid containing the gene encoding the tyrosine phosphatase alpha (PTPα) protein or the transfection control with an expression vector without the phosphatase encoding gene (empty vector). A431 cells were cultured in DMEM supplemented with 10% fetal bovine serum (FBS), penicillin (100 units/ml), and streptomycin (100 µg/ml) at 37°C and 5% CO2. A431(A27BPTPα, A18BPTPα) and empty vector cells were cultured in DMEM supplemented with Geneticin 300 µg/ml, 10% FBS, penicillin (100 units/ml), and streptomycin (100 µg/ml) at 37°C and 5% CO2.
Cell detachment induced by SNP and NOC-18
A431 and the PTPα-expressing clones A431 (A27BPTPα) and A431 (A18BPTPα) were plated at a density of 1 × 10⁶ cells/ml, starved for 24 hours, and treated with the indicated concentrations of SNP or NOC-18. Cells were incubated at 37°C for the indicated time periods. After incubation, cells were stained with 0.4% trypan blue and counted for evaluation of cell viability. Detached cells as well as the cells remaining attached to the substratum were counted in a hemacytometer.
Qualitative examination of cell detachment from the substratum induced by SNP and EGF in A431 and the PTPα-expressing clones was performed using a Nikon TS-100 phase-contrast microscope.
Morphological analysis
A431 and A431 (A27BPTPα) cells were seeded at a density of 1 × 10⁵ cells/ml, starved for 24 hours, and treated with the indicated concentrations of SNP. Morphological changes in the cells were observed and recorded using a Nikon TS-100 phase-contrast microscope.
Confocal microscopy analysis of FAK and Src kinase
A431 and A431 (A27BPTPα) cells, seeded on glass cover slips, were fixed with 4% paraformaldehyde for 30 minutes and permeabilized with 0.1% Triton X-100 and 1% bovine serum albumin for 10 minutes at room temperature. After permeabilization, cells were incubated with anti-FAK and anti-Src kinase antibodies (1:300 dilution) for 2 hours. This was followed by incubation with the secondary antibodies: Texas Red anti-rabbit (1:200 dilution) and FITC conjugated anti-mouse IgG (1:200 dilution) for 30 minutes. Images were obtained using a confocal microscope LSM-510 NLO (Carl Zeiss, Jena, Germany).
MTT assay
A431 cells and the cloned PTPα-expressing A431 (A27BPTPα) cells were seeded at 5 × 10³ cells/well in a 96-well culture plate in 200 µl of 10% FBS-DMEM. After reaching 80% confluence, cells were starved for 24 hours and treated with the indicated concentrations of SNP for 10 hours at 37°C in a humidified 5% CO2 incubator. MTT was diluted 1:10 from a stock solution of 5 mg/ml in DMEM without FBS and added to each well, and the cells were incubated for 2 hours. Absorbance values were measured at 570 nm in a microplate reader (Spectramax plus; Molecular Devices, Sunnyvale, CA, USA).
Phosphatidylserine exposure and membrane permeability
Phosphatidylserine and membrane permeability were monitored by double labeling cells with Annexin-V and PI. A total of 1 × 10⁶ cells/ml of A431 parental cells and A431 (A27BPTPα) cells were plated, starved for 24 hours, treated with SNP or NOC-18, and incubated for 6 and 10 hours, respectively, at 37°C with 5% CO2. Annexin-V and PI labeling were performed according to the manufacturer's instructions. Cell Quest software (BD Biosciences Immunocytometry Systems, San Diego, CA, USA) was used to analyze 100 000 gated events.
LDH assay
The colorimetric assay for the quantification of LDH activity present in the cytosol was performed using the Roche Cytotoxicity Detection Kit according to the manufacturer's instructions.
Western blotting analysis of procaspase-8, PARP-1, and beta-actin
At each time point, cells were lysed in pH 7.5 buffer containing 20 mM Hepes, 150 mM NaCl, 1.5 mM MgCl2, 1.0 mM ethylene gylcol tetraacetic acid, 10% glycerol, 1% Triton, 1 µg/ml aprotinin, 1 µg/ml leupeptin, and 1.0 mM phenylmethylsulfonyl fluoride and phosphatase inhibitors (2 mM sodium orthovanadate, 50 mM NaF, and 10 mM sodium pyrophosphate). Cell lysates (60 µg/lane) were resolved in 12% sodium dodecyl sulfate-polyacrylamide gel electrophoresis gels and blotted onto polyvinylidene difluoride membranes (GE Healthcare, Buckinghamshire, UK). After incubation with a blocking solution containing 10% skim milk in TBS-T (TBS pH 7.6; Tween 0.1%), the membrane was incubated with antigen-specific antibodies against procaspase-8, PARP-1, and beta-actin followed by incubation with an appropriate secondary HRP-conjugated antibody. Immunoblots were developed using the Super Signal chemiluminescence-based system (Pierce).
Assay for caspase-3 activity
Caspase-3 activity was determined using the fluorescence-based detection kit for caspase-3, DEVD-R110 (Biotium), according to the manufacturer's instructions. Caspase-3 activity was estimated using the cleavage product of the fluorogenic substrate R110 (470-nm excitation filter and 520-nm emission filter).
Statistical analysis
All data shown represent the mean ± SD of at least three independent experiments. Statistical analyses were performed using Student's t-test. A two-tailed value of P < 0.05 was considered of statistical significance.
Results
SNP promotes cell death and differential detachment between A431 tumor cells and A431 cells that express PTPα
We generated two stable, transfected clones of A431 cells that overexpress PTPα (clones A431 (A27BPTPα), A431 (A18BPTPα). As a control for the transfection, we also produced A431 cells transfected with an empty vector. Expression of PTPα is shown after an immunoblotting analysis of A431 and A431 (A27BPTPα) (A); HeLa cells that express PTPαCitation16 and A431 empty vector-transfected cells were used as a positive and negative control, respectively, for expression of the phosphatase. A431 tumor cells and A431 (A27BPTPα) cells were treated with increasing concentrations of the nitro vasodilator SNP. The MTT assay and the Trypan Blue staining were used to determine cell viability and the extent of cell detachment, respectively. Exposure of cells to all of the tested concentrations of SNP for a period of 6 hours was neither sufficient to initiate a differential detachment nor to promote loss of viability (B). At concentrations of 0.1 and 0.5 mM, a loss of cell viability and cell detachment were not observed after incubation for either 6 or 10 hours. After incubation for 10 hours, cells exposed to 1.0 mM SNP start to lose their viability and detach from the substratum, and significant differences between the cell lines were not observed. However, 2.0 mM SNP promoted differential cell detachment and loss of cell viability in both cell lines, and this concentration was used for the NO-donor in further studies (B and C). Importantly, after incubation for 10 hours with 2.0 mM SNP, empty-vector (pcDNA3), permanently transfected A431 cells detached from the substratum to the same extent observed for the A431 parental cell line (D). In contrast, A431 (A27BPTPα) and A431 (A18BPTPα) cell lines detached from the substratum to a lesser extent when compared to the detachment observed for A431 parental cells and for empty-vector transfected cells (D). The two selected clones expressing PTPα presented similar sensitivity to SNP-induced cell detachment, and the A431 (A27BPTPα) clone was used throughout this study.
Figure 1. Expression levels of PTPa and determinations of cell viability and cell detachment after exposure of A431 and A431 (A27BPTPα) cells to NO donors. (A) Total protein lysates (50 µg/ml) from A431 parental cells, HeLa cells, A431 empty vector-transfected cells, and A431 (A27BPTPα) cells were immunoblotted with anti-PTPα and anti-beta-actin (protein loading control) antibodies. (B) A431 parental and A431 (A27BPTPα) cells were treated with increasing concentrations of SNP (0–2.0 mM) at the indicated times. Detached cells were collected and counted in a hemacytometer. Means ± SD (n = 3), ***P < 0.01 vs. A431 parental cells treated with 2.0 mM SNP for 10 hours. (C) Cells were cultured in medium with increasing concentrations of SNP (0–2.0 mM) for 10 hours. Cell viability was estimated using the MTT reagent. Values are reported in the bar graphs and expressed as the means ± SD (n = 6, ***P ≤ 0.05). (D) A431 parental cells, A431 (A18BPTPα) cells, A431 (A27BPTPα) cells, and empty vector transfected cells were treated with 2.0 mM SNP for 10 hours. Detached cells were collected and counted in a hemacytometer. Means ± SD (n = 3), ***P < 0.01 vs. A431 parental cells. (E) A431 parental and A431 (A27BPTPα) cells were treated with increasing concentrations of NOC-18 (0.1, 1.0, and 2.0 mM) at the indicated times. Detached cells were collected and counted in a hemacytometer. The percentages of detached cells shown in the bar graphs are expressed as the means ± SD from three independent experiments. Statistical significance was determined using Student's t-test (*P < 0.05).
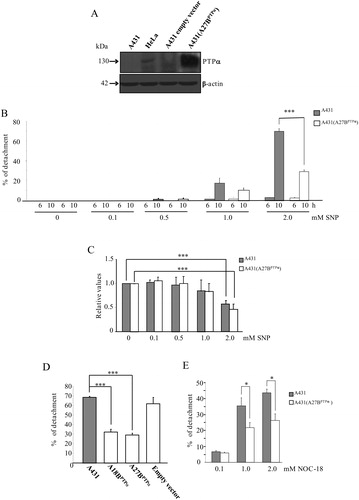
To demonstrate the anti-adhesive effects promoted by other NO donors, the cell detachment experiment was repeated using NOC-18. NOC-18 is a NONOate and releases NO over a long period. Its half-life in phosphate-buffered saline, pH 7.4, at 22°C is 3400 minutes.Citation17 E shows a decrease in the detachment of A431 (A27BPTPα) cells when compared to A431 cells after treatment with NOC-18 for 24 hours. Differences in cell detachment were not significant after incubation with 0.1 mM NOC-18; they became significant at concentrations of 1.0 and 2.0 mM of the NO donor. These results suggest that NO+ released from SNP and NO released from NOC-18 are capable of inducing cell detachment when the NO donors are used at concentrations ≥1.0 mM, and the extension of detachment can be modulated by PTPα expression.
A431 and A431 (A27BPTPα) cells are resistant to cell rounding and adhesion-disrupting effects of SNP
Alterations in cell morphology associated with cell rounding and detachment were evaluated in A431 cells and in A431 (A27BPTPα) cells after treatment with increasing concentrations of SNP. A431 cells and A431 (A27BPTPα) cells remained adherent and spread out following exposure to low concentrations of SNP (0–0.5 mM) (A). After exposure to concentrations of 1.0 and 2.0 mM SNP, A431 (A27BPTPα) cells did not display evident morphological changes. However, a dramatic change in cell morphology was evident in A431 cells following exposure to 1.0 and 2.0 mM SNP (A).
Figure 2. PTPα overexpression in A431 cells and its relationship with cell rounding and cell detachment induced by SNP. (A) Increasing concentrations of SNP (0–2.0 mM) caused A431 parental cells to round-up after 10 hours incubation. A431 (A27BPTPα) cells exposed to the same concentrations of SNP remained mostly adhered and spread out. (B) A431 parental and A431 (A27BPTPα) cells were treated with 2.0 mM SNP (mid panel) or with 100 ng/ml EGF (lower panel) during 10 hours of incubation. Control cells for both cell lines were left untreated for the 10-h incubation period (top panel). Cells round-up (magnification, 3 × 10). (C) A431 and A431 (A27B PTPα) cells grown on glass cover-slips were maintained in serum-free medium (upper panels) or incubated with 2.0 mM SNP for 10 hours (lower panels). Cells were fixed and co-stained for Src kinase (alpha-Src) and alpha-FAK. Co-localization is shown on the merge of confocal images obtained from staining for Src and FAK in both cell lines incubated or not with 2.0 mM. Bar, 10 µm.
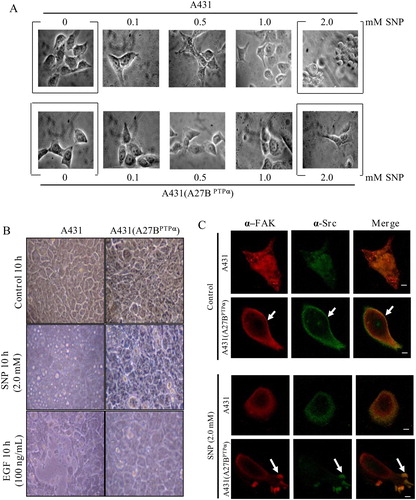
High concentrations of EGF promote the rounding-up of A431 cells and their detachment from the substratum.Citation14 To evaluate if the EGF-dependent adhesion-disrupting effects were comparable to the effects produced by high concentrations of the NO donor, we examined cell morphology of A431 cells and A431 (A27BPTPα) cells exposed to 2.0 mM SNP or 100 ng/ml EGF. In agreement with the initial observations for cell detachment, rounding-up of the cells was not significant after incubation for 6 hours with both agents (data not shown). Cells round up and detach from the substratum after incubation for 10 hours with both agents. Corroborating previous observations, the expression of PTPα in A431 (A27BPTPα) cells resulted in resistance to EGF-induced cell rounding (B), and these cells showed increased resistance to cell rounding and detachment promoted by 2.0 mM SNP (A and B). These observations suggest a protective role for PTPα against SNP-induced alterations in cell morphology that are associated with its anti-adhesive effects.
The remodeling of focal adhesions is directly related to cell motility.Citation18 Early observations suggested a modulatory role for NO in the assembly of focal adhesions.Citation8 In our previous studies in murine fibroblasts, we found that SNP stimulated the association of Src kinase with FAK, two major components of the focal adhesion complexes.Citation11 Here, using a confocal microscopy-based technique and antibodies that recognize Src kinase and FAK, we examined the association of both proteins in A431 and A431 (A27BPTPα) cell lines exposed, or not, to 2.0 mM SNP. Src kinase labeling and FAK labeling did not superimpose in A431 non-treated cells. After stimulation with the NO donor, Src kinase labeling was slightly superimposed on FAK labeling at the cell extremities in A431 cells. In contrast, there were basal levels of association of Src kinase and FAK at the cell extremities in A431 (A27BPTPα) cells. Furthermore, Src kinase labeling was strongly superimposed on FAK labeling at the cell edge in A431 (A27BPTPα) cells incubated with SNP (C).
Phosphatidylserine translocation to the extracellular surface, PI labeling, and LDH release after treatment of A431 and A431 (A27BPTPα) cells with SNP
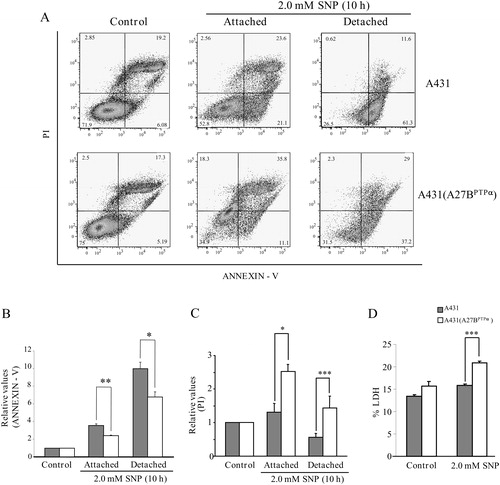
We sought to establish a death profile for A431 and A431 (A27BPTPα) cells after treatment with 2.0 mM SNP during 6- and 10-hour periods of incubation. Levels of phosphatidylserine exposure for A431 parental cells and A431 (A27BPTPα) cells were determined by flow cytometry-based quantification of Annexin-V binding. Flow cytometry-based quantification of cell labeling with PI was performed for these cell lines (A). After incubation for 6 hours with the NO donor, both cell lines remained attached to the substratum (see also B). The percentage of Annexin-V-positive cells and the percentage of PI-positive cells were not significantly different between the two cell lines (B and C). However, after incubation for 10 hours, the percentage of Annexin-V-positive cells was higher in A431 parental cells than in A431 (A27BPTPα) cells (A). This difference remained unchanged between cells that remained attached to their substrate and cells detached from it (B). The percentage of PI-positive cells in all of the studied situations was higher in A431 (A27BPTPα) cells than in A431 cells (C); high percentages of PI-positive cells suggest a profile of cell death related to necrosis. The percentage of LDH release from A431 and A431 (A27BPTPα) cells after incubation for 10 hours with 2 mM SNP was also determined. LDH release was significantly higher in A431 (A27BPTPα) cells than in A431 cells (D).
Figure 3. PTPα overexpression in A431 cells and its relationship with levels of phosphatydilserine exposure/PI labeling induced by SNP. (A) A431 parental cells and A431 (A27BPTPα) cells were treated with 2.0 mM SNP during 6 hours of incubation. Detached and attached cells were harvested, collected, and incubated with Annexin-V/PI followed by flow cytometry analysis. (B) Percentages of phosphatidylserine exposure. (C) Percentages of PI labeling. All values are expressed as the means ± SD from three independent experiments. Statistical significance was determined using Student's t-test (*P < 0.05; **P < 0.01; ***P < 0.001).
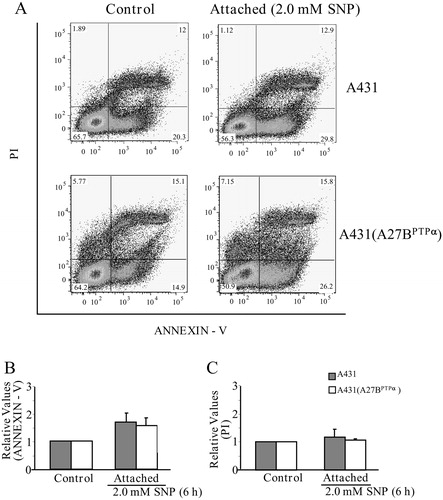
Figure 4. PTPα overexpression in A431 cells and its relationship with levels of phosphatydilserine exposure/PI labeling and LDH release induced by SNP. (A) A431 parental cells and A431 (A27BPTPα) cells were treated with 2.0 mM SNP during 10 hours of incubation. Detached and attached cells were harvested, collected, and incubated with Annexin-V/PI followed by flow cytometry analysis. (B) Percentages of phosphatidylserine exposure. (C) Percentages of PI labeling. (D) Percentages of LDH release over control values. All values are expressed as the means ± SD from three independent experiments. Statistical significance was determined using Student's t-test (*P < 0.05; **P < 0.01; ***P < 0.001).
Differential activation of caspase-8 and caspase-3 induced by SNP in A431 and A431 (A27BPTPα)
Caspase-8, an initiator of apoptosis, plays a crucial role in driving the apoptotic process.Citation19 Early studies showed that SNP-induced apoptosis in primary renal proximal tubular epithelial cells was dependent on the activation of caspase-8.Citation20 Here we showed that procaspase-8 cleavage (caspase-8 activation) in A431 cells and A431 (A27BPTPα) cells is stimulated with 2.0 mM SNP. Western blot analysis revealed that the extent of procaspase-8 cleavage in A431 (A27BPTPα) cells is reduced in both attached and detached cells when compared to A431 cells treated under the same conditions (A). The limited caspase-8 cleavage observed in A431 (A27BPTPα) cells suggests that there is a direct correlation between levels of caspase-8 and the SNP-induced death profile for these cells. A431 (A27BPTPα) cells showed a SNP-induced death profile characterized by a low percentage of Annexin-V-positive cells, a high percentage of PI-positive cells, and high levels of LDH release.
Figure 5. PTPα overexpression in A431 cells and its relationship with the activation of caspase-8, caspase-3, and PARP-1. (A) A431 parental cells and A431 (A27BPTPα) cells were treated with 2.0 mM SNP for a 10-hour incubation period. Detached and attached cells were harvested, collected, and lysed. Cell extracts (50 µg/ml) were immunoblotted with anti-procaspase-8 and anti-beta-actin (protein loading control) antibodies. Representative blots from three independent experiments are shown. Relative densitometric values of the protein bands are shown in columns. (B) A431 parental cells and A431 (A27BPTPα) cells were incubated with 2.0 mM SNP for 10 hours. Detached and attached cells were harvested, collected, and lysed. The caspase-3 activity in cell lysates was determined using a fluorimetric assay kit. Control cells were left untreated for the same period of incubation. All values are expressed as the means ± SD from three independent experiments. Statistical significance was determined using the Student's t-test (*P < 0.05; **P < 0.01). (C) Exponentially growing cells (control) and starved (control S) A431 parental cells and A431 (A27BPTPα) cells were treated or untreated with 2.0 mM SNP for 10 hours of incubation. Detached and attached cells were harvested, collected, and lysed. Cell extracts (50 µg/ml) were immunoblotted with anti-PARP1 and anti-beta-actin (protein loading control) antibodies. Representative blots from three independent experiments are shown.
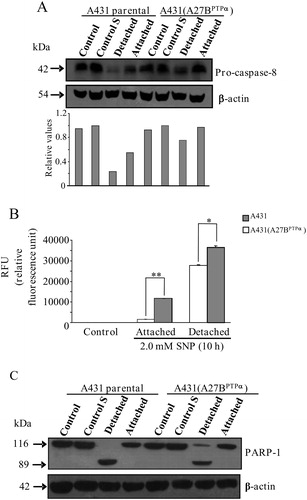
The activation of caspase-3 followed the same trend that was observed for caspase-8 activation. Caspase-3 was activated to a lesser extent in A431 (A27BPTPα) cells that remained attached to the substrate as well as in those that were detached after treatment with 2.0 mM SNP for 6 hours, than in A431 cells treated under the same conditions (B).
Differential cleavage of PARP-1 during A431 and A431 (A27BPTPα) cell death processes induced by SNP
PARP-1 is a 116-kDa protein that is cleaved to 85- and 31-kDa fragments during apoptosis by members of the caspase-3 family of cysteine proteases. In its active form, PARP-1 promotes DNA cleavage.Citation21 A431 and A431 (A27BPTPα) cells treated with 2.0 mM SNP for 10 hours were submitted to Western blot analysis to verify the cleavage pattern of PARP-1 in both cell lines. The analysis was performed using the polyclonal antibody anti-PARP-1, which recognizes the 116 kDa PARP-1 pro-enzyme and its cleavage form of approximately 85 kDa. Unlike the activation pattern observed for caspase-8 and caspase-3, SNP-induced PARP-1 cleavage was not observed in A431 cells or in A431 (A27BPTPα) cells that remained attached to their substrate during the 10-hour incubation period. However, PARP-1 was fully cleaved in detached A431 cells, but PARP-1 was only partially cleaved in detached A431 (A27BPTPα) cells (C).
The observed profiles for caspase-8 and caspase-3 activation and PARP-1 cleavage suggest that in cells that do not express PTPα, NO-mediated cell death occurs with the characteristics of apoptosis. Conversely, expression of PTPα shifts the profile of NO-mediated cell death from an apoptosis-like mode of cell death to a necrosis-like mode of cell death.
Discussion
NO has been called a ‘double-edged sword’ because of its dual role in the modulation of cell proliferation as well as cell death.Citation21,Citation22 Physiologically low concentrations of NO are required for normal cell and tumor cell proliferation, whereas elevated concentrations of NO stimulate apoptosis in an extensive variety of cell lines.Citation6,Citation23 In addition to the cellular NO concentration, interactions of NO with other reactive species and the target cell type may determine the outcome: either cell proliferation or cell demise.Citation24
NO inhibits cell adhesion, interferes in focal adhesion complex formation, and disturbs cell–matrix interactions.Citation8 Goligorsky et al.Citation8 showed that low concentrations (0.1–0.5 mM) of SNP exhibited an anti-adhesive effect on non-transformed cell lines, human umbilical vein endothelial cells, and Swiss-3T3 murine fibroblasts. However, in A431 tumor cell lines exposed to the same NO donor, we have shown that the anti-adhesive effects on the cells only occurred at SNP concentrations ≥1.0 mM. In addition, ectopic expression of the receptor-like tyrosine phosphatase PTPα in A431 cells inhibited the anti-adhesive effects of millimolar concentrations of SNP. The anti-adhesive effects observed in cells incubated with SNP were reproduced in cells incubated with equimolar concentrations of NOC-18 for 24 hours. NOC-18 belongs to a class of NO donors known as diazeniumdiolates or NONOates that steadily release NO for prolonged periods.Citation17 Differences between the two cell lines regarding the efficiency of NO-induced cell detachment possibly occurs because PTPα is an essential component of the focal adhesion complex,Citation25 and its expression may produce cells that are more resistant to the anti-adhesive action mediated by reactive nitrogen species. Regardless of the nature of the NO donor, only millimolar concentrations of these compounds were capable of inducing detachment of the A431 and A431 (A27BPTPα) cells at significant levels. Under these conditions, cell detachment was followed by loss of cell viability.
Modulation of the expression levels of focal adhesion complex components, such as PTPα, can promote modifications of cell anchorage to the extracellular matrix.Citation25 Ectopic expression of PTPα in A431 cells is associated with increased cell–substratum adhesion. Differential detachment from the substratum following EGF stimulation was demonstrated in A431 cells that expressed PTPα when compared to those that did not express PTPα. EGF-induced cell detachment was shown to be higher in A431 cells as compared to the detachment observed for A431 cells overexpressing PTPα.Citation14 Here, we have shown that SNP mimicked the anti-adhesive effects of EGF in A431 cells. SNP-stimulated rounding up and detachment from the substratum was more efficient in A431 parental cells than in A431 (A27BPTPα) cells after 10 hours treatment with 2.0 mM SNP. PTPα-expressing A431 cells were especially resistant either to EGF or to NO-induced cell rounding and detachmentCitation14 (this work).
The pro-adhesive effects of PTPα ectopic expression in A431 cells have been linked to an increased association of Src kinase with FAK upon EGF stimulation.Citation14 We have previously shown that association of FAK and Src kinase was stimulated in 3T3 murine fibroblasts overexpressing the EGF receptor when exposed to SNP in a concentration range of 0.1–1.0 mM.Citation11 Similar results were obtained in the present study. Src kinase and FAK strongly co-localize at the edge of the cell body in A431 (A27BPTPα) cells after stimulation with SNP, whereas in SNP-treated A431 cells, the co-localization of these proteins was not significant.
Association of Src kinase and FAK stimulated by low concentrations of SNP has been associated with endothelial cell migration.Citation8 The elevated concentrations of SNP used in our study to stimulate both tumor cell lines promoted differential cell detachment as well as differential levels of association between FAK and Src kinase. Our previous findings described the NO-mediated stimulation of tyrosine phosphorylation and association of Src kinase and FAK.Citation11 We provided experimental evidence that NO can act as a signal through a cascade of reactions normally used by integrins and growth factors.Citation11,Citation26 Activation and organization of a cascade by NO of the same kinases used by growth factors and integrins to promote cell growth could be diverted to promote growth arrest.Citation15
Cell death profiles after incubation with SNP were determined for both A431 parental and A431 (A27BPTPα) cell lines. Flow cytometry-based analysis revealed that SNP induces a higher percentage of Annexin-V-positive cells in A431 parental cells than in A431 (A27BPTPα) cells. However, the percentage of PI-positive cells was higher in A431 (A27BPTPα) cells than in the parental cells. The higher percentage of Annexin-V-positive cells found in detached A431 parental cells after treatment with SNP suggests a death profile associated with apoptosis. On the other hand, the SNP-treated A431 (A27BPTPα) cells, which feature a higher percentage of PI-positive cells, also detached from the substratum, although to a lesser extent. The higher levels of LDH release observed for A431 (A27BPTPα) cells as compared to the levels determined for A431 parental cells are suggestive of necrosis.Citation27
SNP and NOC-18, the NO donors used in our study, have been described as inducers of apoptosis through activation of caspase-8.Citation20,Citation28 Here, we showed that differential activation of caspase-8 and of its downstream substrates caspase-3 and PARP-1 occurred in A431 parental cells when compared to A431 (A27BPTPα) cells exposed to SNP. When compared to A431 parental cells treated in the same conditions, cleavage of procaspase-8 was less efficient in A431 (A27BPTPα) cells that remained adhered after treatment with SNP as well as in cells that were detached. Accordingly, both caspase-3 and PARP-1 activities decreased in A431 (A27BPTPα) cells when compared to A431 parental cells. Total or partial inhibition of caspases activities and of the activities of downstream elements of the apoptotic cell death-signaling pathway has been consistently associated with the occurrence of necrosis.Citation29,Citation30 Therefore, our results indicate that the expression of PTPα in A431 (A27BPTPα) cells and its lack of expression in A431 cells can be used to explain the necrotic and apoptotic patterns of NO-induced cell death found in our studies.
A number of reports have suggested the involvement of PTPs in cell death control. The ectopic expression of the non-receptor PTP FAP-1 in cells expressing the Fas receptor blocks the apoptotic signal through interactions of the PTP with the Fas receptor ‘death domain’.Citation12 However, Buckley et al.Citation13 observed high phosphorylation levels and kinase activity in the insulin-like growth factor receptor with increased protection against apoptosis using immortalized fibroblasts obtained from PTP-1B-knockout mice. Re-introduction of PTP-1B in these fibroblasts through permanent transfection resulted in decreased phosphorylation levels of insulin-like growth factor receptor with consequent reduction in cell resistance to apoptosis.Citation13
In addition to non-receptor PTPs, overexpression of the receptor-like PTP leukocyte antigen related (LAR) has been shown to be particularly cytotoxic to mammalian non-transformed cell lines and induced apoptosis in tumor cell lines.Citation31 Apoptosis induced by LAR overexpression was associated with the activation of caspase-3 and cleavage of PARP-1. The expression of PTPα suggests a controversial role for this protein in the regulation of apoptosis. PTPα is highly expressed in the developing retina of different species. Knockdown of PTPα expression leads to induction of apoptosis of a specific cell population in the retina of developing zebra fish embryos, resulting in fewer cells and subsequently smaller eyes.Citation32 Conversely, expression of PTPα in human breast carcinomas is associated with tumor growth inhibition and delayed metastasis.Citation33
Our findings point to an important role for PTPα as a profile determinant in NO-mediated cell death. Due to their capacity to induce cell death, NO donors have been successfully used in experimental cancer models as chemotherapeutic agents.Citation34 However, our findings indicate that in a NO donor-based chemotherapy, a screening of tumors for PTPα expression prior to treatment would be necessary to avoid a potential necrotic mode of cell death induced by these compounds.
Acknowledgment
We gratefully acknowledge Tânia Maria da Silva for her technical assistance on flow cytometry analysis. This work was supported by grants from FAPESP (Fundação de Amparo a Pesquisa do Estado de São Paulo/Brazil; Proc. 06/56311-0 and Proc. 07/59617-6) and from the Conselho Nacional de Desenvolvimento Científico e Tecnológico/Brazil (CNPq) Instituto do Milênio – Redoxoma (Projeto 42011/2005) to H.P.M.
References
- Nathan C. Nitric oxide as a secretory product of mammalian cells. FASEB J 1992;6:3051–64.
- Katsuki S, Arnold WP, Mittal CK, Murad F. Stimulation of guanylate cyclase by sodium nitroprusside, nitroglycerin, and nitric oxide in various tissue preparations and comparison to the effect of sodium azide and hydroxylamine. J Cyclic Nucleot Res 1977;3:23–35
- Bates JN, Baker MT, Guerra JR, Harrison DG. Nitric oxide generation from nitroprusside by vascular tissue evidence that reduction of the nitroprusside anion and cyanide loss are required. Biochem Pharmacol 1991;42:157–65.
- Traister A, Abashidze S, Gold V, Plachta N, Karchovsky E, Patel K, et al. Evidence that nitric oxide regulates cell cycle progression in the developing chicken neuroepithelium. Dev Dyn 2002;225:271–6.
- Rocha Oliveira CJ, Curcio MF, Moraes MS, Tsujita M, Travassos LR, Stern A, et al. The low molecular weight S-nitrosothiol, S-nitroso-N-acetylpenicillamine, promotes cell cycle progression in rabbit aortic endothelial cells. Nitric Oxide 2008;18:241–55.
- Brune B, Von Knethen A, Sandau KB. Nitric oxide (NO): an effector of apoptosis. Cell Death Differ 1999;6:969–75.
- Monteiro HP, Silva EF, Stern A. Nitric oxide: a potential inducer of adhesion-related apoptosis-anoikis. Nitric Oxide 2004;10:1–10.
- Goligorsky MS, Abedi H, Noiri E, Takhtajan A, Lense S, Romanov V, et al. Nitric oxide modulation of focal adhesions in endothelial cells. Am J Physiol 1999;276:C1271–81.
- Akhand AA, Pu M, Senga T, Kato T, Suzuki H, Miyata T, et al. Nitric oxide controls Src kinase activity through a sulfhydryl group modification-mediated Tyr-527-independent and Tyr-416-linked mechanism. J Biol Chem 1999;274:25821–6.
- Garcia-Benito M, San Roman JI, Lopez MA, Garcia-Marin JJ, Calvo JJ. Nitric oxide stimulates tyrosine phosphorylation of p125 (FAK) and paxillin in rat pancreatic acini. Biochem Biophys Res Commun 2000;274:635–40.
- Monteiro HP, Gruia-Gray J, Peranovich TMS, Barbosa de Oliveira LC, Stern A. Nitric oxide stimulates tyrosine phosphorylation of focal adhesion kinase, Src kinase, and mitogen-activated protein kinases in murine fibroblasts. Free Radic Biol Med 2000;28:174–82.
- Ungefroren H, Kruse ML, Trauzold A, Roeschmann S, Roeder C, Arlt A, et al. FAP-1 in pancreatic cancer cells: functional and mechanistic studies on its inhibitory role in CD95-mediated apoptosis. J Cell Sci 2001;114:2735–46.
- Buckley DA, Cheng A, Kielv PA, Tremblay ML, O'Connor R. Regulation of insulin-like growth factor type I (IGF-I) receptor kinase activity by protein tyrosine phosphatase 1B (PTP-1B) and enhanced IGF-I-mediated suppression of apoptosis and motility in PTP-1B-deficient fibroblasts. Mol Cell Biol 2002;22:1998–2010.
- Harder KW, Moller NPH, Peacock JW, Jirik FR. Protein-tyrosine phosphatase α regulates Src family kinases and alters cell–substratum adhesion. J Biol Chem 1998;273:31890–900.
- Curcio MF, Batista WL, Linares E, Nascimento FD, Moraes MS, Borges RE, et al. Regulatory effects of nitric oxide on Src kinase, FAK, p130cas, and receptor protein tyrosine phosphatase-alpha (PTPα): a role for the cellular redox environment. Antiox Redox Signal 2010;13:109–25.
- Zheng X, Resnick RJ, Shalloway D. Apoptosis of estrogen-receptor negative breast cancer and colon cancer cell lines by PTPα and Src RNAi. Int J Cancer 2008;122:1999–2007.
- Seccia M, Perugini C, Albano E, Bellomo G. Inhibition of Cu2+-induced LDL oxidation by nitric oxide: a study using donors with different half-time of NO release. Biochem Biophys Res Commun 1996;220:306–9.
- Cox BD, Natarajan M, Stettner MR, Gladson CL. New concepts regarding focal adhesion kinase promotion of cell migration and proliferation. J Cell Biochem 2006;99:36–52.
- Hengartner MO. The biochemistry of apoptosis. Nature 2000;407:770–6.
- Du C, Guan Q, Diao H, Yin Z, Jevnikar AM. Nitric oxide induces apoptosis in renal tubular epithelial cells through activation of caspase-8. Am J Physiol Renal Physiol 2006;290:F1044–54.
- Dimmeler S, Zeiher AM. Nitric oxide and apoptosis: another paradigm for the double-edged role of nitric oxide. Nitric Oxide 1997;1:275–81.
- Thomas DD, Ridnour LA, Isenberg JS, Flores-Santana W, Switzer CH, Donzelli S, et al. The chemical biology of nitric oxide: implications in cellular signaling. Free Radic Biol Med 2008;45:18–31.
- Fukumura D, Kashiwagi S, Jain RK. The role of nitric oxide in tumor progression. Nat Rev Cancer 2006;6:521–34.
- Monteiro HP, Arai RJ, Travassos LR. Protein tyrosine phosphorylation and protein tyrosine nitration in redox signaling. Antiox Redox Signal 2008;10:843–89.
- Giancotti FG, Ruoslahti E. Integrin signaling. Science 1999;285:1028–32.
- Peranovich TMS, da Silva AM, Fries DM, Stern A, Monteiro HP. Nitric oxide stimulates tyrosine phosphorylation in murine fibroblasts in the absence and presence of epidermal growth factor. Biochem J 1995;305:613–9.
- Kroemer G, Galluzzi L, Vandenabeele P, Abrams J, Alnemri ES, Baehrecke EH, et al. Classification of cell death: recommendations of the Nomenclature Committee on Cell Death 2009. Cell Death Differ 2009;16:3–11.
- Yabuki M, Kariya S, Inai Y, Hamazaki K, Yoshioka T, Yasuda T, et al. Molecular mechanisms of apoptosis in HL-60 cells induced by a nitric oxide-releasing compound. Free Radic Res 1997;27:325–35.
- Vercammen D, Beyaert R, Denecker G, Van de Craen M, Declercq W, Fiers W, et al. Inhibition of caspases increases the sensitivity of L929 cells to necrosis mediated by tumor necrosis factor. J Exp Med 1998;187:1477–85.
- Ma Y, Temkin V, Liu H, Pope RM. NF-kB protects macrophages from Lipopolysaccharide-induced cell death. The role of caspase 8 and receptor interacting protein. J Biol Chem 2005;280:41827–34.
- Weng L-P, Yuan J, Yu Q. Overexpression of the transmembrane tyrosine phosphatase LAR activates the caspase pathway and induces apoptosis. Curr Biol 1998;8:247–56.
- Van der Sar AM, Zivkovic D, Den Hertog J. Eye defects in receptor protein tyrosine phosphatase α knock-down zebrafish. Dev Dyn 2002;223:292–7.
- Ardini E, Agresti R, Tagliabue E, Greco M, Aiello P, Yang L-T, et al. Expresion of protein tyrosine phosphatase alpha (RPTPα) in human breast cancer correlates with low tumor grade, and inhibits tumor cell growth in vitro and in vivo. Oncogene 2000;19:4979–87.
- Mocellin S. Nitric oxide: cancer target or anticancer agent? Curr Cancer Drug Target 2009;9:214–36.