
Abstract
Background:
Missing data can compromise inferences from clinical trials, yet the topic has received little attention in the clinical trial community. Shortcomings in commonly used methods used to analyze studies with missing data (complete case, last- or baseline-observation carried forward) have been highlighted in a recent Food and Drug Administration-sponsored report. This report recommends how to mitigate the issues associated with missing data. We present an example of the proposed concepts using data from recent clinical trials.
Methods:
CD4+ cell count data from the previously reported SINGLE and MOTIVATE studies of dolutegravir and maraviroc were analyzed using a variety of statistical methods to explore the impact of missing data. Four methodologies were used: complete case analysis, simple imputation, mixed models for repeated measures, and multiple imputation. We compared the sensitivity of conclusions to the volume of missing data and to the assumptions underpinning each method.
Results:
Rates of missing data were greater in the MOTIVATE studies (35%–68% premature withdrawal) than in SINGLE (12%–20%). The sensitivity of results to assumptions about missing data was related to volume of missing data. Estimates of treatment differences by various analysis methods ranged across a 61 cells/mm3 window in MOTIVATE and a 22 cells/mm3 window in SINGLE.
Conclusions:
Where missing data are anticipated, analyses require robust statistical and clinical debate of the necessary but unverifiable underlying statistical assumptions. Multiple imputation makes these assumptions transparent, can accommodate a broad range of scenarios, and is a natural analysis for clinical trials in HIV with missing data.
Keywords:
Introduction
Missing data compromise inferences from clinical trials,Citation1,Citation2 yet the topic has received little attention in the clinical trial community.Citation3 Global regulatory guidancesCitation4,Citation5 on the design, conduct, and analysis of clinical trials have little specific advice on how to address the problem of missing data. In 2008, the Food and Drug Administration (FDA) requested that the National Research Council (NRC) convene an expert panel to prepare “a report with recommendations that would be useful for FDA's development of guidance for clinical trials on appropriate study design and follow-up methods to reduce missing data and on appropriate statistical methods to address missing data for analysis of results.” That reportCitation6 has attracted review in the generalist medicalCitation7,Citation8 and statisticalCitation9 literature. For the recommendations of this report and of recent European regulatory guidanceCitation10 to become established research practice, relevant examples of the concepts and techniques they propose should be presented in the specialist medical literature.Citation11,Citation12
The NRC report makes recommendations on trial design, planning, and conduct and analysis. In the setting of trials of treatments for HIV infection, interventions in the design, planning, and conduct of clinical trialsCitation13 lead to a reduction in avoidable dropout.Citation14 Nevertheless, as in other therapeutic areas, some missing data are unavoidable. The primary endpoint in many clinical trials for the treatment of HIV-1 has a regulatory definition for the treatment of missing data.Citation15,Citation16 Differentiation between treatments on the primary endpoint is complicated by high response rates and noninferiority designs.Citation17–Citation21 This increases the need for accurate assessment of secondary endpoints such as the immunologic response or the lipid profile, which can be used to differentiate treatments.
The continuous measures used to describe these effects (e.g. change from baseline in CD4+ cell count or total cholesterol) are presented in different ways: often only for the subjects who complete the study; sometimes with single values imputed for missing ones.Citation2 The former analysis (often referred to as “completers,” “complete case,” or “observed”) can bias results by analyzing only study participants for whom the treatment is tolerable and effective. The latter is the set of single imputation methods. These can enable transparent discussion of the assumptions underpinning an analysis. The most well-known and widely used single imputation methods are the last- and baseline-observation carried forward (LOCF and BOCF)Citation22 although “in nearly all cases, there are better alternatives to LOCF and BOCF imputation, which are based on more reasonable assumptions and hence result in more reliable inferences about treatment effects.”Citation6 Single imputation methods also weight imputed data as if they are new independent data, which they are not. This leads to overestimation of the apparent volume of observed data, which in turn leads to incorrect confidence intervals. The NRC panel recommends statistically robust methods for missing data.
We therefore present the ideas and assumptions behind alternative analysis methods for continuous data using the example of the CD4+ cell count data from the SINGLE and MOTIVATE studies.
Methods
SINGLE (NCT01263015) was a randomized, double-blind, phase 3 study involving treatment-naïve adult participants. Participants were randomly assigned (1:1) to dolutegravir plus abacavir–lamivudine once daily (DTG+ABC/3TC group) or to fixed-dose efavirenz, tenofovir disoproxil fumarate, and emtricitabine once daily (EFV/TDF/FTC group). The primary endpoint was the proportion of participants with an HIV-1 RNA level of less than 50 copies per mL at week 48 and has been reported elsewhere.Citation23
The MOTIVATE 1 and 2 trials (NCT00098306, NCT00098722) were two randomized, double-blind, placebo-controlled, phase 3 studies of maraviroc in treatment-experienced patients who had R5 virus only. Participants received an optimized background therapy and were randomly assigned (2:2:1) to receive additionally one of maraviroc once daily (MVC QD), MVC twice daily (MVC BID), or placebo. The primary endpoint was the mean change in log10-transformed levels of HIV-1 RNA from baseline to 48 weeks and has been reported elsewhere.Citation24
Secondary endpoints for both SINGLE and the MOTIVATE studies included the change from baseline in CD4+T-cell count. Pooled CD4+ cell count data from both MOTIVATE studies have been presented using LOCF for missing values.Citation25 In SINGLE, CD4+ cell count data were presented using a mixed model for repeated measures (MMRM).Citation26 Our analyses included LOCF and MMRM (though not identical to that reported previously) for a comparison with other methods.
Our analyses adjusted for covariates that were prespecified in the original analysis plans and/or that were associated with response in data exploration. We estimated CD4+ cell count response using each of the four different methods to account for missing data: an observed analysis, single imputation, MMRM, and multiple imputation (MI). For imputation-based methods, we explored the impact of different assumptions for imputing values.
We performed three single imputation analyses: one with LOCF, one with BOCF, and one with LOCF-δ. In the LOCF-δ analysis, we carried the last value forward for individuals whose data were missing due to skipped visits or administrative dropout. We assumed that other individuals with missing data – those who dropped out for reasons related to efficacy or tolerability – would see a decline in CD4+ cell count similar to that seen in randomized trials of structured treatment interruptionsCitation27–Citation29 (3 cells/mm3 per week).
Multiple imputation generates several sets of imputed data. In each dataset, an individual's sequence of missing values following withdrawal is sampled from a distribution that is based on their observed values and the statistical model chosen for imputation. The parameters of that model (for example, the average trajectory if everyone completed the study) are estimated from the observed data. Each set of imputed data are generated from a different set of model parameters, reflecting uncertainty about their true value. Then, each dataset is analyzed separately. The overall estimate is the average of the estimates obtained from each imputed dataset. The standard error (SE) for the overall estimate includes a component from the variation of the estimates between imputed datasets, which reflects uncertainty about the imputation model parameters.Citation30–Citation32
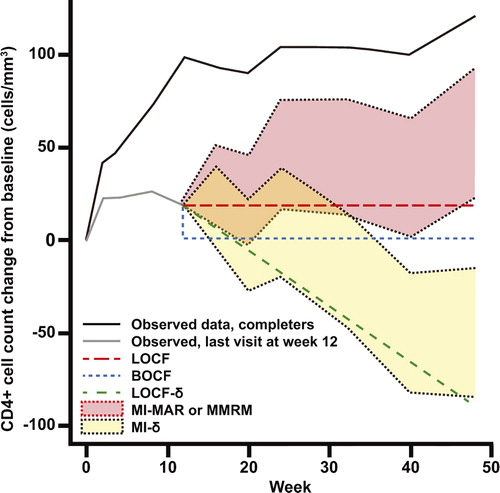
We conducted two MI analyses. The first (MI-MAR) used the same assumption that is used for MMRM models. This missing at random (MAR) assumptionCitation32 is akin to assuming that the future profile for a patient who withdraws can be extrapolated from similar study participants who remained in the trial. In the last model (MI-δ), we made the MAR assumption for individuals whose data were missing due to skipped visits or administrative dropout. For individuals who dropped out for reasons related to efficacy or tolerability in any treatment arm, we penalized MAR-based imputations at a rate of 3 cells/mm3 per week. The top line in illustrates the observed mean change from baseline in CD4+ cell count among individuals on the MOTIVATE placebo arm who stayed on study to week 48. The next line shows the mean values observed among individuals who withdrew at week 12 and compares the imputed values generated by each of the single and MI strategies. Singly imputed means are represented by a single line. The range of imputed means for MI and MMRM strategies are shown by shaded areas.
Figure 1. Illustrative representation of observed mean CD4+ cell count trajectories for two sets of individuals similar to those in the MOTIVATE placebo arm: one set with data at week 48 and one whose CD4+ cell count was last measured at week 12. Imputed means for the latter group are also shown, under each of the models used in the analysis.
Analyses were conducted using SAS 9.2 using missingdata.org.uk's macros for MI.
Results
displays the rates of and reasons for withdrawal from treatment in each study. Early discontinuation was most commonly observed on the placebo arm in MOTIVATE (68%) followed by the maraviroc arms (39% and 35%), followed by the EFV/TDF/FTC arm in SINGLE (20%) with the least dropout on the DTG+ABC/3TC arm (12%). The primary driver of early discontinuation was a lack of efficacy in MOTIVATE and adverse events (primarily for the EFV/TDF/FTC arm) in SINGLE. In MOTIVATE, participants on the placebo arm spent less time on treatment than either of the MVC arms: 33% of placebo recipients (vs 14% and 16% of MVC recipients) were exposed to treatment for less than 3 months.
Table 1. Reasons for discontinuations and duration of exposure in the week 48 analyses of the SINGLE and MOTIVATE studies
shows the impact that the choice of analysis had upon the CD4+ cell count results for each of the arms in the MOTIVATE studies. The placebo arm was most sensitive to the analysis method: its estimated CD4+ cell count recovery ranged from 16 to 121 cells/mm3. The observed analysis made the highest estimate of CD4+ cell count recovery (121 cells/mm3), suggesting a substantial survivor bias. The single imputation methods yielded smaller estimates with LOCF the most optimistic, BOCF slightly less so and LOCF-δ the most pessimistic by some margin (68, 47, and 16 cells/mm3 respectively). The MMRM and multiple imputation (MI-MAR) approach yield very similar answers (94 cells/mm3). This is expected as both have the same underlying model for missing data. The MI-δ model yielded the second lowest estimated response (40 cells/mm3).
Figure 2. CD4+ cell count data for MOTIVATE (A) adjusted CD4+ cell count mean (standard error–SE) change from baseline (CFB) at week 48 on each arm (cells/mm3) (B) estimated difference (SE) between each maraviroc arm and placebo (PBO). For the analyses at a single timepoint, covariates included in the models were treatment (MVC QD, MVC BID, and PBO), protocol (1, 2), enfuvirtide use in optimized background therapy at baseline (yes, no), baseline absolute CD4+ cell count (continuous), baseline log10 HIV-1 RNA (continuous), baseline age (continuous), gender (female, male) and overall susceptibility score of regimen (0, 1, 2, ≥ 3, missing) at baseline. For the longitudinal models, time (categorical, 10 visits) was added along with two-way interaction between time and each of the covariates and a common unstructured covariance structure was used. The bars show 95% confidence intervals.
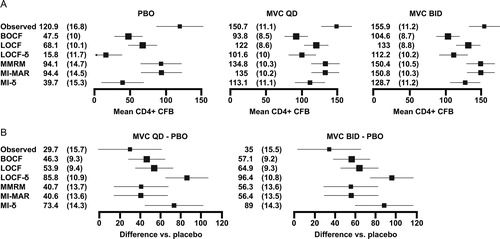
The choice of method had less impact on the maraviroc arms, which had fewer missing observations: estimated CD4+ cell count recoveries ranged from 93 to 156 cells/mm3. The ordering of methods was similar to that seen on placebo arm with only one switch: the BOCF analysis made the most pessimistic estimates of CD4+ cell count recovery (instead of MI-δ). shows why this is the case. All study recipients might expect some CD4+ cell count recovery attributable to optimized background therapy. The one-third of participants randomized to placebo who withdrew from treatment after less than 3 months had less time to recover CD4+ cell count before they discontinued. In the assumed decline models (LOCF-δ and MI-δ), the long gap between the point of dropout and week 48 also gave a participant's modeled CD4+ cell count trajectory time to drop below the baseline value. For the maraviroc arms, dropout was rarer and more delayed on average, giving more time for a CD4+ cell count recovery to take place on treatment and less time for a modeled decline to take effect.
shows the estimated treatment differences. In comparisons between MVC BID and placebo, the observed analysis showed the smallest difference in favor of MVC BID (e.g. 35 cells/mm3), followed by the statistical models that assume that individuals who dropout carry on like similar individuals who stay on study (MMRM and MI-MAR: 56 cells/mm3). The models that explicitly imputed poorer values for these individuals made larger estimates of the difference. The assumed decline models, which punished placebo for both the proportion and timing of dropout, yielded the biggest difference between the arms (MI-δ and LOCF-δ: 89 and 96 cells/mm3). This pattern was also evident for comparisons between MVC QD and placebo.
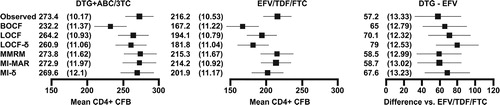
shows that estimates of CD4+ cell count recovery were less variable in SINGLE, ranging from 167 to 216 cells/mm3 on EFV/TDF/FTC and from 232 to 273 cells/mm3 on DTG+ABC/3TC. For the DTG+ABC/3TC arm, the BOCF analysis was the most conservative by some margin: all other estimates were within 13 cells/mm3. This was the result of imputing zero change for a proportion of the population when the average changes were in the range of 200–260 cells/mm3. Treatment differences ranged from 57 to 79 cells/mm3.
Figure 3. CD4+ cell count data for SINGLE: adjusted CD4+ cell count mean change (SE) from baseline at week 48 on each arm (cells/mm3) and the estimated treatment difference (SE) between DTG+ABC/3TC and EFV/TDF/FTC. For the analyses at a single timepoint, covariates included in the models were treatment (DTG+ABC/3TC, EFV/TDF/FTC), race (white, non-white), baseline HIV-1 RNA ( ≤ 100 000, >100 000 copies/ml), baseline CD4+ cell count ( ≤ 200, >200 cells/mm3) and baseline age ( < 36, ≥ 36 years). For the longitudinal models, time (categorical, eight visits) was added along with two-way interaction between time and each of the covariates and a common unstructured covariance structure was used. The bars show 95% confidence intervals.
Using statistically robust methods as opposed to single imputation made very little difference to the width of confidence intervals in SINGLE: in the LOCF analysis, confidence intervals for the treatment difference were ± 24 cells/mm3, and in the MI-δ analysis, they were ± 25 cells/mm3. For MOTIVATE, the difference was more pronounced (LOCF: ∼ ± 18 vs MI-δ ± 28 cells/mm3). Using the approximate rule of thumb that the width of confidence intervals is proportionate to the square root of the sample size, the MOTIVATE LOCF analysis had an effective sample size almost 2.5 times greater than MI-δ analysis. This increased confidence interval width for the MI-δ analysis reflects two additional sources of uncertainty that are ignored by LOCF and BOCF: correct calculation of the volume of data collected (and the uncertainty associated with imputation) and representation of the different CD4+ cell count trajectories that could be observed among individuals who dropout for different reasons.
Discussion
We observed that the importance of accounting correctly for missing data was dependent on the volume of missing data. In MOTIVATE, with 35%–68% of subjects missing values, treatment differences ranged across a 61 cells/mm3 and confidence intervals widened by almost 50% when an LOCF analysis was exchanged for a MI analysis that took full account of all sources of uncertainty. In SINGLE, with 12%–20% missing data, treatment differences ranged across a 20 cells/mm3 window and confidence intervals were not materially sensitive to the choice of analysis method.
The importance of detailed planning for missing data may be greater for studies in treatment-experienced individuals than in the treatment-naïve or early switch setting because of the greater volume of missing data and the lower CD4+ cell counts in this population. While there is no simple threshold for the acceptable percentage of missing data, our examples suggest that for analyses of CD4+ cell count data from first-line or first-line switch studies with high CD4+ cell counts and completion rates close to 90%, the interpretation of results are not sensitive to the method of handling missing data. As treatment guidelines move to earlier initiation, the proportion of treatment-naïve study participants starting with CD4+ cell counts above 350 cells/mm3 rises. With CD4+ cell count recoveries in the range of 150+ cells/mm3 in this population,Citation17–Citation21 the differences between estimates generated by different statistical techniques (e.g. ∼20 cells/mm3) are small compared to the absolute CD4+ cell counts for the majority of participants. Heavily treatment-experienced individuals often enter studies with CD4+ cell counts closer to 100 cells/mm3 and see smaller increases over the first year of treatment.Citation33,Citation34 The potential for discrepancies between analyses of a similar magnitude to that observed here (∼60 cells/mm3) for estimates of total CD4+ cell counts close to 200 cells/mm3 warrants careful analysis. Multiple imputation is such an analysis.
The added precision gained by using the correct statistical technique may not justify the added complexity in the minds of some trialists. Nevertheless, we would argue that as the methodology becomes more accessible, the cost associated with this complexity is small compared to the effort involved in conducting a study.
The post hoc analyses in this paper do not supersede the results of the protocol prespecified analyses of CD4+ cell count in the SINGLE and MOTIVATE studies, each of which found statistically significant differences (of fewer than 100 cells/mm3) in favor of the experimental arms.Citation23–Citation25 With the exception of the observed analysis of MVC QD, all analyses presented herein also showed a significant difference in favor of the experimental arm.
Studies in HIV generally seek to estimate the difference in outcome improvement in all randomized patients after (e.g.) 48 weeks that is attributable to the initially randomized treatment. This necessitates ignoring data collected on second-line or switch therapy after treatment failure, which in turn necessitates making unverifiable assumptions about what would have happened to a study participant who remained on originally randomized therapy (or ceased therapy) after the point of withdrawal from the study. Statistical models about withdrawal mechanisms should be evaluated in terms of their consistency with that estimand.
The analytic literature divides withdrawal mechanisms into three classes.Citation30,Citation32 In the simplest scenario, the model is called “missing completely at random (MCAR),” which implies that complete cases are representative of all the original cases as randomized. An example of this class would be missing viral loads caused by errors in shipping or storage and, perhaps, by intermittent skipped visits. This model does not hold for dropout in clinical trials: as seen in the MOTIVATE studies, a complete case analysis leads to substantial bias.
If neither this nor the MAR assumption described in the methods section can be made, the model is called “missing not at random (MNAR).” In this setting, withdrawers and completers differ in a way that is related to unobserved outcomes and a future profile cannot be extrapolated from similar study participants who remain in the trial. In the setting of treatment for HIV-1, in which continued treatment with failing therapy will lead to steadily worsening outcomes, completers are likely to have different CD4+ cell count trajectories than some early withdrawers, and so MNAR models (like MI-δ) are often appropriate.
How those counterfactual trajectories are imagined is dependent on the type of failure. It might be plausible to assume that the CD4+ cell count trajectories of individuals who leave a study for administrative reasons would carry on responding to treatment just like similar individuals who stayed on the study. Therefore, the MAR assumption would be reasonable (and an LOCF analysis, which assumes no further improvement, would be unduly pessimistic). For efficacy-driven dropout, it is more reasonable to assume a steady worsening in CD4+ cell count response off therapy or if the failing regimen was maintained (both LOCF and MAR are too optimistic and the analyses in MOTIVATE showed that BOCF could be optimistic or pessimistic depending on the timing of withdrawal). An assumed decline seems intuitive and has previously been applied to clinical trials in HIV.Citation2 Applying a CD4+ cell count decline to individuals who withdraw due to tolerability can be characterized as a penalty for intolerable regimens or an attempt to capture the potential for reduced adherence to therapy among the imaginary individuals who continued on randomized therapy after the point of withdrawal.
The MI-δ and the LOCF-δ analyses in this paper assumed a particular rate of decline (3 cells/mm3 per week) in CD4+ cell count for a subset of individuals who withdrew due to reasons related to efficacy and tolerability. For individuals who withdrew early from the study and/or with a low baseline CD4+ cell count, some of the so imputed CD4+ cell counts could fall outside a realistic range – in particular below zero. This can be rectified, if desired, by applying a floor below which imputed values cannot go. Other assumptions could be justified: for example a steeper CD4+ cell count decline in heavily experienced patients; or a less steep decline in naïve or less experienced patients. These assumptions should be motivated by what is being estimated with a transparent line of thought from that estimand to the clinical and statistical elements of analysis.
The hypothetical CD4+ cell count trajectories described above are systematically different for efficacy and tolerability withdrawers (compared to similar individuals who stay on study). Therefore, we believe that the most intuitive missing data mechanism in this setting is a mixture of MAR (or MCAR for administrative dropout or skipped visits) and MNAR (a gradual decline for efficacy or tolerability withdrawals).
As shown by the LOCF-δ analysis, it is not complicated to implement single imputation methods that impute different values for different types of withdrawal. However, this method still does not take into account the uncertainty associated with imputation. This overestimation of the amount of information collected in a trial can lead to inflated type I error rates, although the materiality of this impact is dependent on the volume of missing data. Multiple imputation allows transparent consideration of what happens to completers and weights partially observed CD4+ cell count trajectories appropriately and is therefore a natural analysis for clinical trials in HIV with missing data.
The NRC report “The Prevention and Treatment of Missing Data in Clinical Trials” emphasizes that the first priority is the prevention of missing data. But where data are missing, the report outlines principles for minimizing its effect on inferences: clarity about what is being estimated and which data inform that estimation; detailed documentation of the reasons for missingness; explicit and clinically accessible assumptions about the missing data mechanism that permit analysis; a statistically valid analysis conducted under those primary missing data assumptions and robust sensitivity analyses. The report repeatedly states that statistically valid methods all “rely on untestable assumptions concerning the factors leading to the missing values and how they relate to the study outcomes. Therefore, the assumptions underlying these methods need to be clearly communicated to medical experts so that they can assess their validity.”
Multiple imputation is a statistical technique that, in this manuscript, has been used to model CD4+ cell count data, that weights partially observed CD4+ cell count trajectories appropriately, and that can handle a variety of missing data assumptions transparently. This allows for explicit debate about the relevance of results to what is being estimated and their sensitivity to the assumptions being made. As recommended by the NRC, the most important step for trialists contemplating missing data is to prevent it. Thoughtful analysis can help minimize its impact, and MI is a technique that allows such analysis.
Disclaimer Statements
Contributors All authors contributed to the conception, design, analysis and interpretation of the paper. Pfizer was responsible for validating/storing the data of the MOTIVATE studies only.
Funding All work on the paper was conducted in the course of each author's employment.
Conflicts of interest
RC is an employee of ViiV Healthcare, which markets maraviroc and dolutegravir. He has shares/share options in GlaxoSmithKline (GSK), which has a majority shareholding in ViiV. CB and CG are employees of GSK and have shares/share options in MM is an employee of Shionogi & Co., Ltd. He has shares in Shionogi, which has a minority shareholding in ViiV. CW is an employee of Pfizer Inc and owns shares/share options in Pfizer, which has a minority shareholding in ViiV. JR is a consultant for GSK, has shares in GSK, and has received personal fees for consultancy, training, and attendance at internal conferences from Amgen, Boehringer Ingelheim, Novartis, and Roche.
Ethics approval SINGLE and the MOTIVATE studies received ethics approval at all participating institutions.
References
- Hollis S, Campbell F. What is meant by intention to treat analysis? Survey of published randomised controlled trials. BMJ. 1999;319(7211):670–674.
- Raboud JM, Montaner JS, Thorne A, Singer J, Schechter MT. Impact of missing data due to dropouts on estimates of the treatment effect in a randomized trial of antiretroviral therapy for HIV-infected individuals. J Acquir Immune Defic Syndr Hum Retrovirol. 1996;12(1):46–55.
- O'Neill RT, Temple R. The prevention and treatment of missing data in clinical trials: an FDA perspective on the importance of dealing with it. Clin Pharmacol Ther. 2012;91(3):550–554.
- International Conference on Harmonisation. E9: Statistical Principles for Clinical Trials (CPMP/ICH/363/96). 1998. http://www.ich.org/fileadmin/Public_Web_Site/ICH_Products/Guidelines/Efficacy/E9/Step4/E9_Guideline.pdf.
- International Conference on Harmonisation. E10: Choice of Control Group and Related Issues in Clinical Trials. 2001. http://www.ich.org/fileadmin/Public_Web_Site/ICH_Products/Guidelines/Efficacy/E10/Step4/E10_Guideline.pdf..
- The Prevention and Treatment of Missing Data in Clinical Trials. Washington, DC: The National Academies Press; 2010.
- Ware JH, Harrington D, Hunter DJ, D'Agostino RB. Missing data. N Engl J Med. 2012;367(14):1353–1354.
- Little RJ, D'Agostino R, Cohen ML, Dickersin K, Emerson SS, Farrar JT, et al. The prevention and treatment of missing data in clinical trials. N Engl J Med. 2012;367(14):1355–1360.
- Little RJ, Cohen ML, Dickersin K, Emerson SS, Farrar JT, Neaton JD, et al. The design and conduct of clinical trials to limit missing data. Stat Med. 2012;31(28):3433–3443.
- Committee for Medical Products for Human Use. Guideline on Missing Data in Confirmatory Clinical Trials (EMA/CPMP/EWP/1776/99 Rev. 1) 2010.; http://www.ema.europa.eu/docs/en_GB/document_library/Scientific_guideline/2010/09/WC500096793.pdf.
- Abraham WT, Russell DW. Missing data: a review of current methods and applications in epidemiological research. Curr Opin Psychiatry. 2004;17(4):315–321.
- Newgard CD, Haukoos JS. Advanced statistics: missing data in clinical research – part 2: multiple imputation. Acad Emerg Med. 2007;14(7):669–678.
- Hughes S, Harris J, Flack N, Cuffe RL. The statistician's role in the prevention of missing data. Pharm Stat. 2012;11(5):410–416.
- Harris J, Bomar M, Campbell M. Increasing subject compliance in pivotal phase III clinical trials of dolutegravir (DTG, S/GSK1349572) in HIV-infected, ART-naive subjects. J Int AIDS Soc. 2012;15(Suppl 4):1824
- Food and Drug Administration. Guidance for Industry: Antiretroviral Drugs Using Plasma HIV RNA Measurements – Clinical Considerations for Accelerated and Traditional Approval 2002.; http://www.fda.gov/downloads/drugs/guidancecomplianceregulatoryinformation/guidances/ucm070968.pdf..
- Food and Drug Administration. Draft Guidance for Industry: Human Immunodeficiency Virus-1 Infection: Developing Antiretroviral Drugs for Treatment 2013.; http://www.fda.gov/downloads/drugs/guidancecomplianceregulatoryinformation/guidances/ucm355128.pdf..
- Cohen CJ, Molina JM, Cahn P, Clotet B, Fourie J, Grinsztejn B, et al. Efficacy and safety of rilpivirine (TMC278) versus efavirenz at 48 weeks in treatment-naive HIV-1-infected patients: pooled results from the phase 3 double-blind randomized ECHO and THRIVE trials. J Acquir Immune Defic Syndr. 2012;60(1):33.
- DeJesus E, Rockstroh JK, Henry K, Molina JM, Gathe J, Ramanathan S, et al. Co-formulated elvitegravir, cobicistat, emtricitabine, and tenofovir disoproxil fumarate versus ritonavir-boosted atazanavir plus co-formulated emtricitabine and tenofovir disoproxil fumarate for initial treatment of HIV-1 infection: a randomised, double-blind, phase 3, non-inferiority trial. Lancet. 2012;379(9835):2429–2438.
- Sax PE, DeJesus E, Mills A, Zolopa A, Cohen C, Wohl D, et al. Co-formulated elvitegravir, cobicistat, emtricitabine, and tenofovir versus co-formulated efavirenz, emtricitabine, and tenofovir for initial treatment of HIV-1 infection: a randomised, double-blind, phase 3 trial, analysis of results after 48 weeks. Lancet. 2012;379(9835):2439–2448.
- Raffi F, Rachlis A, Stellbrink HJ, Hardy WD, Torti C, Orkin C, et al. Once-daily dolutegravir versus raltegravir in antiretroviral-naive adults with HIV-1 infection: 48 week results from the randomised, double-blind, non-inferiority SPRING-2 study. Lancet. 2013;381(9868):735–743.
- Lennox JL, DeJesus E, Lazzarin A, Pollard RB, Madruga JV, Berger DS, et al. Safety and efficacy of raltegravir-based versus efavirenz-based combination therapy in treatment-naive patients with HIV-1 infection: a multicentre, double-blind randomised controlled trial. Lancet. 2009;374(9692):796–806.
- Bell ML, Fiero M, Horton NJ, Hsu CH. Handling missing data in RCTs; a review of the top medical journals. BMC Med Res Methodol. 2014;14:118.
- Walmsley SL, Antela A, Clumeck N, Duiculescu D, Eberhard A, Gutiérrez F, et al. Dolutegravir plus abacavir-lamivudine for the treatment of HIV-1 infection. N Engl J Med. 2013;369(19):1807–1818.
- Gulick RM, Lalezari J, Goodrich J, Clumeck N, DeJesus E, Horban A, et al. Maraviroc for previously treated patients with R5 HIV-1 infection. N Engl J Med. 2008;359(14):1429–1441.
- Asmuth DM, Goodrich J, Cooper DA, Haubrich R, Rajicic N, Hirschel B, et al. CD4+T-cell restoration after 48 weeks in the maraviroc treatment-experienced trials MOTIVATE 1 and 2. J Acquir Immune Defic Syndr. 2010;54(4):394–397.
- Mallinckrodt CH, Clark WS, Carroll RJ, Molenberghs G. Assessing response profiles from incomplete longitudinal clinical trial data under regulatory considerations. J Biopharm Stat. 2003;13(2):179–190.
- DART Trial Team. Fixed duration interruptions are inferior to continuous treatment in African adults starting therapy with CD4 cell counts < 200 cells/microl. AIDS. 2008;22(2):237–247.
- Strategies for Management of Antiretroviral Therapy (SMART) Study Group, El-Sadr WM, Lundgren J, Neaton JD, Gordin F, Abrams D, et al. CD4+ count-guided interruption of antiretroviral treatment. N Engl J Med. 2006;355(22):2283–2296.
- Maggiolo F, Airoldi M, Callegaro A, Martinelli C, Dolara A, Bini T, et al. CD4 cell-guided scheduled treatment interruptions in HIV-infected patients with sustained immunologic response to HAART. AIDS. 2009;23(7):799–807.
- Little RJ, Rubin DB. Statistical Inference with Missing Data. 2nd edn. New York: Wiley; 2002.
- Hogan JW, Roy J, Korkontzelou C. Handling drop-out in longitudinal studies. Stat Med. 2004;23(9):1455–1497.
- Rubin DB. Inference and missing data. Biometrika. 1976;63(3):581–592.
- Steigbigel RT, Cooper DA, Kumar PN, Eron JE, Schechter M, Markowitz M, et al. Raltegravir with optimized background therapy for resistant HIV-1 infection. N Engl J Med. 2008;359(4):339–354.
- Katlama C, Haubrich R, Lalezari J, Lazzarin A, Madruga JV, Molina JM, et al. Efficacy and safety of etravirine in treatment-experienced, HIV-1 patients: pooled 48 week analysis of two randomized, controlled trials. AIDS. 2009;23(17):2289–2300.