
Abstract
Cross-sectional analysis on 20 HIV-1 patients with neurological symptoms admitted to two infectious disease units. Cut-off of HIV–RNA (VL) was 20 copies/ml for plasma and cerebral spinal fluid (CSF). Flow cytometry was used to analyze the phenotype of circulating and CSF T lymphocytes. CD38 mean fluorescence intensity (MFI) was higher on circulating CD4+T lymphocytes from patients with VL >20 copies/ml in plasma (P = 0.001) or CSF (P = 0.001). The frequency of circulating CD8+CD38+T cells and CD38 MFI on these cells were higher in patients with VL >20 copies/ml than in those with undetectable plasma VL (P = 0.030 and P = 0.023). The frequency of CSF CD4+CD38+T, as well as their CD38 and CD95 MFI, were increased in patients with detectable than non-detectable plasma VL (P = 0.01, P = 0.03, and P = 0.05). The % CD38+CD8+T in CSF correlated with time of virological suppression (ρ = − 0.462, P = 0.040) and the CNS penetration-effectiveness (CPE) score (ρ = − 0.467, P = 0.038). In conclusion, (a) the expression of CD38+ on both CD4+, CD8+T lymphocytes from peripheral blood and CSF discriminated between viremic and non-viremic patients and (b) T cell activation/apoptosis markers inversely correlated with CPE to remark the importance for therapy to restore immunological functions.
Keywords:
| Abbreviations | ||
| HIV–RNA | = | VL |
| CSF | = | cerebral spinal fluid |
| CNS | = | central nervous system |
| cART | = | combined antiretroviral therapy |
| HAD | = | HIV–associated dementia |
| CPE | = | CNS penetration-effectiveness |
| MFI | = | mean fluorescence intensity |
Introduction
Widespread use of combined antiretroviral therapy (cART) has reduced the neurological complications dependent on HIV infection and relative immunosuppression, including those related to central nervous system (CNS) opportunistic infections and HIV-associated dementia (HAD).Citation1,Citation2 However, neurological impairments, including mild cognitive and motor disorders, are frequently detected in patients on cART, suggesting latent persistence of injury activities by the disease against the CNS.Citation3 Pathogenesis of HIV-related neurological damage can be linked to a direct cytopathic viral action, as well as to an indirect inflammatory pathway, in part dependent on the secretion of chemokines, cytokines, and extracellular matrix-degrading enzymes, which alter neuronal and glial function.Citation4 Brain macrophages and microglia are the cell types infected by HIV-1 within the CNS, so that they are likely to mediate the neuropathology seen in patients with HAD through the induction of persistent intrathecal T cell activation.Citation5 Accordingly, Shacklett et al. (2004) 6 proposed the “push–pull” model to explain transmigration of T cells to the cerebral spinal fluid (CSF) compartment in HIV infection. Briefly, infection-dependent functional activation would provide peripheral T cells with an increased ability to cross the blood–CSF barrier (push), while, at the same time, intrathecal HIV-infection and the subsequent release of inflammatory chemokines would favor their homing to the nervous system (pull).Citation7 Indeed, achieving a detailed characterization of CSF infiltrating T cells in HIV infected patients would provide new insights on the pathogenic pathways leading to HIV-associated neurologic damages, as well as diagnostic/prognostic markers potentially useful for disease follow-up.Citation8 The relatively low number of CSF infiltrating T lymphocytes during HIV infection hampered this kind of study for a long time. Now, polychromatic flow cytometry, being able to analyze several molecules per single cell,Citation9 allows to overcome this technical limit, to the point that this approach is considered to have high analytical and diagnostic potentials in the study of inflammatory and non-inflammatory neurological disorders.Citation10,Citation11
Numerous different antigens are over-expressed on the surface of activated T-lymphocytes, including HLA-DR, CD25, CD38, CD69, and CD70. The role of CD38 expression on CD4+ and CD8+T lymphocytes as immune activation marker has been widely investigated in the context of HIV infection. Circulating CD38+CD8+T cells have been strongly correlated with disease progression in untreated HIV infected subjects.Citation12 It has been also demonstrated how CD38+ expression play a role in poor response to cART,Citation13 in early immune senescenceCitation14 and may be predictive of the extent of CD4+T-cells recovery.Citation15
In this study, polychromatic flow cytometry was used to characterize the expression of selected activation/apoptosis markers by T lymphocytes from the peripheral blood and the CSF of HIV-infected patients.
Materials and Methods
We performed a cross-sectional analysis on 20 HIV-1 infected patients (of 18 years +) with neurological symptoms consecutively admitted, between April 2011 and December 2012, to the infectious disease units of two different Hospitals in Genoa, Italy. The study was approved by the local Ethical Committee and biological samples were collected after receiving a written informed consent by the patients.
Paired heparinized peripheral blood (3 ml) and CSF (1 ml) samples were obtained from each patient. Demographics, clinical, and laboratory data, including absolute CD4+T cell count, plasma and CSF HIVRNA (VL), CNS penetration-effectiveness (CPE)Citation16 score, were recorded for all the patients. Specific tests on CSF from patients with suspected CNS infection were performed. Plasma and CSF VL, measured dosing HIV–RNA copies, were quantified using the K-PCR-HIV1 kit (Siemens Health Care, NY, USA) and the Nucleosens HIV (Bio Merieux, NC, USA) kit. A cut-off was set at 20 copies/ml so that the infection was considered viremic in patients with a viral load higher than the cut-off in either plasma or CSF.
Polychromatic flow cytometry analysis
The analyses were performed on T lymphocytes purified from fresh biological samples. The following immunological parameters were analyzed in cells from both peripheral blood and CSF compartments: CD4+ and CD8+T cells rates, the CD4/CD8 ratio, the expression on CD4+ and CD8+T subsets of immune-activation markers as CD38+ and HLA-DR+, their differentiation phenotype (naïve CD45RA+ CD28+, central memory CD45RA− CD28+, effector memory CD45RA− CD28− and terminal effector CD45RA+ CD28− ), and their expression of CD95 antigen.
Briefly, 100 μl of peripheral blood and CSF sediment were stained with the following fluorocrome conjugated monoclonal antibodies: anti-human CD3 Horizon V500 (Beckton Dickinson [BD], NJ, USA), anti-human CD8 e-Fluor 780 (eBioscience, NJ, USA), anti-human CD45RA Horizon V450 (BD), anti-human CD95 Allophycocyanin-cyanin7 (APC-Cy7) (BD), anti-human HLA-DR Alexa-488 (BD), anti-human CD38 Phycoeritrine (PE) (BD), and anti-human CCR7 Peridinin-chlorophyll protein-Cyanin 5.5 (PerCP-Cy5.5) (BD). Samples were incubated at 4°C for 30 minutes. After the incubation, 1 ml of FACS lysing solution (BD) was added to blood specimens for 5 minutes at room temperature, centrifuged at 2000 rpm for 5 minutes and washed with 1 ml of PBS solution for 5 minutes at 2000 rpm. The pellet was then resuspended in 250 μl of FACS Lysing solution (BD) and stored at 4°C. Cerebral spinal fluid specimens were washed in a PBS buffer and centrifuged at 2000 rpm for 5 minutes. Then, the cellular pellet was resuspended in 250 μl of FACS lysing solution (BD) and stored at 4°C. The samples were acquired and analyzed with a FACS Canto II (BD) flow cytometer using the FACS Diva Software (BD). Data were expressed as both percentage of positive cells and mean fluorescence intensity (MFI) of antigen expression.
Statistical analyses
The HIV–RNA plasma and CSF VL values were binarized and for both association with categorical characteristics as cART was tested by mean of Fisher's exact test; non-parametric Mann–Whitney test was used to test differences in continuous clinical characteristics comparing patients with HIV–RNA < 20 or >20 copies/ml in plasma and CSF.
Correlation between continuous clinical characteristics was calculated by mean of Spearman's rank correlation coefficient. SPSS (v.20; IBM Corp., NY, USA) was used for computation.
Results
Patient's characteristics are summarized in .
Table 1. Patient's characteristics.
All samples of CSF were colorless, crystal clear except one with turbidity; only 5 patients had >5 cells/mm3 of CSF and 14 patients had total protein >38 mg/dl.
T cell subsets in the peripheral blood
In the overall population, the median values (range) of % CD38 on CD4+T cells were 49 (19–87) and of MFI CD38 5900 (2574–17 764).
Frequency of CD4+T cells in the plasma was significantly higher (P = 0.011) in patients with plasma VL ≤ 20 copies/ml than in those with plasma VL >20 copies/ml.
We did not find any significant difference in the comparison of frequency of circulating CD4+T cells in patients with CSF VL ≤ 20 vs >20 copies/ml (P = 0.32)
Considering the expression of the CD38 antigen, comparable CD4+CD38+T cells frequencies were observed among patients with HIV–RNA in plasma ≤ 20 copies/ml and those with >20 copies/ml. However, the frequency of circulating CD4+CD38+T cells was significantly higher in patients with a CSF VL >20 copies/ml than in those with CSF VL < 20 copies/ml (P = 0.004). CD38 MFI on circulating CD4+T lymphocytes was significantly higher in patients with VL >20 copies/ml in either plasma (P = 0.001) or CSF (P = 0.001). It also negatively correlated with the CD4+T cell count at nadir, with the absolute CD4+T cell count at the moment of the sample collection (ρ = − 0.648, P = 0.002 and ρ = − 0.648, P = 0.002), and with the time of virological suppression ( ≤ 20 copies/ml plasma HIV–RNA) (ρ = − 0.603, P = 0.005). Considering another activation marker, the pro-apoptotic CD95 molecule, CD95 MFI on CD4+T cells showed a negative correlation with the CPE score in patients with plasma VL ≤ 20 copies/ml (ρ = − 0.529, P = 0.029). The analysis of naïve, CM, EF, and TEM T CD4+T cell subsets showed that the frequency of circulating naïve CD4+T lymphocytes positively correlated with both nadir CD4+T cell absolute number and the length of the time of virological suppression ( ≤ 20 copies/ml HIV–RNA).
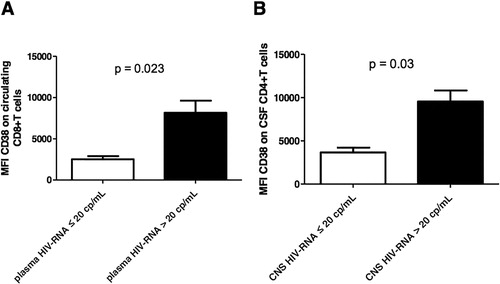
Concerning the CD8+T lymphocyte subpopulation, both the frequency of circulating CD8+CD38+T cells and CD38 MFI () on these cells were higher in patients with a VL >20 copies/ml than in those with plasma VL ≤ 20 copies/ml (P = 0.030 and P = 0.023, respectively) or CSF VL (P < 0.0001 and P = 0.002, respectively). Interestingly, the frequency of circulating CD8+CD38+T cells negatively correlated with both the time of virological suppression in plasma and the CPE score (ρ = − 0.493, P = 0.027 and ρ = − 0.607 and P = 0.005, respectively). CD95 MFI on CD8+T lymphocytes was found significantly higher in cells from patients with detectable rather than non-detectable plasma VL (P = 0.043).
Figure 1. CD38 MFI on circulating CD8+T cells (A) and on CSF CD4+T cells (B) in patients with plasma or CSF HIV-RNA ≤ 20 and >20 copies/ml. Data are expressed as range of minimum to maximum values in each group; P values of Mann–Whitney test are shown in the figures.
T cell subsets in the CSF
In the overall population, the median values (range) of % CD38 on CD4+T cells were 40 (16–83) and of CD38 MFI 5094 (1992–25 822).
Frequency of CD4+T cells in the CSF was significantly higher (P = 0.007) in patients with plasma VL ≤ 20 copies/ml than in those with plasma VL >20 copies/ml.
No significant difference of CD4+T cell frequency in CSF was found among patients with CSF VL ≤ 20 and >20 copies/ml.
The frequency among CSF cells of CD4+CD38+T lymphocytes as well as their CD38 () and CD95 MFI was increased in patients with detectable rather than non-detectable plasma VL (P = 0.01, P = 0.03, and P = 0.05, respectively) as well as in patients with detectable and non-detectable CSF VL (P = 0.01, P = 0.03, and P = 0.05, respectively). Moreover, CD38 MFI on CD4+T cells negatively correlated with the absolute CD4+T cell count at nadir (ρ = − 0.680 P = 0.001), the absolute CD4+T cells count at the time of analysis (ρ = − 0.776 P = 0.0001), and with the time of virological suppression (plasma VL ≤ 20 copies/ml) (ρ = − 0.581, P = 0.007).
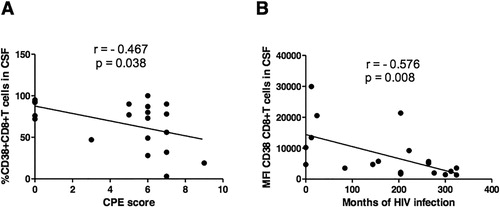
The frequency in the CSF of CD8+CD38+T lymphocytes negatively correlated with the duration of virological suppression ( ≤ 20 copies/ml plasma VL) (ρ = − 0.462, P = 0.040) and the CPE score (ρ = − 0.467, P = 0.038) (). Furthermore, CD38 MFI on CD8+T cells negatively correlated with the duration of HIV infection (estimated as the time from diagnosis) (ρ = − 0.576, P = 0.008) ()
Figure 2. Correlation between CD38 expression on CD8+T cells in the CSF and CPE score or duration of HIV infection. (A) Correlation between the frequency of CD8+CD38+T cells in the CSF and the CPE score; (B) Correlation between CD38 MFI on CD8+T cells in the CSF and duration of HIV infection (estimated as the time from diagnosis). ρ and P values of Spearman's correlation are shown in the figures.
The median values (interquartile range, IQR) of frequency of CD38 on TCD4+ cells and on TCD8+ cells in CNS in the group N = 10 patients with plasma VL >20 copies/ml and CNS VL >20 copies/ml were 60.5% (38–72) and 83.5% (74–91.5). In the group N = 3 patients with plasma VL >20 copies/ml and CNS VL ≤ 20 copies/ml the median values (IQR) of frequency of CD38 on TCD4+ cells and on TCD8+ cells in CNS were 46% (42–57.5) and 78% (67–84). The comparison with the Mann–Whitney test of % CD38 on CD4+ and CD8+T cells between these two groups is not statistically significant (P = 0.86 and P = 0.73).
Concerning HLA-DR expression, comparable frequencies of the analyzed CD4+ and CD8+T cell subsets were observed in all subgroups of patients.
The impact of other CNS infections on frequency of CD38 expression on CD4+T cells in CSF appear to be significant (P = 0.007) with higher values for patients with other CNS infections (mean: 73; range: 60–83) as compared to patients without CNS infections (mean: 38; range: 16–89). When considering into a multivariate model (with % CD38 on CD4+T as dependent variable) the other variables found to be associated with % CD38 CD4+T together with other CNS infections appeared to show that CNS infections and time of virological suppression remain significant (P = 0.025 and P = 0.014, respectively). The impact of N = 4 patients with other CNS infections on frequency of CD38 expression on CD8+T in blood appear to be significant (P = 0.013) with higher values for the group with CNS infections (mean: 85; range: 72–97) as compared to those without CNS infections (47; range: 5–96).
Considering the frequency of CD38 expression on CD4+T cells in blood significant differences according to other CNS infections were highlighted (P = 0.003). After a multivariate model only other CNS infections (P = 0.049) and viral load on CSF (P = 0.035) remained significant.
Discussion
The main results of this study show that (a) detectable HIV–RNA in the CSF was only present in patients with detectable HIV–RNA in plasma, but not vice versa; (b) the increased expression of the CD38 molecule on both CD4+ and CD8+T lymphocytes from either the peripheral blood or the CSF discriminated between patients with VL ≤ 20 or >20 copies/ml. Neurological impairments represent frequent and warning manifestations of HIV disease. They may be due to both the neurotrophism of HIV,Citation17 which is able to cause direct cytopatic effects,Citation18 and to intratechal inflammatory processes dependent on HIVCitation19 or concomitant infections.Citation20 HIV-related neuropathy dependent on the direct HIV localization in the CNS is associated with detectable HIV–RNA in the CSF. If the presence of the CSF VL is linked with specific immunological alterations discriminating between patients with detectable and non-detectable CSF VL is unknown. Hence, this study was aimed at analyzing a panel of markers of immune activation in patients with or without detectable HIV–RNA in the CSF, searching for discriminating markers of CSF HIV localization.
From the clinical point of view, it seems of interest the observation that half of the selected cohort of HIV-infected patients showed HIV–RNA in the CSF. This supports the concept that transmission of HIV infection to the CNS is a frequent event during disease progression: accordingly, in our cohort opportunistic infections, due to Cryptococcus neoformans and Toxoplasma gondii, affected only patients with detectable CSF VL. Indeed, patients with detectable VL in the CSF showed different features than patients with non-detectable CSF VL (lower CD4+T cells counts and nadir CD4+T cells count). Interestingly, no CSF VL was present in patients with VL ≤ 20 copies/ml in the peripheral blood, suggesting that likely CNS is not the only potential sanctuary for HIV in the majority of patients, since HIV spreading to the CNS is only detectable when active replication is occurring in the periphery. What the predisposing factors are those that allow this spreading are substantially unknown. It is likely that immunological alterations might be at play. Hypotheses can be made thinking that a more pronounced immunological “scar,”Citation21 originating from a wide deletion of CD4+T cell clonotypes by HIV direct cytopatic effects, could lead to a reduced capacity by the immune system to control virus spreading, reminiscent of what occurs in patients with primitive immunodeficiency.Citation22 Analyses on the repertoire of CD4+T cell clonotypes in patients with and without detectable CSF VL will be needed to verify this hypothesis. However, if it is correct, immunological changes should be apparent between patients with detectable and non-detectable CSF VL. Indeed, our analysis demonstrates that the expression of the CD38 antigen is a potential marker that allows distinction between the two subgroups of patients. In fact, it was highly expressed on the cell surface of CD4+ and CD8+T lymphocytes in patients with detectable CSF VL, and the percentage of CD4+CD38+ or CD8+CD38+T lymphocytes significantly increased in these patients (both in the peripheral blood and in the CSF) with respect to patients without CSF VL. Hence, finding of elevated percentages of circulating CD38+T cells should evoke the suspicion in clinicians concerning the dissemination to the nervous system of HIV infection. Based on these considerations, the analysis of the frequency of circulating CD38+T lymphocytes might be a complementary tool to be included in the panel of laboratory tests used for monitoring HIV disease trend. CD38 is considered as an activation marker for T lymphocytes.Citation23–Citation25 In fact, it has been found elevated after T cell stimulation in conditions characterized by opportunistic infectionsCitation26 and several reports were found to be strongly predictive of rapid progression to AIDS and death.Citation27–Citation29 Indeed, in our series, its increased expression inversely correlated with parameters assessing inefficient control of HIV infection, such as the CD4+T cell count at nadir and the time of virological suppression. This supports the hypothesis that T lymphocytes try to compensate for the deletion of a wide array of T cell clonotypes in their repertoire through an increased functional attitude. Accordingly, the establishment of an effective cART leads to the partial recovery of T cell clonotypes in their repertoireCitation30 but, at the same time, does not normalize the expression of activation markers including CD38.Citation31 Moreover, there is wide consensus that adequate drug levels must be present both in the blood and the CSF in order for the HAART to be fully effective.Citation32 Our data show that different T cell activation/apoptosis markers (including CD38 and CD95 expression) inversely correlated with CPE, mark the importance for the establishment of adequate therapeutic regimens to restore homeostatic immunological functions.
Acknowledgments
This work was supported in part by a grant from Compagnia di San Paolo entitled “Immunoterapia anti-tumorale: analisi d'efficacia dei principali protocolli tradizionali d'immunizzazione e validazione dell'efficacia terapeutica dell'inibizione dell'interleuchina 10 nel trattamento del melanoma” and in part by a PRIN grant from MIUR entitled “Immunoterapia anti-tumorale operata attraverso l'inibizione dei circuiti regolatori citochino-dipendenti.”
Disclaimer Statements
Contributors
CD, DF, GF, and ADB designed and performed research, analyzed, interpreted data, and wrote the manuscript; DF, AP, FK, and FB performed immunological analysis, AS performed statistical analysis, DC, ADB, ES, GC, RP, and MF provided blood samples of HIV infected patients and collected data, BB performed virological analysis, FD, GF, ADB, and CV performed research.
Funding
This work was supported in part by a grant from Compagnia San Paolo and in part by a PRIN grant from MIUR.
Conflicts of interest
The authors declare that they have no conflict of interest.
Ethics approval
All patients or legal rappresented signed a written consent form before starting study procedures. The study was approved by the local Ethical Committee (N 10/2011). All lumbar punctures are performed for the study of patients with suspected infection of the central nervous system.
References
- Mocroft A, Ledergerber B, Katlama C, Kirk O, Reiss P, d'Arminio Monforte A, et al. Decline in the AIDS and death rates in the EuroSIDA study: an observational study. Lancet. 2003;362:22–29.
- D'Arminio Monforte A, Cinque P, Mocroft A, Goebel FD, Antunes F, Katlama, et al. Changing incidence of central nervous system diseases in the EuroSIDA cohort. Ann Neurol. 2004;55:320–328.
- McArthur JC. HIV dementia: an evolving disease. J Neuroimmunol. 2004;157:3–10.
- Kaul M, Stuart A. Lipton: mechanisms of neuroimmunity and neurodegeneration associated with HIV-1 infection and AIDS. J Neuroimmune Pharmacol. 2006;1:138–151.
- González-Scarano F, Martín-García J. The neuropathogenesis of AIDS. Nat Rev Immunol. 2005;5(1):69–81.
- Shacklett BL, Cox CA, Wilkens DT, Karl Karlsson R, Nilsson A, Nixon DF, et al. Increased adhesion molecule and chemokine receptor expression on CD8+T cells trafficking to cerebrospinal fluid in HIV-1 infection. J Infect Dis. 2004;189(12):2202–2212.
- Gisslen M, Hagberg L, Rosengren L, Brew BJ, Cinque P, Spudich S, et al. Defining and evaluating HIV-related neurodegenerative disease and its treatment targets: a combinatorial approach to use of cerebrospinal fluid molecular biomarkers. J Neuroimmune Pharmacol. 2007;2:112–119.
- Sinclair E, Ronquillo R, Lollo N, Deeks SG, Hunt P, Yiannoutsos CT, et al. Antiretroviral treatment effect on immune activation reduces cerebrospinal fluid HIV-1 infection. J Acquir Immune Defic Syndr. 2008;47(5):544–552.
- Ho EL, Ronquillo R, Altmeppen H, Spudich SS, Price RW, Sinclair E. Cellular composition of cerebrospinal fluid in HIV-1 infected and uninfected subjects. PLoS One. 2013;8(6):e66188.
- Maxeiner HG, Rojewski MT, Schmitt A, Tumani H, Bechter K, Schmitt M. Flow cytometric analysis of T cell subsets in paired samples of cerebrospinal fluid and peripheral blood from patients with neurological and psychiatric disorders. Brain Behav Immun. 2009;23(1):134–134.
- Kowarik MC, Grummel V, Wemlinger S, Buck D, Weber MS, Berthele A, et al. Immune cell subtyping in the cerebrospinal fluid of patients with neurological diseases. J Neurol. 2014;261(1):130–143.
- Giorgi JV, Lyles RH, Matud JL, Yamashita TE, Mellors JW, Hultin LE, et al. Multicenter AIDS cohort study: predictive value of immunologic and virologic markers after long or short duration of HIV-1 infection. J Acquir Immune Defic Syndr. 2002;29(4):346–355.
- Vigano A, Saresella M, Villa ML, Ferrante P, Clerici M. CD38+CD8+T cells as a marker of poor response to therapy in HIV-infected individuals. Chem Immunol. 2000;75:207–217.
- Desai S, Landay A. Early immune senescence in HIV disease. Curr HIV/AIDS Rep. 2010;7(1):4–10.
- Goicoechea M, Smith DM, Liu L, May S, Tenorio AR, Ignacio CC. Determinants of CD4+T cell recovery during suppressive antiretroviral therapy: association of immune activation. T cell maturation markers, and cellular HIV-1 DNA. J Infect Dis. 2006;194:29–37.
- Letendre S, Marquie-Beck J, Capparelli E, Best B, Clifford D, Collier AC, et al. Validation of the CNS penetration-effectiveness rank for quantifying antiretroviral penetration into the central nervous system. Arch Neurol. 2008;65(1):65–70.
- Dunfee R, Thomas ER, Gorry PR, Wang J, Ancuta P, Gabuzda D. Mechanisms of HIV-1 neurotropism. Curr HIV Res. 2006;4(3):267–278.
- Olivares I, Sánchez-Jiménez C, Vieira CR, Toledano V, Gutiérrez-Rivas M, López-Galíndez C. Evidence of ongoing replication in a human immunodeficiency virus type 1 persistently infected cell line. J Gen Virol. 2013;94(Pt 5):944–954.
- Peluso MJ, Meyerhoff DJ, Price RW, Peterson J, Lee E, Young AC, et al. Cerebrospinal fluid and neuroimaging biomarker abnormalities suggest early neurological injury in a subset of individuals during primary HIV infection. J Infect Dis. 2013;207(11):1703–1712.
- Xiao J, Gao G, Li Y, Zhang W, Tian Y, Huang Y, et al. Spectrums of opportunistic infections and malignancies in HIV-infected patients in tertiary care hospital, China. Plos One. 2013;8(10):e75915.
- Mullen KM, Gocke AR, Allie R, Ntranos A, Grishkan P IV, ardo C, et al. Expression of CCR7 and CD45RA in CD4+ and CD8+ subsets in cerebrospinal fluid of 134 patients with inflammatory and non-inflammatory neurological diseases. J Neuroimmunol. 2012;249(1-2):86–92.
- Dotta L, Badolato R. Primary immunodeficiencies appearing as combined lymphopenia, neutropenia, and monocytopenia. Immunol Lett. 2014;161(2):222–225.
- Hunt PW, Hatano H, Sinclair E, Lee TH, Busch MP, Martin JN, et al. HIV-specific CD4+T cells may contribute to viral persistence in HIV controllers. Clin Infect Dis. 2011;52(5):681–687.
- Lok JJ, Hunt PW, Collier AC, Benson CA, Witt MD, Luque AE, et al. The impact of age on the prognostic capacity of CD8+T-cell activation during suppressive antiretroviral therapy. AIDS. 2013;27(13):2101–2110.
- Taiwo B, Hunt PW, Gandhi RT, Ellingson A, McKenna M, Jacobson JM, et al. CD8+T-cell activation in HIV-1-infected patients experiencing transient low-level viremia during antiretroviral therapy. J Acquir Immune Defic Syndr. 2013;63(1):101–104.
- Gottlieb MS, Schroff R, Schanker HM, Weisman JD, Fan PT, Wolf RA, et al. Pneumocystis carinii pneumonia and mucosal candidiasis in previously healthy homosexual men: evidence of a new acquired cellular immunodeficiency. N Engl J Med. 1981;305(24):1425–1431.
- Fahey JL, Taylor JM, Manna B, Nishanian P, Aziz N, Giorgi JV, et al. Prognostic significance of plasma markers of immune activation, HIV viral load and CD4 T-cell measurements. AIDS. 1998;12(13):1581–1590.
- Liu Z, Cumberland WG, Hultin LE, Prince HE, Detels R, Giorgi JV. Elevated CD38 antigen expression on CD8+T cells is a stronger marker for the risk of chronic HIV disease progression to AIDS and death in the Multicenter AIDS Cohort Study than CD4+ cell count, soluble immune activation markers, or combinations of HLA-DR and CD38 expression. J Acquir Immune Defic Syndr Hum Retrovirol. 1997;16(2):83–92.
- Deeks SG, Kitchen CM, Liu L, Guo H, Gascon R, Narváez AB, et al. Immune activation set point during early HIV infection predicts subsequent CD4+T-cell changes independent of viral load. Blood. 2004;104(4):942–947.
- Conrad JA, Ramalingam RK, Duncan CB, Smith RM, Wei J, Barnett L, et al. Antiretroviral therapy reduces the magnitude and T cell receptor repertoire diversity of HIV-specific T cell responses without changing T cell clonotype dominance. J Virol. 2012;86(8):4213–4221.
- Hunt PW. HIV and inflammation: mechanisms and consequences. Curr HIV/AIDS Rep. 2012;9(2):139–147.
- Letendre S. Central nervous system complications in HIV disease: HIV-associated neurocognitive disorder. Neurocognitive Disord HIV. 2011;19(4):137–142.