Abstract
Background: Research has shown that the classical Stegomyia indices (or “larval indices”) of the dengue vector Aedes aegypti reflect the absence or presence of the vector but do not provide accurate measures of adult mosquito density. In contrast, pupal indices as collected in pupal productivity surveys are a much better proxy indicator for adult vector abundance. However, it is unknown when it is most optimal to conduct pupal productivity surveys, in the wet or in the dry season or in both, to inform control services about the most productive water container types and if this pattern varies among different ecological settings.
Methods: A multi-country study in randomly selected twelve to twenty urban and peri-urban neighborhoods (“clusters”) of six Asian countries, in which all water holding containers were examined for larvae and pupae of Aedes aegypti during the dry season and the wet season and their productivity was characterized by water container types. In addition, meteorological data and information on reported dengue cases were collected.
Findings: The study reconfirmed the association between rainfall and dengue cases (“dengue season”) and underlined the importance of determining through pupal productivity surveys the “most productive containers types”, responsible for the majority (>70%) of adult dengue vectors. The variety of productive container types was greater during the wet than during the dry season, but included practically all container types productive in the dry season. Container types producing pupae were usually different from those infested by larvae indicating that containers with larval infestations do not necessarily foster pupal development and thus the production of adult Aedes mosquitoes.
Conclusion: Pupal productivity surveys conducted during the wet season will identify almost all of the most productive container types for both the dry and wet seasons and will therefore facilitate cost-effective targeted interventions.
Introduction
Dengue is the fastest re-emerging arboviral disease worldwide imposing a heavy economic and health burden on affected individuals, their families and thereby the health system as a whole.Citation1–Citation3 In the absence of a specific drug for treatment and an effective vaccine available for public health use, vector control measures to reduce mosquito densities and proper case management to minimize case fatalityCitation4 are the presently available best strategic options. However, large dengue outbreaks continue to occur annually with the disease extending to new geographical areas.Citation1 Nathan et al. (2006)Citation5 have stated that routine interventions against the immature stages of the vector often have little effect,Citation2 while vertical interventions are often short lived.Citation1 Therefore, it is appropriate at this juncture, to study whether the targeted management of the most mosquito-productive containers is more effective than mass efforts to eliminate all potential breeding places in different socio-ecological settings.
A number of practical dengue vector control tools and approaches, often suitable for specific container types, are now available including targeted interventions in the container types producing more than 70% of Aedes pupae,Citation4 biological control measuresCitation4,Citation6 and some conventional as well as innovative insecticidal applications.Citation4,Citation7,Citation8,Citation32 These are sometimes most effectively deployed within integrated community-based vector management efforts,Citation9 and efficacy can often be optimized by targeting the most productive container types.Citation10,Citation11 This approach can only be implemented after identifying productive container types through the calculation of pupal indices (e.g. PPI, Pupae per Person Index), which are determined by the data collected in pupal productivity surveys.Citation12 The application of subsequent control strategies should be based on the knowledge of site-specific contextual factors related to the ecosystemCitation14 and the social and political settingCitation15,Citation16 including municipal and governmental services, in addition to knowledge on local vector ecology. Such integrated efforts have been labeled the ‘eco-health approach’ to dengue vector controlCitation15 and fit into an integrated vector management (IVM) framework.Citation9,Citation17
The present study is part of a multi-site research programme in six Asian countries which aimed at elucidating contextual factors related to dengue vector abundance in a comprehensive way and then to design and implement site-specific interventions. The programme was guided by a conceptual framework which included ecological, biological (entomological) and social (‘eco-bio-social’) determinants of vector density as key factors for dengue transmission (see details of the comparative situation analysis in Arunachalam et al. 2010).Citation18
The primary objective of this study was to analyze vector breeding patterns in six different country settings, particularly their preference for specific container types during the dry and wet season, in order to re-assess the concept of “productive containers” (as opposed to simply larval infestation) for vector control purposes and to identify the optimal timing for determining Aedes production. In this paper, we report on findings from the situation assessment, particularly variables related to dengue pupal vector abundance in the dry and in the wet season, in order to provide data on the seasonal variation of habitats of the immature stages and the optimal timing for conducting pupal productivity surveys. The total number of Aedes pupaeCitation11 encountered in a neighborhood (or study cluster) is used as a proxy indicator for adult dengue vector density, as roughly 80% of pupae develop to adult mosquitoes;Citation12 the “Pupae per Person Index” (PPI) is used as an indicator for the ratio between vector abundance and human population to assess dengue transmission risk.
Study Sites and Methods
1. Study sites and timeline
presents a synopsis of the six study sites in Asia including larger cities in India (Chennai), Indonesia (Yogyakarta), Myanmar (Yangon) and the Philippines (Mutinlupa City) as well as middle-sized provincial towns and their surrounding peri-urban areas in Sri Lanka (Gampaha district) and Thailand (Chachoengsao Province). The generally middle class study neighborhoods included mainly well-developed urban areas with good to acceptable public services (electricity, regular piped water supply, waste disposal through public services, paved streets) with some exceptions in Myanmar (water mainly from wells); Sri Lankan (waste collection in a minority of study neighborhoods) and Philippines (large proportion of lower-class residents). The field studies were conducted from mid-2007 to mid-2008 and the data were analyzed from 2009 to 2011.
Table 1. Short description of study areas
2. Sampling approach
All study sites followed a joint protocol of using 20 (India, Myanmar, Sri Lanka) or 12 clusters (Indonesia, Philippines, Thailand) for conducting the household surveys, cluster background surveys and entomological surveys (see below). A cluster was defined as a neighborhood of around 100 houses with public (non-residential) areas between or around the houses.
Sample size
The sample size was calculated based on the intervention studies expected for Phase II of this research program. It was based on a post-intervention cross-sectional testing of pupae per person between the intervention and control clusters using a two-level hierarchical model with clustering at study cluster level. Sample size reflected a desired significance level of 5% and a power of 80%. Further, mean levels of pupae per person in control and intervention areas were assumed to be 3·0 and 0·3, respectively, based on previous studies.Citation19 For a negative binomial distribution with a dispersion coefficient of 0·02 and an intra-cluster coefficient of 0·05 the required number of clusters was 8·9 per study arm when sampling 100 households per cluster. The sampling was then increased to 10 clusters per arm per site, for a total of 20 clusters per site in 3 countries and (for operational reasons) kept at 6 clusters per arm in 3 countries. The assumption of a negative binomial distribution was aimed to account for potential over-dispersion of data, i.e. if obtaining a large number of zero counts in combination with some extremely high counts, which sometimes occurs in these kinds of studies.
Grid sampling of study clusters
The selection of study clusters was based on the methodology describes by Troyo et al..Citation13 A map of each study site was generated using Google Earth software (Google Inc., Mountain View, CA, United States of America). A grid with 200 squares was overlaid on the map, and the squares were numbered. 20 squares were randomly selected using a simple random number generator, with the exception of the sites in Indonesia, Philippines and Thailand where, due to operational difficulties, only 12 squares were selected.
Definition of clusters within squares
In each of the selected squares, the left lower corner was identified on the map and the exact location was determined using a GPS and its physical location was found in the actual city. Starting from this point, the closest crossing of two streets was identified, one street representing the vertical line of the square in the map and the other the horizontal line of the square. Then, the researchers went roughly 100 meters along the horizontal street, turned left and looked into the ‘vertical’ direction and identified a street that was parallel to the first horizontal street, obtaining a U-shaped form. In order to close the U to define the cluster area, the researcher looked for 100 premises (houses, flats, small business units) within the U shaped area. After arriving at a total of 100, the U was closed providing the final border of the cluster. A simple map was drawn for orientation. If the square fell over a football ground or large park or any open public space, then the next closest corner of two crossing streets was used to construct the U. All premises as well as public and private open spaces were included in the cluster analysis.
3. Surveys
Household survey
For characterizing the study population and assessing knowledge, attitudes and practices related to dengue vector control, a household survey was conducted during the wet season in all study sites by trained field workers, using the same questionnaire.Citation18
Entomological survey
Surveys to assess container infestations with immature mosquito stages were conducted during the dry and the wet season according to standard operating proceduresCitation20 by two-to-six university or full-time vector control staff who were re-trained in the survey procedures and use of the common data collection instrument. Household areas including intra-domestic and peri-domestic spaces as well as public (non-household) spaces in each cluster were inspected. Only containers with water (“wet containers”) were examined. The containers were classified according to type, source of water, volume, location, presence of vegetation, presence of larval control measures and presence of a proper/suitable cover. For larvae, the surveyor determined the presence or absence of Aedes larvae in each container. For pupae, the surveyor counted all the pupae present in each container. A 10% sample was taken back to the laboratory for species confirmation. In some sites where large water containers (Myanmar) or wells (Indonesia and less in India) were encountered, the sweeping methodCitation20,Citation21 or the funnel technique was employed.Citation12,Citation22 In the Philippines, a correction factor was applied in large water containers (>200L) for improving the estimate of total pupal counts.Citation23 During the dry and wet season a sample of pupae from different container types was examined in the laboratory and left to develop into adults. The adults were then identified by species and sex. Between 90% to 100% of samples were Ae. aegypti with a small number of Aedes albopictus in Sri Lanka, Philippines and Thailand. As such, in this paper we will report all larvae and pupae encountered as immature stages of dengue vectors.
4. Data management and analysis
All data were double checked by field supervisors before entry into the database. Double entry for quality assurance was done by trained data entry personnel. All data files were checked and cleaned by data entry supervisors. EpiData 2·0 (http://www.epidata.dk) was used as the data entry and management software since it is equipped with range check and skip check, as well as data export capability. The data files from all study sites were merged and analyzed jointly in the data management centre at Gothenburg, Sweden. Analyses regarding factors associated with pupal production were performed for different units of analysis: container (pupae counts, pupae/larvae positivity), household (pupae counts) and study cluster (pupae per person, house index, Breteau index, pupae per hectare). For container-level analysis, clustering of observations at study cluster level was assumed and two-level hierarchical models were used for estimation. Count data were analyzed using negative binomial regression. Covariates were included in the regression models based on assumed dependencies. STATA version 11.1 was used in the analysis.
5. Meteorological data and information on reported dengue cases
Monthly averages of temperature and relative humidity were collected from local meteorological stations for the five years preceding the study (in order to identify general patterns). Information about reported dengue cases was obtained from the passive surveillance system of Ministries of Health for the same period.
Results
Study populations
In the six study sites a total of 9,391 households with 42,361 inhabitants were visited and interviewed (). Across all sites, interviewees were mostly (88·9%) older than 25 years of age and to a large extent (65·7%) females. The number of people per household varied from 5·2 persons per household in Yangon (Myanmar) and 4·9 in Mutinlupa City (Philippines) to fewer in the peri-urban study site in Thailand with 3·4 persons per household.
Table 2. Overview of container infestation measures in the wet and dry seasons (Standard Deviation in brackets)
Rainfall and vector abundance
The relationship between average monthly rainfall and reported dengue cases is illustrated in confirming the popular wisdom of a ‘dengue season’ in each site; only the Gampaha district in Sri Lanka had a bimodal rainfall pattern with dengue transmission at high levels year-round. Weekly or monthly temperature was not included in our analysis.
Figure 1. The association of rainfall and reported dengue cases over 5 years in the 6 study sites.
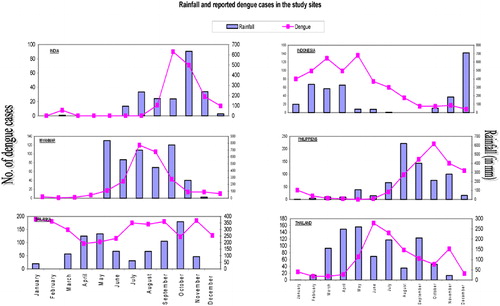
Vector ecology with a focus on immature stages
We analyzed, using pupal-demographic surveys (see methods) which of the water containers in the different study sites, both in the domestic environment and in public spaces, were the most frequent Aedes breeding places in the dry and the rainy seasons; and which were the most productive for pupal development (). The specific findings are detailed in the following sections.
Water containers and vector breeding in the dry and wet season
There was on average an increase of water holding containers from the dry to the wet season of 8·8% (from 477 to 519 containers per study cluster; ). Such an increase happened across all sites with the exception of the Philippines where people stored more water during the dry season. summarizes the three most frequently infested container types (with any immature stage) in each country per season. With the exception of India, where the most frequently infested container types in the dry and wet season were completely different.
Figure 2. Stegomyia index (CI): The 3 most frequently positive container types for any immature Aedes stage (% containers with larval and/or pupal infestation; Code of container type at the bottom of each column). Container codes: 2 cement tank; 5 metal pot; 6 earthern (clay) pots; 7 ceramic jar; 8 bowl; 9 flower vase; 10. tire; 12 discarded containers (tins, bottles etc); 13 natural containers (coco nut shells, plant axilli etc.); 15 bucket; 17 spiritual flower bowl; 18 grinding stone.
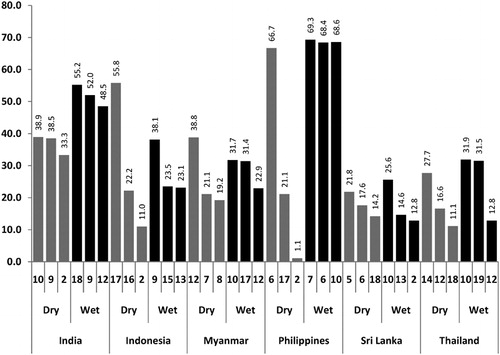
All Stegomyia indices increased considerably in the wet season: The Container Index (CI = % of all water holding containers infested by Aedes larvae or pupae) increased by 78·3% (from 4·6 to 8·2), the Breteau Index (BI = # containers infested per 100 houses) increased by 71·0% (from 22·4 to 38·3) and the House Index (HI = % of houses with ≧1 infested containers) increased by 56·3% (from 15·1 to 23·6). Likewise, the pupal production increased from the dry to the wet season by 31·2% (from 86 pupae per cluster to 130), while the pupae per person index PPI = # pupae per number of people) increased by 62·3% (from 0·162 pupae per person to 0·263). This increase in entomological indices in the wet season was observed across all sites even in the Philippines where they were storing water during the dry season (). The most productive container types (with close to or above 70% of total pupal production) are presented in .
Table 3. The most productive container types in the dry and wet season (private and public spaces combined) and how best to identify them
Regression analysis of pupal production at the household level showed that the factors associated with increased pupal production were the same in the dry and wet seasons: outdoor water containers, uncovered or partially covered, beneath shrubbery and not used for seven days or more ().
Table 4. Container characteristics significantly associateda with the number of pupae per container identified in the multi-variate analysis of risk factors for dengue vector breeding during wet and dry season in private premises (outdoor and indoor)
Pupal productivity
The analysis of productive container types is presented in and . The container types most frequently infested by any immature stages () were different from the most productive container types (i.e. those which produce together more than 70% of all pupae) as shown in . For example, the container types most frequently infested (with all immature stages) in the dry season in India were containers 10, 9 and 12 (tires, flower vases and discarded containers) and the three most productive container types in the dry season were 1, 2 and 12 (drums, cement tanks and discarded containers). Similar trends can be observed in all study sites. shows how many productive container types would be missed if container types most frequently infested with all immature stages were used as proxies for pupal (and finally adult) densities. In Myanmar in the dry season, two out of three productive container types (for Aedes pupae) would be missed by conducting larval surveys alone. In Thailand, the Philippines and Sri Lanka, none of the productive container types for pupae would be identified by larval surveys.
Figure 3. The containers producing the most pupae (% contribution to the total number of pupae; code of container type at the bottom of each column); Container codes: 1 drum/barrel; 2 cement tank; 3 ceramic/earthen jar; 4 bucket; 7 ceramic jar; 8 bowl; 9 flower vase; 10 tyre; 11 coconut shell; 12 discarded containers (tins, bottles etc); 17 spiritual flower bowl; 18 grinding stone.
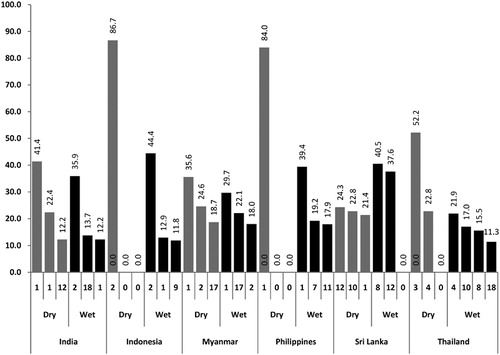
Key productive container types during the dry and wet season
In two sites, only one container type produced a large proportion of pupae (86·7% in Indonesia and 84·0% in the Philippines) during the dry season; in Thailand two key container types produced 75·0% of pupae but in the other three sites, three key container types together were the most productive during the dry season. In the wet season the number of key productive container types increased: four sites had three key containers, each producing more than 70% of pupae, and India had four key container types. Only in Sri Lanka did the number of key productive container types decrease from three in the dry season to two in the wet season.
Optimal timing for determining key containers for Aedes production
When conducting the pupal productivity survey during the dry season, a variety of productive containers which appeared during the wet season were missed (). One key productive container type was missed in both India and Sri Lanka, two in Indonesia and Philippines and three in Thailand. Only in Myanmar the key container types remained the same in both seasons. In contrast, when doing the pupal productivity survey during the wet season, almost no key productive container types appearing in the dry season were missed in sites with higher pupal production (Myanmar, Indonesia, Philippines, India). In the sites with lower pupal production (Sri Lanka and Thailand), one productive container type in each would have been missed if the productivity survey had only occurred during the wet season.
Disscussion
Although there were risk factors for vector breeding present both during the wet and dry season across study sites, social and environmental factors and vector control measures determined the variation of dengue vector breeding in the dry and wet season. In our study sites with mainly middle class neighborhoods and good-to-reasonable access to public services (), there were limited breeding opportunities for Aedes mosquitoes, which explains the relatively low entomological indices (). But also the large variation of productive container types (from grinding stones to large cement tanks) illustrates the social and environmental differences among our study areas. Additionally, the differences between the dry and wet seasons were striking. While increased rainfall, humidity and temperature favor vector breeding in the wet season,Citation24–Citation26 water storage may be enhanced in the dry season (as in the case of the Philippines in the present study). Nevertheless, pupal productivity was higher during the wet season, probably because our data demonstrated that the vectors preferred outdoor containers in shady places, filled with rainwater and that were rarely changed.
This study highlights the importance of determining ‘key productive container types’ which are responsible for the development of the majority of dengue vectors to their adult stage, as these were clearly different from containers infested with all Aedes immatures (represented by the classical Stegomyia indices). This distinction has been demonstrated previously in other parts of the world.Citation12,Citation13,Citation27–Citation31 The relationship between adult Aedes densities and pupal counts has been demonstrated by Focks and others.Citation11,Citation12,Citation30 Linked to this is the concept of “targeted interventions,” whereby only the most pupal productive container types are targeted in vector control interventions, to maximize the effect on the potential adult vector population. This approach has been shown to be more cost-effective than routine measures which try to manage or treat all container habitats without targeting any specific container type.Citation10 The findings of this study suggest that pupal productivity surveys would be best conducted during the wet season, given that the key container types identified during that survey included nearly all of those that were also of importance during the dry season. Pupal productivity surveys provide a vector surveillance tool for decision making for which container types to focus interventions and thus which kind of vector management to use, as this can depend on the container type.Citation6,Citation11,Citation33 The calculation of pupal indices can also reflect dengue transmission risk. As an example: taking the overall PPI of 0·263 (average during the wet season, ) in the average household with 4·5 inhabitants, there would be an average of 1·18 vectors per house (i.e., 0·263*4·5) or 0·59 female vectors. Considering the multiple biting habits of Aedes species and the dengue transmission threshold as calculated by Focks et al. (2000),Citation33 the risk of dengue transmission is considerable particularly if the ambient air temperature is high (shortening the extrinsic incubation period) and herd immunity is moderate or low.
The traditional Stegomyia indices, which were widely applied during the Ae. aegypti eradication campaign in the Americas, are poor proxies for adult abundance but indicate the presence or absence of vectorsCitation5 and continue to serve for vector surveillance. Our study was able to address one of the practical questions often asked by dengue vector control services: What is the optimal timing for pupal productivity surveys to get representative information on the key productive container types? The study showed that doing the survey during the dry season would miss a number of productive containers during the wet season, but not the other way around; pupal productivity surveys during the wet season identified almost all productive container types relevant in both the dry and wet seasons. The different types of targeted interventions to be employed are explored inCitation10 and will be further detailed in this special issue.
The Special Programme for Research and Training in Tropical Diseases (TDR) at the World Health Organization, in collaboration with its Regional Offices for South-East Asia (SEARO) and the Western Pacific (WPRO) formed a partnership with the Ecosystem and Human Health Program of the International Development Research Centre (IDRC) of Canada to develop the research program described in this paper. (IDRC grant No 102741-001). We thank our field staff, institutional colleagues – particularly Dr. W Tun Lin in Myanmar - and household members for their collaboration in this study and former WHO staff, Dr. Michael Nathan, as well as Dr. Dana Focks, Gainesville, for valuable comments on the draft manuscript.
References
- Suaya JA, Shepard DS, Siqueira JB, Martelli CT, Lum LC, Tan LH, et al.. (2009) Cost of Dengue cases in eight countries in the Americas and Asia: A prospective study. Am J Trop Med Hyg. 80(5):846–55.
- Garg P, Nagpal J, Khairnar P, Seneviratne SL. (2008). Economic Burden of dengue infections in India. Trans R Soc Trop Med Hyg. 102(6):570–7.
- Beatty ME, Beutels P, Meltzer MI, Shepard DS, Hombach J, Hutubessy R, Dessis D, Coudeville L, Dervaux B, Wichman O, Margolis HS, Kuritsky JN (2011). Health economics of dengue: A systematic literature review and expert panel’s assessment. Am. J. Trop. Med. Hyg. 84(3): 473–488.
- World Health Organization (2009a). Dengue: Guidelines for Diagnosis, Treatment, Prevention and Control. World Health Organization: Geneva.
- Nathan MB, Focks DA, Kroeger A (2006). Pupal/demographic surveys to inform dengue-vector control. Ann Trop Med Parasitol 100 Suppl 1:S1–S3.
- ToSetha Chang Moh Seng, Nealon J, Socheat D, Chantha Ngan, Nathan MB (2008 a). Community-based use of larvivorous fish Poecilia reticulata to control the dengue vector Aedes aegypti in domestic water storage containers in rural Cambodia. J Vector Ecol. 33:139–44. doi: 10.3376/1081-1710(2008)33[139:CUOTLF]2.0.CO;2.
- Seng CM, Setha T, Nealon J, Chantha n, Socheat D, Nathan MB (2008 b). The effect of long lasting insecticidal water container covers on field populations of Aedes aegypti (L.) mosquitoes in Cambodia. J Vector Ecol. 33:333–41. doi: 10·3376/1081-1710-33·2·333.b.
- Nathan MB (1993). Critical review of Aedes aegypti control programs in the Caribbean and selected neighboring countries. J Am Mosq Control Assoc. 9:1–7.
- World Health Organization (2009b). Integrated Vector Management (IVM), Working Group Meeting Reports. WHO: Geneva. WHO/HTM/NTD/VEM/2009·2
- Tun-Lin W, Lenhart A, Vu Sinh N, Rebollar-Téllez E, Morrison AC, Barbazan P, et al.. Reducing costs and operational constraints of dengue vector control by targeting productive breeding places: a multi-country non-inferiority cluster randomized trial. Trop Med Int Health. 14:1143–53. doi: 10.1111/j.1365-3156.2009.02341.
- Focks D (2004) A review of entomological sampling methods and indicators for dengue vectors. Geneva, World Health Organization (TDR/IDE/DEN/03·1). http://whqlibdoc.who.int/hq/2003/TDR_IDE_DEN_03·1.pdf
- Focks D, Alexander N (2006). Multicountry study of Aedes aegypti pupal productivity survey methodology: findings and recommendations. World Health Organization (TDR/IDE/Den/06·1)
- Troyo A, Fuller DO, Calderon-Arguedas O, Beier JC (2007). A Geographical sampling method for surveys of mosquitolarvae in an Urban area using high-resolution satellite imagery. J. Vector Ecology. 33 (1): 1–7.
- Parks W, Lloyd L. (2004) Planning social mobilization and communication for dengue fever prevention and control: a step-by-step guide. Geneva, World Health Organization. http://whqlibdoc.who.int/publications/2004/9241591072.pdf
- Spiegel J, Bennett S, Hattersley L, Hayden MH, Kittayapong P, et al.., (2005) Barriers and Bridges to Prevention and Control of Dengue: The Need for a Social–EcologicalApproach. EcoHealth 2:273–290, DOI: 10·1007/s10393-005-8388-x.
- Tran T, Han Tuyet, Hill PS, Kay BH, Quy TM (2009). Development of a framework for evaluating the sustainability of community-based dengue control projects. Am. J. Trop. Med. Hyg. 80 (2):312–318.
- World Health Organization (2008) Development of a Global Action Plan for Integrated Vector Management (IVM), Report of a WHO Consultation. 1–3 December 2008, World Health Organization: Geneva.
- Arunachalam N, Tana S, Espino FE, Kittayapong P, Abeyewickreme W, Wai KT, Tyagi BK, Kroeger A, Sommerfeld J, Petzold M (2010). Eco-Bio-Social determinants of dengue vector breeding: a multi country study in urban and peri-urban Asia. Bull World Health Organ. 2010 March; 88(3): 173–184. doi: 10.2471/BLT.09.067892.
- Kittayapong P, Yoksan S, Chansang U, Chansang C, Bhumiratana A (2007). Suppression of dengue transmission by application of integrated vector control strategies at sero-positive GIS-based foci. Am J Trop Med Hyg 78 (1): 170–76.
- TDR-WHO (2011) Operational guide for assessing the productivity of Aedes aegypti breeding sites. Webversion. World Health Organization, Geneva. www.who.int/entity/tdr/publications/documents/sop-pupal-surveys.pdf
- Tun Lin W, Kay BH, Burkot TR (1994). Quantitative sampling of immature Aedes aegypti in metal drums using sweep net and dipping methods. J Am Mosq Control Assoc. 10(3):390–6.
- Kay BH, Cabral CP, Araujo DB, Ribeiro ZM, Braga PH, Sleigh AC. (1992) Evaluation of a funnel trap for collecting copepods and immature mosquitoes from wells. J Am Mosq Control Assoc. 8(4):372–5.
- Romero-Vivas CM.E, Llinás H, Falconar A.K.I. (2007). Three calibration factors, applied to a rapid sweeping method can accurately estimate Aedes aegypti pupal numbers in large water-storage containers at all temperatures at which dengue virus transmission occurs. Journal of Medical Entomology, 44(6):930–937.
- Johansson MA, Dominici F, Glass GE (2009) Local and Global Effects of Climate on Dengue Transmission in Puerto Rico. PLoS Negl Trop Dis 3(2): e382. doi:10.1371/journal.pntd.0000382.
- Hurtado-Diaz M, Riojas-Rodriguez H, Rothenberg SJ, Gomez-Dantes H, Cifuentes E (2007) Short communication: impact of climate variability on the incidence of dengue in Mexico.Trop Med Int Health12:1327–1337.
- Fuller DO, Troyo A, Beier JC. (2009) El Niño southern oscillation and vegetation dynamics as predictors of dengue fever cases in Costa Rica. Environ Res Lett. 4:140111–140118. doi: 10.1088/1748-9326/4/1/014011.
- Lenhart AE, Castillo CE, Oviedo M, Villegas E. (2006). Use of the pupal-demographic survey technique to identify the epidemiologically important types of containers producing Aedes aegypti in a dengue-epidemic area of Venezuela. Ann Trop Med Parasitol. 100 Suppl 1:S53–S59.
- Romero-Vivas CME, Arango-Padilla P, Falconar AKI (2006). Pupal-productivity surveys to identify the key container habitats of Aedes aegypti (L.) in Barranquilla, the principal seaport of Colombia. Annals of Tropical Medicine and Parasitology 100 Suppl, Issue: S87–S95.
- Arredondo-Jimenez JI, Valdez-Delgado KM. Aedes aegypti pupal/demographic surveys in southern Mexico: consistency and practicality. Ann Trop Med Parasitol 2006; 100Suppl 1: S17–S32.
- Focks DA, Chadee DD (1997). Pupal survey: an epidemiologically significant surveillance method for Aedes aegypti. An example using data from Trinidad. Am J Trop Med Hyg. 56:159–67.
- Knox TB, Nguyen TY, Vu SN, Gatton ML, Kay BH, Ryan PA (2007). Critical evaluation of quantitative sampling methods for Aedes aegypti (Diptera: Culicidae) immatures in water storage containers in Vietnam. J Med Entomol. 44:192–204.
- Kroeger A, Lenhart A, Ochoa M, Villegas E, Levy M, Alexander N, McCall PJ. (2008) Effective Control of Dengue Vectors with Curtains and Container Covers Treated with insecticides in Mexico and Venezuela: Cluster Randomized Trials. BMJ332:1247. doi: 10.1136/bmj.332.7552.1247.
- Focks DA, Brenner RJ, Hayes J, Daniels E (2000). Transmission thresholds for dengue in terms of Aedes aegypti pupae per person with discussion of their utility in source reduction efforts. Am J Trop Med Hyg. 62:11–18.