
Abstract
This study examined verbal retrieval in participants with acquired moderate-to-severe sensorineural hearing impairment (M age = 63, M education level = 13 years) compared to participants with normal hearing thresholds (M age = 62, M education level = 14 years) using the letter and category fluency tasks. Analyses of number of words produced, clustering, and switching, were conducted. There was no significant difference between the groups in category fluency performance. In letter fluency, however, the participants with hearing impairment produced significantly fewer words than the normal hearing participants and their production was characterized by fewer switches. Regression analyses were conducted to examine the relationship between demographic, auditory, and cognitive variables and letter fluency performance in the two groups. Phonological skills and auditory acuity predicted letter fluency output only in participants with hearing impairment and a hearing-related link between phonological skills, working memory capacity, and letter fluency switching was found.
Introduction
In verbal fluency tasks (Benton, Citation1968; Benton and Hamsher, Citation1976; Tallberg et al., Citation2008), participants are required to generate as many words as possible that either start with a specific letter, for example F or A (letter fluency), or belong to a certain semantic category, for example animals (category fluency), within a limited time interval. Verbal fluency is most commonly used to index the organization and integrity of lexical and semantic memory representations (Marczinski and Kertesz, Citation2006; Tröster et al., Citation1998) and executive functions (Chiappe and Chiappe, Citation2007; Rende et al., Citation2002). It is, however, well recognized that the letter and category fluency tasks are multifaceted and tap both overlapping and specific processes (Rende et al., Citation2002; Costafreda et al., Citation2006; Gourovitch et al., Citation2000; Katzev et al., Citation2013). Notably, words need to be retrieved according to either a phonological or a semantic search, placing different demands on phonological and semantic processing (Costafreda et al., Citation2006; Gourovitch et al., Citation2000). Successful implementation of a phonological search is most likely related to individual abilities in accessing, temporarily storing and manipulating phonological information (Rende et al., Citation2002). Phonological impairment has been found to be associated with reduced letter fluency performance in, for example, individuals with dyslexia (Paulesu et al., Citation1996; Snowling et al., Citation1997) or aphasia (Marczinski and Kertesz, Citation2006; Mendez et al., Citation2003), and in children with hearing impairment who have cochlear implants (Löfkvist et al., Citation2012).
In individuals with severe postlingually acquired hearing impairment, phonological representations and the ability to perform operations on these representations tend to be negatively affected (Andersson, Citation2002; Lyxell et al., Citation1998, Citation2003; Andersson and Lyxell, Citation1998). In tasks with high phonological processing demands they typically perform worse than individuals with normal hearing. However, this is often not the case in tasks less explicitly targeting phonological processing, such as semantic decision-making (Andersson and Lyxell, Citation1998; Lyxell et al., Citation2003; Andersson, Citation2002). Thus, it is likely that letter fluency performance is sensitive to acquired hearing impairment, while category fluency is not (van Hooren et al., Citation2005). Letter fluency performance can also be expected to be associated with phonological skills to a higher degree in individuals with hearing impairment than in individuals with normal hearing.
The letter fluency task is further of interest in relation to phonological processing following hearing loss because qualitative aspects of task performance can be analyzed and reveal cognitive strategies involved in phonologically based retrieval (Raskin et al., Citation1992; Troyer et al., Citation1997). The two main cognitive processes underlying verbal retrieval in fluency tasks are searching for overall subcategories, followed by searching for lexical items within those subcategories (Unsworth et al., Citation2011; Troyer et al., Citation1997; Gruenewald and Lockhead, Citation1980; Wixted and Rohrer, Citation1994). For example, a subcategory in letter fluency consists of words beginning with the same two initial phonemes (fa_) from which the specific items fast, far, father, etc, can be drawn. When the items are exhausted, search for a new subcategory (e.g. fo_) is initiated. The two processes can be quantified by the measures of clustering and switching (Troyer et al., Citation1997). A cluster is a sequence of words belonging to the same subcategory while switching is the process of moving from one cluster to another. The size of the clusters is typically interpreted as an indicator of the organization of linguistic representations in semantic long-term memory and likely reflects the relatively automatic retrieval of associatively or phonologically linked lexical items (Rende et al., Citation2002). Thus, reduced cluster size would indicate a deviation in the organization of verbal memory (Abwender et al., Citation2001), or a less efficient access to lexico-semantic memory stores (Tröster et al., Citation1998; Troyer et al., Citation1997). The number of clusters in a protocol has been suggested to indicate the extent to which the strategy of using semantic/phonological associations between words to support retrieval is employed (Kave et al., Citation2008). Switching is considered a marker of the second mechanism active in verbal fluency: the ability to self-generate category cues and shift efficiently between them. This implies strategic search for helpful retrieval cues, most likely supported by subvocal syllabification (Rende et al., Citation2002).
These strategy measures are far from unproblematic: the number of switches is necessarily limited by the total number of words generated and larger clusters mean fewer switches. How to best assess these strategies has been under debate and different scoring methods have been tried (Koren et al., Citation2005; Raskin et al., Citation1992; Sauzeon et al., Citation2004; Tröster et al., Citation1998). Controlling for the total number of words generated does not solve the issue. For example, switching scores of individuals with Huntington's, Alzheimer's and Parkinson's diseases do not differ from those of healthy controls when ratio scores are used (Tröster et al., Citation1998). This suggests either that cognitive function is intact in these groups, a conclusion that is not reasonable (Tröster et al., Citation1998), or that meaningful information is lost when ratio scores are used (Tröster et al., Citation1998; Troyer, Citation2000). Troyer (Citation2000) therefore recommends using raw scores, arguing that they best capture the behavior of interest, for example the number of times an individual can self-generate new retrieval cues. The implication is that clustering and switching are strategies that in part determine the generation of new words rather than vice versa (Troyer, Citation2000). In the original method developed by Troyer et al. (Citation1997), two scores were derived, number of switches and mean cluster size. After it was pointed out that number of switches might simply reflect a failure to cluster (Abwender et al., Citation2001), number of clusters are often used as an additional measure to counteract this problem (Koren et al., Citation2005). Information about the number of clusters as well as their size can help determine whether number of switches reflects difficulties in shifting to a new cluster and/or difficulties in retrieving words within clusters (Mayr, Citation2002).
With this in mind, clustering and switching have been found to contribute to overall performance in both letter and category fluency (Unsworth et al., Citation2011), but switching seems to be particularly important to letter fluency, while both clustering and switching contribute to category fluency (Tröster et al., Citation1998; Troyer et al., Citation1997).
To return to this study, hearing impairment has been coupled to generation of fewer words and fewer switches in 8- to 9-year-old children with cochlear implants (Löfkvist et al., Citation2012). Although adults with postlingually acquired hearing loss are likely to have better phonological skills than children with cochlear implants, it can be expected that, in as much as they show reductions in letter fluency output, they will also deviate from participants with normal hearing in terms of the strategy measures. Efficient strategy use should also be more closely tied to phonological abilities in participants with hearing impairment.
Access to good working memory capacity (WMC), i.e. ability to simultaneously maintain and process information (Baddeley, Citation2012; Daneman and Carpenter, Citation1980; Daneman and Merikle, Citation1996), has been found to play an important role when auditory function is compromised. In individuals with hearing impairment, high WMC supports speech comprehension in adverse listening conditions and performance in phonologically challenging tasks (Gatehouse et al., Citation2006; Lunner, Citation2003; Lunner and Sundewall-Thoren, Citation2007; Mattys et al., Citation2012; Classon et al., Citation2013b, Rudner et al., Citation2008, Citation2011). For example, Classon et al. (Citation2013b) found that, in participants with acquired hearing loss, high WMC individuals were significantly better than low WMC individuals at judging whether orthographically dissimilar written words rhymed or not while WMC had no impact on the performance of participants with normal hearing. This suggests that good WMC can help compensate for phonological declines. Verbal fluency has been found to be sensitive to differences in WMC in normal hearing participants (Azuma, Citation2004; Rosen and Engle, Citation1997; Rende et al., Citation2002; Unsworth et al., Citation2011). For example, Rende et al. (Citation2002) used a dual-task design to investigate the separate contributions to verbal fluency of three working memory components; the phonological loop, the visuospatial sketchpad and the central executive (Baddeley et al., Citation1997; Baddeley, Citation2012). They found that concurrent performance in a task interfering with phonological loop operations impaired letter fluency more than category fluency while concurrent performance in a task interfering with the visuospatial sketchpad impaired category fluency more than letter fluency. With a dual task designed to engage the central executive, performance was equally impaired in both fluency tasks. A recent study by Unsworth et al. (Citation2011) used latent variable analysis to investigate how a range of cognitive variables; WMC, inhibition, vocabulary size and processing speed, were related to global verbal fluency (letter and category) performance. They found that WMC had the strongest relation to number of words generated and predicted unique variance in both clustering and switching. These results implicate both WMC and phonological processes in letter fluency.
In this study, if WMC helps compensate for any adverse hearing-related effects on verbal fluency it should be more strongly related to overall performance and/or indices of strategy use (clustering and switching) in participants with hearing impairment than in normal hearing participants.
Speed of phonologically mediated lexical access has been suggested to be of importance to speech understanding in noise when hearing is compromised (CitationRönnberg, 2003; Rönnberg et al., Citation2008). Fast lexical retrieval from semantic long-term memory is likely to contribute to speech understanding when listening conditions are suboptimal and portions of the spoken message are not perceived (Rönnberg et al., Citation2011). The lexical search under phonological constraints conducted in the letter fluency task may mimic processes required to infer meaning from degraded speech signals. To exemplify, if only part of a word is perceived, for instance its initial syllable, this calls for initiation of a strategic search for lexical items starting with that particular syllable, together with assessments of whether the generated items also fit semantically into the context (e.g. perception of the fragmented sentence ‘Are you an_’ triggers a search resulting in, for example, the items anxious, angry, and Anglican, from which the one most likely given the semantic context, talker characteristics, etc, is chosen). The relationship between letter fluency and speech recognition in noise was therefore examined, with the hypothesis that letter fluency proficiency would show a stronger association with successful speech recognition in noise in participants with hearing impairment than in normal hearing participants.
To summarize, the aim of this study was to investigate whether individuals with moderate-to-severe, acquired hearing impairment differ from participants with normal hearing in verbal retrieval as measured by the letter and category fluency tasks. Clustering and switching was assessed in both tasks. Measures of hearing, WMC, receptive vocabulary and phonological skills were also collected and related to letter fluency performance. The hypotheses were that hearing impairment would have a negative impact on letter fluency, but not category fluency, performance. In the letter fluency task, participants with hearing impairment were expected to show less clustering and switching and depend more on phonological abilities and WMC than the normal hearing participants. Finally, a stronger relation between letter fluency and speech recognition in noise was expected in participants with hearing impairment than in the normal hearing participants.
Materials and methods
The data reported here were collected as part of a larger event-related potentials (ERP) study (see Classon et al. (Citation2013b) for a detailed description of methods and procedure). The focus of this paper is the verbal fluency data that have not been previously reported.
Participants
Inclusion criteria for the group with hearing impairment were postlingually acquired, binaural, moderate-to-severe sensorineural hearing loss for at least 5 years and habitual use of bilateral hearing aids. Irrespective of group, only native Swedish speakers with normal or corrected-to-normal vision and no self-reported history of neurological disease, traumatic brain injury, or dyslexia were included.
Thirty-one participants (12 women) with an average age of 63 years (SD = 7.15, range = 47–71) and a hearing impairment meeting the criteria listed above (HI) were recruited from the hearing clinic at Linköping University Hospital, Sweden. Their mean best ear pure tone average measured across 500, 1000; 2000 and 4000 Hz (BestEarPTA) was 75.42 (SD = 12.83, range 59–114). Mean duration of hearing impairment was 37 years (SD = 11.75, range = 10–61). All were bilaterally fitted with hearing aids since, on average, 19 years (SD = 10.93, range = 3–47). Mean age at hearing loss onset was 26 years (SD = 12.93, range = 4–53) and mean education level, measured as number of years in formal education, was 12.51 years (SD = 4.57, range = 7–23).
Thirty (11 women) normal hearing participants were recruited from the general population in the region corresponding to the catchment area of the hearing clinic and constituted the reference group (NH). Normal hearing was here defined as a BestEarPTA of less than 26 dB hearing loss and the mean BestEarPTA in this group was 14.00 (SD = 6.32, range = 3–25). The mean age was 62 years (SD = 8.12, range = 45–74) and mean education level was 14.40 years (SD = 2.36, range = 10–18).
Independent samples t-tests showed that the two groups did not differ in age (t(59) = 0.24, P = 0.81, ns). However, the group difference in education level did reach significance (t(59) = 2.01, P = 0.049, r = 0.25).
The study was approved by the regional ethics committee in Linköping (Dnr 77-09) and all participants provided written informed consent before testing started.
General procedure
All participants were tested on two separate occasions. The first session included collection of background data and ERP registration during a visual rhyme judgment task followed by an incidental recognition task. After this there was a break and then a cognitive test battery, including tests of receptive vocabulary, WMC and pseudohomophone detection was administered. Together with the rhyme judgment test, these are referred to below as the reference tests. At the end of the session, participants were given the verbal fluency task. In total the session took around 4 hours, including a 30-minute break and time for applying the ERP net. In a second session an experienced audiologist collected audiograms and speech reception thresholds.
Reference tests
Speech recognition in noise
Hagerman sentences (Hagerman and Kinnefors, Citation1995) were used to assess speech recognition in noise. In this test, sets of prerecorded five-word sentences are randomly presented in noise. The task is to repeat as many of the words as possible after each sentence. The signal-to-noise ratio (SNR) required for a performance level of 50% correctly repeated words is determined by an adaptive procedure and constitutes the dependent measure. The more negative the SNR at which the 50% correct performance level is reached, the better the speech-in-noise recognition.
Working memory capacity
WMC was assessed using a Swedish version of the Daneman and Carpenter (Citation1980) reading span test (Rönnberg et al., Citation1989). Participants read sets of written sentences presented word-by-word on a computer screen. Half of the sentences are absurd (‘The fork often cried’) and half are not (‘The car went fast’). After each sentence, the task is to orally report whether it is absurd or not, and after each set of sentences, to report either the first or the last words of each sentence in the set. Importantly, participants do not know which words (first or last) they will be asked to report until after they have read the sentences in the set. The number of sentences per set increases progressively from three to six with three trials per set size and thus a total of 54 sentences are presented. Dependent measure is the percentage of words correctly recalled.
Receptive vocabulary
Receptive vocabulary was measured by ‘Ordförståelse B’ (Word comprehension B), a multiple choice pen and paper test with no time limit. The test is part of the Swedish test battery DLSTM (Diagnostic tests of reading and writing, Järpsten, Citation2002) and consists of 34 items, e.g. ‘Transparent is the same as’. Each item is presented with a list of four words (e.g. obscure, pellucid, misty, shiny) from which the task is to choose the best fit. Results are scored as the total number of correct words chosen.
Pseudohomophone detection
A test called ‘Ljuden ger orden’, the sounds give the word (Lundberg and Wolff, Citation2003) was used to assess pseudohomophone detection. The test consists of 60 rows of three phonologically legal printed pseudowords. On each row, one of the pseudowords sounds like a real word if read aloud (e.g. sja [ʃa:] - je [je:] - jy [jy:]; je is pronounced like the Swedish word ge, to give). The task is to find and underline as many of these pseudohomophones as possible within a 2-minute time limit. The score is the total number of correctly identified pseudohomophones.
Rhyme judgment
Phonological awareness was assessed by a visual rhyme judgment task (Classon et al., Citation2013b) consisting of rhyming and nonrhyming word pairs with similar or dissimilar orthography (e.g. orthographically similar rhymes, korp – torp, [kår:p] - [tår:p]; orthographically dissimilar rhymes, helg – välj, [hel:j] - [vel:j]; orthographically similar non-rhymes, sant – saft, [san:t] - [saf:t]; orthographically dissimilar non-rhymes, bröd – spik, [brö:d] - [spi:k]). A total of 192 word-pairs are sequentially presented on a computer screen. The task is to decide with a button press whether the words in each pair rhyme or not. The results were scored as percentage correct answers.
Verbal fluency
In the letter fluency task, participants were instructed to generate as many Swedish words as possible beginning with first the letter F, and then the letter A, each within a 1-minute time limit. They were informed that proper names, numbers, and variants of the same root word were not allowed and would be excluded. In the category fluency task, instructions were to name as many items as possible belonging to the category animals during 1 minute. Both specific examples and general categories were allowed (e.g. dog and Dachshund). All participants were given the tasks in the same order (F, A, animals). Instructions were given orally and care was taken to ensure that all participants correctly understood test procedures. Responses were recorded on a digital voice recorder and later registered in protocols.
Verbal fluency, scoring method
The total number of correct words generated in the letter (sum of F and A) and the category (animals) tasks were scored. Further, clustering and switching scores were computed for each of the two tasks. The scoring procedure described in Tallberg et al. (Citation2011), originally developed by Troyer et al. (Citation1997) but modified to include number of clusters (Koren et al., Citation2005) and capture culturally specific clusters (Kosmidis et al., Citation2004) was used.
Phonological clusters were thus defined as two or more successively generated words that (1) began with the same two phonemes (e.g. aceton [aset.ån] and asfalt [a. s:fal:t], (2) differed only in a single vowel sound (e.g. falk [fal:k] and folk [fål:k]), (3) rhymed (e.g. asyl [asy.:l] and albyl [alby.:l]) or, finally, (4) were homonyms and indicated as such by the participant (e.g. allt [al:t] and alt [al:t]). Semantic clusters were defined as two or more successively generated words that (1) were subordinated or superordinated (e.g. apa and babian, monkey and baboon), (2) belonged to the same semantic category (e.g. ko and häst, the two farm animals cow and horse), or (3) had a close semantic or conceptual relationship (e.g. katt and råtta, cat and rat). As all words generated in category fluency belong to the same overarching category, animals, clusters represented subcategories based on habitat (e.g. Africa, sea, farm), zoological family (e.g. birds, bovine), family members (e.g. an animal and its offspring, male and female), and human use (e.g. beasts of burden, pets). A detailed description of the subcategories used is found in Troyer et al. (Citation1997). If a smaller cluster was embedded in a larger cluster, for example two rhymes among four words beginning with the same two phonemes in phonological cluster scoring, or the two feline animals lion and tiger among a larger set of African animals in semantic cluster scoring, only the larger cluster was counted. If a word was classified as belonging to two overlapping clusters, both were counted.
In both tasks, mean cluster size was calculated as the sum of the number of words in each cluster, starting from the second word (i.e. a cluster of two words has cluster size 1, a cluster of three words has cluster size 2, etc.), divided by the total number of clusters. Switches were calculated as the total number of transitions between clusters, including transitions between single words (Troyer et al., Citation1997 1998; Troyer, Citation2000). Following the recommendation of Troyer (Citation2000) raw scores of clustering and switching were analyzed. This method is perhaps most frequently used and its advantages and disadvantages are well described in the literature (Abwender et al., Citation2001; Mayr, Citation2002; Troyer, Citation2000; Tröster et al., Citation1998). For reasons mentioned in the Introduction, number of clusters was also scored (Koren et al., Citation2005). Thus, three strategy measures were compiled for each task: (1) number of clusters, (2) number of switches, and (3) mean size of clusters.
Inter-rater reliability for the analyses of clustering and switching
After a first evaluator had classified clustering and switching in the total material, 15% of the protocols were randomly selected. A second evaluator then made a separate, blind, classification. The inter-rater reliabilities, calculated using the Pearson correlation coefficient, were satisfactory (letter fluency: number of clusters, r = 0.89, P = 0.001, number of switches, r = 0.93, P < 0.001, cluster size, r = 0.97, P < 0.001; category fluency: number of clusters, r = 0.74, P = 0.022, number of switches, r = 0.91, P = 0.001, cluster size, r = 0.86, P = 0.003).
Statistical analysis
Between groups comparisons were examined using analyses of covariance (ANCOVAs) with education level and age as covariates. Education level was entered as covariate because the groups differed in this measure, and age because of the large spread in age in both groups and the known impact of age on verbal fluency (Tallberg et al., Citation2008; Van der Elst et al., Citation2006; Troyer, Citation2000). Only significant covariates are reported in the text. Differences between dependent correlations were tested with Chen and Popovich (Citation2002) t, and differences between independent correlations with Fishers z. Multiple linear regression analyses, using the forced entry method, were conducted to explore which variables best predicted performance. Unless otherwise explicitly mentioned the following procedure was used: in an initial exploratory step, the covariates (age and education level) were entered in a first block and all predictors (BestEarPTA, WMC, receptive vocabulary, pseudohomophone detection and rhyme judgment) were entered in a second block. A second multiple regression analysis was then conducted in which only the predictors identified as significant or tending to significance were retained in the second block. All regressions were conducted separately for each group. The α-level was set to 0.05 in all analyses.
Results
Reference tests
The difference between group means in BestEarPTA and speech recognition in noise was substantial (see , |FBestEarPTA (1,57) = 527.84, MSE = 104.49, P < 0.001, partial n2 = 0.90; FSpeech-in-noise (1,56) = 84.43, MSE = 9.71, P < 0.001, partial n2 = 0.60). HI and NH did not differ in either WMC (F(1,57) = 0.36, MSE = 69.54, P = 0.548, ns), receptive vocabulary (F(1,56) = 1.03, MSE = 4.38, P = 0.316, ns), pseudohomophone detection (F(1,57) = 0.93, MSE = 63.65, P = 0.339, ns) or rhyme judgment (F(1,57) = 2.39, MSE = 42.28, P = 0.127, ns). In the analyses above, education level was a significant covariate in all but the BestEarPTA analysis (F ≥ 4.59, P ≤ 0.036), and age was a significant covariate in pseudohomophone detection and WMC (F ≥ 4.86, p ≤ 0.031).
Table 1. Means and standard deviations for the participants with hearing impairment (HI) and normal hearing (NH).
Verbal fluency
Total performance in HI and NH
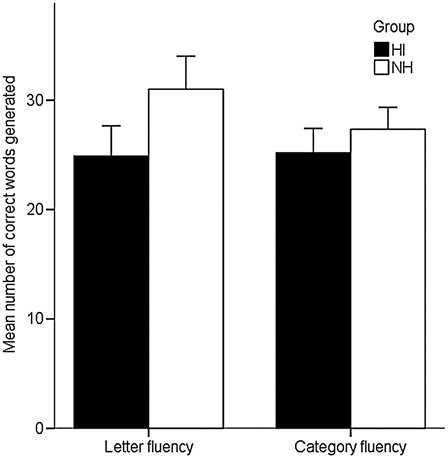
ANCOVAs showed that HI generated significantly fewer words than NH in the letter fluency task, both in terms of total number of words generated (MHI = 26.77, MNH = 32.57; F(1,57) = 4.57, MSE = 67.41, P = 0.037, partial n2 = 0.74) and in terms of number of correct words (MHI = 24.90, MNH = 31.00; F(1,57) = 6.34, MSE = 56.08, P = 0.015, partial n2 = 0.10). By contrast, there were no group differences in category fluency (total number of words generated, MHI = 25.55, MNH = 27.87, F(1,57) = 1.30, MSE = 32.41, P = 0.258, ns; number of correct words, MHI = 25.19, MNH = 27.33, F(1,57) = 1.13, MSE = 31.70, P = 0.293, ns) (). The effect was not due to differences in number of incorrect words reported. Errors, for example repeating the same word, or reporting a proper name or number, were rare overall and did not differ between groups (letter fluency, MHI = 1. 87, MNH = 1.57, F(1,57) = 0.51, MSE = 3.32, P = 0.478, ns; category fluency, MHI = 0.35, MNH = 0.53, F(1,57) = 0.65, MSE = 0.42, P = 0.424, ns).
Figure 1. Mean number of correct words generated in the letter fluency and category fluency tasks, divided by group. HI, hearing impairment, NH, normal hearing. Error bars represent 95% confidence intervals.
Relationship between clustering measures and total performance
The relationship between the fluency subcomponents and total number of words generated in each group was examined to investigate which strategies contributed to total performance (Weiss et al., Citation2006; Unsworth et al., Citation2011; Kosmidis et al., Citation2004; Kave et al., Citation2008; Tallberg et al., Citation2011; Troyer et al., Citation1997). The coefficients (see ) show that letter fluency performance was highly associated with switching and number of clusters, while category fluency performance was related to cluster size in both groups but not to switching. In letter fluency, switching was more highly correlated with total output than number of clusters in HI only (tHI(28) = 2.16, p = 0.039; tNH(27) = 0.90, P = 0.374, ns). The strength of the relationship between switching and total performance did not differ between HI and NH (z = 0.25, P = 0.387, ns). Category fluency performance was equally associated with mean cluster size and number of clusters (tHI(28) = 0.28, P = 0.782, ns; tNH(27) = 1.65, P = 0.110, ns). Across groups, an average of 44% of the letter fluency words and 93% of the category fluency words were clustered. The absolute number of words organized in clusters did not differ between groups in either task (letter fluency, MHI = 11.90, MNH = 14.77, F(1,57) = 0.71, MSE = 51.62, P = 0.401, ns, education level significant as covariate, F = 6.72, P = 0.012; category fluency, MHI = 23.90, MNH = 26.17, F(1,57) = 0.89, MSE = 39.08, P = 0.350, ns).
Table 2. Pearson correlation coefficients between clustering scores and total number of words generated, divided by group
Clustering and switching
Clustering and switching statistics are displayed in . In the letter fluency task, there were no significant group differences in number (F(1,57) = 1.26, MSE = 6.76, P = 0.266, ns, education level significant as covariate, F = 6.71, P = 0.012) or size (F(1,57) = 0.14, MSE = 0.14, P = 0.710, ns) of clusters. However, HI made significantly fewer cluster switches than NH (F(1,57) = 5.34, MSE = 43.01, P = 0.024, partial n2 = 0.09).
Table 3. Means and standard deviations for the participants with hearing impairment (HI) and normal hearing (NH) in letter fluency clustering and switching
There were no differences between groups in either clustering or switching in the category fluency task (F(1,58) ≤ 2.85, P ≥ 0.097, ns).
To summarize, even though the groups were well matched on receptive vocabulary, WMC and phonological skills, phonologically based verbal retrieval as indexed by letter fluency was reduced in HI as compared to NH, and HI made fewer switches in this task. Semantically based retrieval was unaffected by hearing loss, both as measured by total category fluency output and the fluency subcomponents. Thus, as hypothesized, only letter fluency was sensitive to hearing loss. The remainder of the results section focuses on the letter fluency task and how letter fluency performance relates to the other variables in the study.
Predictors of letter fluency
displays the correlation coefficients between the fluency measures and the other variables in each group and shows the intercorrelations between the variables. indicates that age, education level, WMC, pseudohomophone detection, and rhyme judgment may have been more related to letter fluency in HI than in NH, but some of these variables also correlated with each other (). In order to find the best predictors of letter fluency, separate multiple regression analyses were conducted for each group. The results (displayed in ) showed distinctly different patterns across groups: while no predictors reached significance in NH, BestEarPTA and pseudohomophone detection together increased the amount of letter fluency variance explained from 22 to 40% in HI. Note that good hearing acuity is reflected by low BestEarPTA, thus, the negative β shows that better hearing predicted better fluency performance.
Table 4. Pearson correlation coefficients between letter fluency scores, demographic variables and the reference tests
Table 5. Intercorrelations between letter fluency performance, demographic variables and the reference tests, divided by group. Pearson correlation coefficient are displayed
Table 6. Results of separate multiple linear regressions in each group (enter method) with number of words generated in the letter fluency task as criterion variable
A second set of regressions were conducted to examine predictors of letter fluency clustering and switching. Results showed that none of the variables significantly predicted any of the variance in number of clusters (see ). However, pseudohomophone detection increased the amount of explained variance in number of switches by 13% in HI and 14% in NH. Cluster size was inversely related to receptive vocabulary, but only in NH. In short, pseudohomophone detection skills partly explained phonological switching in both groups, and for NH, the better their receptive vocabulary, the smaller the clusters they produced.
Table 7. Results of separate multiple linear regressions in each group (enter method) with the letter fluency subcomponents as criterion variables
We set out with a question about the role of WMC in phonologically based verbal retrieval, and whether there would be group differences in the engagement of WMC in this task. WMC did not reach the criterion for entry in any of the regression analyses above. Although variance inflation factors consistently below 3 and tolerances above 0.2 indicate that multicollinearity was not an issue in these analyses, the intercorrelations between WMC and other variables were high in HI. Therefore, another set of regressions were conducted to examine any unique contribution of WMC to letter fluency performance. Age and education level were entered in a first block, followed by WMC in a second block (enter method). Results showed that WMC did not contribute to total number of words generated (HI, β = 0.28, ΔR2 = 0.06, F = 2.29, P = 0.141, ns; NH, β = 0.10 ΔR2 = 0.01, F = 0.17, P = 0.683, ns) or to number of clusters (HI, β = 0.01, ΔR2 = 0.00, F = 0.00, P = 0.967, ns; NH, β = 0.19, ΔR2 = 0.02, F = 0.68, P = 0.416, ns) in either group. However, in HI alone, WMC increased the variance explained in switching by 14% (HI, β = 0.44, ΔR2 = 0.14, F = 5.26, P = 0.030; NH, β = 0.04, ΔR2 = 0.00, F = 0.03, P = 0.865, ns) and in cluster size by 20% (HI, β = −0.52, ΔR2 = 0.20, F = 6.95, P = 0.014; NH, β = 0.06, ΔR2 = 0.00, F = 0.06, P = 0.817, ns). Interestingly, WMC was positively related to switching and negatively related to cluster size: in HI, better WMC was thus associated with more switches and smaller clusters.
Predictors of speech recognition in noise
Finally, regression analyses were conducted to examine whether letter fluency contributed to speech recognition in noise. The correlation coefficient suggested this might be the case in HI (). Because hearing acuity is acknowledged to be the best predictor of speech recognition in noise (Akeroyd, Citation2008; Humes, Citation2007), variables were entered in the following order: age and education level were entered in the first block and BestEarPTA in the second. The third block included WMC, receptive vocabulary, pseudohomophone detection, rhyme judgment, and total number of words generated in the letter fluency task (enter method). Contrary to the hypothesis that letter fluency performance would be related to speech recognition in noise in HI, letter fluency was not a significant predictor in either group (see ). Instead, rhyme judgment increased the amount of explained variance by 12% in HI, while not contributing significantly to NH performance.
Table 8. Results of separate multiple linear regressions in each group (enter method) with speech-in-noise as criterion variable
To summarize, letter fluency performance was related to pseudohomophone detection skills and BestEarPTA in HI, but not in NH. Pseudohomophone detection skills further helped predict switching in both groups. WMC was related to switching and cluster size only in HI. Beyond the effect of age, education level and BestEarPTA, none of the predictors added to the amount of explained variance in speech recognition in noise performance in NH, while in HI, rhyme judgment explained additional variance.
Discussion
This study investigated verbal fluency in individuals with postlingually acquired hearing impairment and related fluency performance to a range of other variables including hearing acuity, phonological skills and WMC. The aim was to examine whether impaired auditory function had an impact on phonologically mediated lexical access and retrieval as reflected by letter fluency performance and strategy use.
As hypothesized, HI generated significantly fewer words than NH in the letter fluency task, while the two groups performed on a par in category fluency. Because letter fluency requires manipulation of phonological information (Rende et al., Citation2002) an ability known to be influenced by hearing acuity (Andersson, Citation2002; Lyxell et al., Citation2003) this was expected. Interestingly, the link between hearing impairment and lower letter fluency performance in this study was found even though HI performed on a par with NH in tests of WMC, receptive vocabulary, visual rhyme judgment, and pseudohomophone detection. This suggests that letter fluency is a task highly sensitive to hearing impairment.
Most of the work to date has focused on input rather than output phonology in adults with acquired hearing impairment (Lazard et al., Citation2010, Citation2012; Classon et al., Citation2013a, Citation2013b). To our knowledge only one previous study, Andersson (Citation2002), included tests of output phonology with this group and used two word production tasks, rhyme and antonym generation. Rhyme generation taps search and retrieval of words sharing phonological similarity, and antonym generation search and retrieval based on semantic information. In parallel to the results presented here, rhyme generation was sensitive to hearing loss but antonym generation was not. That acquired hearing impairment has this specific impact on phonologically, but not semantically, based verbal retrieval suggests that when more semantic processing is involved in a task, activation of semantic representations may help compensate for poorly specified phonology (Martin and Saffran, Citation2002).
The present results show that better auditory acuity and better pseudohomophone detection skills were associated with a larger letter fluency output in HI. These factors did, however, not contribute to performance in NH which suggests they emerge as predictors of phonologically based verbal retrieval after acquisition of hearing loss. The pseudohomophone detection task taps speeded phonological encoding followed by a search for matching phonological representations stored in semantic long-term memory (Rubenstein et al., Citation1971). This overlaps with the time-constrained self-generation of phonological codes and search for matches required in letter fluency. Although not directly tested in this study, earlier work suggest that phonological loop functions such as encoding and articulatory rehearsal tend to be intact in individuals with acquired hearing impairment (Andersson, Citation2002; Lyxell et al., Citation2003) while phonological representations are impoverished (Andersson, Citation2002; Classon et al., Citation2013b, Lyxell et al., Citation2003). The reduced letter fluency performance might thus partly be linked to difficulties in the matching of phonological codes to stored representations that are degraded.
Interestingly, while HI generated fewer words overall in the letter fluency task, there was no difference between the groups in number of clusters, mean cluster size, or absolute number of words organized in clusters. Instead, hearing impairment was specifically related to generation of fewer non-clustered words, reflected by significantly fewer switches in HI. This group equivalence in clustering may suggest that the relatively automatic retrieval of phonologically related lexical items proceeds normally in individuals with hearing impairment. However, it may also indicate a ‘reluctance’ to venture outside clusters, likely related to difficulties generating new phonological retrieval cues and/or matching them to stored representation. The same pattern of lower letter fluency output and fewer switches but no difference in cluster size has recently been found in children with hearing impairment and cochlear implants compared to normal hearing peers (Löfkvist et al., Citation2012).
The number of switches was positively related to pseudohomophone detection ability in both groups; in HI switching was also positively related to WMC. Access to better phonological skills thus facilitated generation of non-clustered words irrespective of hearing status but in HI good WMC also contributed. The latter effect is suggested to reflect that generating phonological codes and matching them to stored representations is more demanding in this group, requiring a larger WMC involvement to compensate for less flexible use of phonology.
Cluster size, on the other hand, did not significantly correlate with letter fluency output in either group and was negatively associated with WMC in HI and with receptive vocabulary in NH. Troyer et al. (Citation1997) suggested that a well-developed vocabulary may lead to larger phonological clusters: the bigger the pool of phonologically related words to draw from, the more words can be generated before a subcategory is exhausted. The present results rather point in the opposite direction; a large vocabulary or high WMC might help avoid ‘getting stuck’ in phonological subcategories.
While hearing acuity emerged as a predictor of letter fluency performance in HI, duration of hearing loss did not correlate with performance in letter fluency or the other phonological tasks as might have been expected. Hearing-related effects on phonological abilities tend to be progressive (Andersson and Lyxell, Citation1998; Lyxell et al., 1994; Lyxell, 1996), but level out after the first 10–15 years (Ito et al., Citation1993; Andersson, Citation2002). Participants in this study differed in duration of hearing loss but the minimum was 10 years and in fact only one individual reported a duration of less than 18 years. Most likely, this accounts for the lack of correlations with hearing loss onset.
Contrary to expectation, phonologically based verbal retrieval as reflected by letter fluency performance was not a significant predictor of speech recognition in noise in HI, even if there was a significant correlation between the two variables in this group. Instead, rhyme judgment contributed to speech recognition in noise in HI, which replicates the result of Lunner (Citation2003). The sentences in the speech-in-noise test used in this study have low redundancy and leave less room for using context as a cue to what is being said (Lunner, Citation2003; Hagerman and Kinnefors, Citation1995). It may be that a stronger relation between fluency and speech recognition could be obtained with a test using more naturalistic sentences. It is also possible that tasks tapping input phonology more closely mimics the processes involved in speech perception while tasks involving output phonology might be more related to connected speech.
In line with this suggestion is the finding by Heller and Dobbs (Citation1993) that verbal fluency performance (letter and category) accounted for part of the variance in word finding in discourse situations. Interestingly, tests of word finding have been found to be very sensitive to even milder hearing impairments in children (Borg et al., Citation2007) and phonological processing difficulties have been associated with word-finding problems, as evidenced by increased rate of tip-of-the-tongue states, in children and adolescents with dyslexia (Faust et al., Citation2003; Hanly and Vandenberg, Citation2010; Faust and Sharfstein-Friedman, Citation2003). Tip-of-the-tongue states are typically marked by access to semantic features of a word, together with parts of its phonology, for instance the initial phoneme, while the complete phonology remains inaccessible (Levelt, Citation1999, Citation2001). Such retrieval failures have been suggested to arise from incomplete activation of phonological representations (Burke et al., Citation1991). Future studies should examine whether acquired hearing impairment is related to word finding difficulties.
Finally, some limitations of this study should be pointed out. In order to keep the time of testing within reasonable limits, only three fluency cues were administered in this study (F, A, and animals). Using more cues and perhaps a manipulation of task demands, for example by using letters that vary in their frequency as initial letters (Katzev et al., Citation2013), would have allowed for more fine-grained analyses. It is, not unlikely that hearing impairment disrupts verbal fluency more when task demands are higher. Second, the participants with hearing impairment varied in severity of hearing loss, a factor that turned out to predict letter fluency performance. Including only participants with severe hearing loss would have optimized the design but was not an option in this study. Collection of timing data would have allowed us to perform analysis of time-intervals between generation of words, both within and between clusters (Mayr, Citation2002). For example, prolonged time-intervals after the last words organized in clusters would be a strong indicator of a tendency to stick with the clustering strategy.
Conclusion
Participants with hearing impairment generated fewer words overall and did not alternate between retrieval strategies as freely as the normal hearing participants did in the letter fluency task. Access to phonological skills and good WMC however mitigated this effect. The inclination to produce fewer non-clustered words suggest a less flexible phonology in individuals with acquired hearing impairment.
References
- Abwender D.A., Swan J.G., Bowerman J.T., Connolly S.W. 2001. Qualitative analysis of verbal fluency output: review and comparison of several scoring methods. Assessment, 8(3): 323–338.
- Akeroyd M. 2008. Are individual differences in speech reception related to individual differences in cognitive ability? A survey of twenty experimental studies with normal and hearing-impaired adults. International Journal of Audiology, 47: S53–S71.
- Andersson U. 2002. Deterioration of the phonological processing skills in adults with an acquired severe hearing loss. European Journal of Cognitive Psychology, 14(3): 335–352.
- Andersson U., Lyxell B. 1998. Phonological deterioration in adults with an acquired severe hearing impairment. Scandinavian Audiology, 27: 93–100.
- Azuma T. 2004. Working memory and perseveration in verbal fluency. Neuropsychology, 18(1): 69–77.
- Baddeley A. 2012. Working memory: theories, models, and controversies. Annual Review of Psychology, 63: 1–29.
- Baddeley A., DellaSala S., Papagno C., Spinnler H. 1997. Dual-task performance in dysexecutive and nondysexecutive patients with a frontal lesion. Neuropsychology, 11(2): 187–194.
- Benton A. 1968. Differential behavioral effects in frontal lobe disease. Neuropsychologia, 6: 53–60.
- Benton A., Hamsher K. 1976. Multilingual aphasia examination. Iowa City, IO: University of Iowa Press.
- Borg E., Edquist G., Reinholdson A.C., Risberg A., McAllister B. 2007. Speech and language development in a population of Swedish hearing-impaired pre-school-children, a cross-sectional study. International Journal of Pediatric Otorhinolaryngology, 71(7): 1061–1077.
- Burke D.M., Mackay D.G., Worthley J.S., Wade E. 1991. On the tip of the tongue – what causes word finding failures in young and older adults. Journal of Memory and Language, 30(5): 542–579.
- Chen P.Y., Popovich P.M. 2002. Correlation: parametric and nonparametric measures. Thousand Oaks, CA: Sage.
- Chiappe D.L., Chiappe P. 2007. The role of working memory in metaphor production and comprehension. Journal of Memory and Language, 56(2): 172–188.
- Classon E., Rudner M., Johansson M., Rönnberg J. 2013a. Early ERP signature of hearing impairment in visual rhyme judgment. Frontiers in Psychology, 4: 241.
- Classon E., Rudner M., Rönnberg J. 2013b. Working memory compensates for hearing related phonological processing deficit. Journal of Communication Disorders, 46(1): 17–29.
- Costafreda S.G., Fu C.H.Y., Lee L., Everitt B., Brammer M.J., David A.S. 2006. A systematic review and quantitative appraisal of fMRI studies of verbal fluency: role of the left inferior frontal gyrus. Human Brain Mapping, 27(10): 799–810.
- Daneman M., Carpenter P.A. 1980. Individual-differences in working memory and reading. Journal of Verbal Learning and Verbal Behavior, 19(4): 450–466.
- Daneman M., Merikle P.M. 1996. Working memory and language comprehension: a meta-analysis. Psychonomic Bulletin & Review, 3(4): 422–433.
- Faust M., Dimitrovsky L., Shacht T. 2003. Naming difficulties in children with dyslexia: application of the tip-of-the-tongue paradigm. Journal of Learning Disabilities, 36(3): 203–215.
- Faust M., Sharfstein-Friedman S. 2003. Naming difficulties in adolescents with dyslexia: application of the tip-of-the-tongue paradigm. Brain Cognition, 53(2): 211–217.
- Gatehouse S., Naylor G., Elberling C. 2006. Linear and nonlinear hearing aid fittings - 2. Patterns of candidature. International Journal of Audiology, 45(3): 153–171.
- Gourovitch L.M., Kirkby S.B., Goldberg E.T., Weinberger R.D., Gold M.J., Esposito G., et al. 2000. A comparison of rCBF patterns during letter and semantic fluency. Neuropsychology, 14(3): 353–360.
- Gruenewald P.J., Lockhead G.R. 1980. The free-recall of category examples. Journal of Experimental Psychology-Human Learning and Memory, 6(3): 225–240.
- Hagerman B., Kinnefors C. 1995. Efficient adaptive methods for measuring speech reception threshold in quiet and in noise. Scandinavian Audiology, 24(1): 71–77.
- Hanly S., Vandenberg B. 2010. Tip-of-the-tongue and word retrieval deficits in dyslexia. Journal of Learning Disability, 43(1): 15–23.
- Heller R.B., Dobbs A.R. 1993. Age-differences in word-finding in discourse and nondiscourse situations. Psychology and Aging 8(3): 443–450.
- Humes L.E. 2007. The contributions of audibility and cognitive factors to the benefit provided by amplified speech to older adults. Journal of the American Academy of Audiology, 18(7): 590–603.
- Ito J., Sakakibara J., Iwasaki Y., Yonekura Y. 1993. Positron emission tomography of auditory sensation in deaf patients and patients with cochlear implants. Annals of Otology Rhinology and Laryngology, 102(10): 797–801.
- Järpsten B. 2002. DLS™ handledning. Stockholm: Hogrefe Psykologiförlaget AB.
- Katzev M., Tüscher O., Hennig J., Weiller C., Kaller C.P. 2013. Revisiting the functional specialization of left inferior frontal gyrus in phonological and semantic fluency: the crucial role of task demands and individual ability. The Journal of Neuroscience, 33(18): 7837–7845.
- Kave G., Kigel S., Kochva R. 2008. Switching and clustering in verbal fluency tasks throughout childhood. Journal of Clinical and Experimental Neuropsychology, 30(3): 349–359.
- Koren R., Kofman O., Berger A. 2005. Analysis of word clustering in verbal fluency of school-aged children. Archives of Clinical Neuropsychology, 20(8): 1087–1104.
- Kosmidis M.H., Vlahou C.H., Panagiotaki P., Kiosseoglou G. 2004. The verbal fluency task in the Greek population: normative data, and clustering and switching strategies. Journal of the International Neuropsychological Society, 10(2): 164–172.
- Lazard D.S., Lee H.J., Gaebler M., Kell C.A., Truy E., Giraud A.L. 2010. Phonological processing in post-lingual deafness and cochlear implant outcome. Neuroimage, 49(4): 3443–3451.
- Lazard D.S., Lee H.-J., Truy E., Giraud A.-L. 2012. Bilateral reorganization of posterior temporal cortices in post-lingual deafness and its relation to cochlear implant outcome. Human Brain Mapping, 34: 1208–1219.
- Levelt W.J.M. 1999. Models of word production. Trends in Cognitive Sciences, 3(6): 223–232.
- Levelt W.J.M. 2001. Spoken word production: a theory of lexical access. Proceedings of the National Academy of Sciences of the United States of America, 98(23): 13464–13471.
- Löfkvist U., Almkvist O., Lyxell B., Tallberg I.-M. 2012. Word fluency performance and strategies in children with cochlear implants: age-dependent effects? Scandinavian Journal of Psychology, 53(6): 467–474.
- Lundberg I., Wolff U. 2003. DUVAN™. Dyslexiscreening för ungdomar och vuxna. Stockholm: Psykologiförlaget AB.
- Lunner T. 2003. Cognitive function in relation to hearing aid use. International Journal of Audiology, 42: S49–S58.
- Lunner T., Sundewall-Thoren E. 2007. Interactions between cognition, compression, and listening conditions: effects on speech-in-noise performance in a two-channel hearing aid. Journal of the American Academy of Audiology, 18(7): 604–617.
- Lyxell B., Andersson J., Andersson U., Arlinger S., Bredberg G., Harder H. 1998. Phonological representation and speech understanding with cochlear implants in deafened adults. Scandinavian Journal of Psychology, 39(3): 175–179.
- Lyxell B., Andersson U., Borg E., Ohlsson I.S. 2003. Working-memory capacity and phonological processing in deafened adults and individuals with a severe hearing impairment. International Journal of Audiology, 42: S86–S89.
- Lyxell B., Rönnberg J., Samuelsson S. 1994. Internal speech functioning and speechreading in deafened and normal-hearing adults. Scandinavian Audiology, 23(3): 179–185.
- Lyxell B. 1996. Cognitive predictors of speech understanding following a cochlear implant operation. International Journal of Psychology, 31(3–4): 4738–4738.
- Marczinski C.A., Kertesz A. 2006. Category and letter fluency in semantic dementia, primary progressive aphasia, and Alzheimer's disease. Brain and Language, 97(3): 258–265.
- Martin N., Saffran E.M. 2002. The relationship of input and output phonological processing: an evaluation of models and evidence to support them. Aphasiology, 16(1–2): 107–150.
- Mattys S.L., Davis M.H., Bradlow A.R., Scott S.K. 2012. Speech recognition in adverse conditions: a review. Language and Cognitive Processes, 27(7–8): 953–978.
- Mayr U. 2002. On the dissociation between clustering and switching in verbal fluency: comment on Troyer, Moscovitch, Winocur, Alexander and Stuss. Neuropsychologia, 40(5): 562–566.
- Mendez M.F., Clark D.G., Shapira J.S., Cummings J.L. 2003. Speech and language in progressive nonfluent aphasia compared with early Alzheimer's disease. Neurology, 61(8): 1108–11U7.
- Paulesu E., Frith U., Snowling M., Gallagher A., Morton J., Frackowiak R.S.J., et al. 1996. Is developmental dyslexia a disconnection syndrome? Evidence from PET scanning. Brain, 119: 143–157.
- Raskin S.A., Sliwinski M., Borod J.C. 1992. Clustering strategies on tasks of verbal fluency in Parkinson's-disease. Neuropsychologia, 30(1): 95–99.
- Rende B., Ramsberger G., Miyake A. 2002. Commonalities and differences in the working memory components underlying letter and category fluency tasks: a dual-task investigation. Neuropsychology, 16(3): 309–321.
- Rosen V., Engle R. 1997. The role of working memory capacity in retrieval. Journal of Experimental Psychology: General, 126(3): 211–227.
- Rubenstein H., Lewis S.S., Rubenstein M.A. 1971. Evidence for phonemic recoding in visual word recognition. Journal of Verbal Learning and Verbal Behavior, 10: 645–657.
- Rudner M., Foo C., Sundewall-Thoren E., Lunner T., Rönnberg J. 2008. Phonological mismatch and explicit cognitive processing in a sample of 102 hearing-aid users. International Journal of Audiology, 47: S91–S98.
- Rudner M., Rönnberg J., Lunner T. 2011. Working memory supports listening in noise for persons with hearing impairment. Journal of the American Academy of Audiology, 22(3): 156–167.
- Rönnberg J. 2003. Cognition in the hearing impaired and deaf as a bridge between signal and dialogue: a framework and a model. International Journal of Audiology, 42: S68–S76.
- Rönnberg J., Danielsson H., Rudner M., Arlinger S., Sternang O., Wahlin A., et al. 2011. Hearing loss is negatively related to episodic and semantic long-term memory but not to short-term memory. Journal of Speech Language and Hearing Research, 54(2): 705–726.
- Rönnberg J., Lyxell B., Arlinger S., Kinnefors C. 1989. Visual evoked potentials: relation to adult speechreading and cognitive function. Journal of Speech and Hearing Research, 32: 725–735.
- Rönnberg J., Rudner M., Foo C., Lunner T. 2008. Cognition counts: a working memory system for ease of language understanding (ELU). International Journal of Audiology, 47: S99–S105.
- Sauzeon H., Lestage P., Raboutet C., N'Kaoua B., Claverie B. 2004. Verbal fluency output in children aged 7–16 as a function of the production criterion: qualitative analysis of clustering, switching processes, and semantic network exploitation. Brain and Language, 89(1): 192–202.
- Snowling M., Nation K., Moxham P., Gallagher A., Frith U. 1997. Phonological processing skills of dyslexic students in higher education: a preliminary report. Journal of Research in Reading, 20: 31–41.
- Tallberg I.M., Carlsson S., Lieberman M. 2011. Children's word fluency strategies. Scandinavian Journal of Psychology, 52(1): 35–42.
- Tallberg I.M., Ivachova E., Tinghag K.J., Ostberg P. 2008. Swedish norms for word fluency tests: FAS, animals and verbs. Scandinavian Journal of Psychology, 49(5): 479–485.
- Troyer A.K. 2000. Normative data for clustering and switching on verbal fluency tasks. Journal of Clinical and Experimental Neuropsychology, 22(3): 370–378.
- Troyer A.K., Moscovitch M., Winocur G. 1997. Clustering and switching as two components of verbal fluency: evidence from younger and older healthy adults. Neuropsychology, 11(1): 138–146.
- Troyer A.K., Moscovitch M., Winocur G., Alexander M.P., Stuss D. 1998. Clustering and switching on verbal fluency: the effects of focal frontal- and temporal-lobe lesions. Neuropsychologia, 36(6): 499–504.
- Tröster A.I., Fields J.A., Testa J.A., Paul R.H., Blanco C.R., Hames K.A., et al. 1998. Cortical and subcortical influences on clustering and switching in the performance of verbal fluency tasks. Neuropsychologia, 36(4): 295–304.
- Unsworth N., Spillers G.J., Brewer G.A. 2011. Variation in verbal fluency: a latent variable analysis of clustering, switching, and overall performance. Quarterly Journal of Experimental Psychology, 64(3): 447–466.
- Van der Elst W., Van Boxtel M.P.J., Van Breukelen G.J.P., Jolles J. 2006. Normative data for the Animal, Profession and Letter M Naming verbal fluency tests for Dutch speaking participants and the effects of age, education, and sex. Journal of the International Neuropsychological Society, 12(1): 80–89.
- van Hooren S.A.H., Anteunis L.J.C., Valentijn S.A.M., Bosma H., Ponds R., Jolles J., et al. 2005. Does cognitive function in older adults with hearing impairment improve by hearing aid use? International Journal of Audiology, 44(5): 265–271.
- Weiss E.M., Ragland J.D., Brensinger C.M., Bilker W.B., Deisenhammer E.A., Delazer M. 2006. Sex diffierences in clustering and switching in verbal fluency tasks. Journal of the International Neuropsychological Society, 12(4): 502–509.
- Wixted J., Rohrer D. 1994. Analyzing the dynamics of free recall: an integrative review of the empirical literature. Psychonomic Bulletin & Review, 1: 89–106.