
Abstract
Objective:
To assess the economic burden of tyrosine kinase inhibitor (TKI) treatment failure in chronic myeloid leukemia (CML), by assessing all-cause health care resource use (HCRU) and costs in the year after treatment failure by line of therapy (LOT; 1L/2L/3L) using real-world data.
Methods:
Treatment episodes initiating a TKI of interest (index TKI) during June 2008–December 2011 were identified from the IMS PharMetrics Plus Health Plan Claims Database for adult patients with CML diagnosis (ICD-9-CM 205.1x), 120 days pre-index continuous enrollment (CE) and no clinical trial participation. Episodes experiencing treatment failure, defined as switch to a non-index TKI or discontinuation of index TKI (gap of ≥ 60 days), and with 1 year CE post-failure, were analyzed. LOT was determined by number of unique TKIs used in the pre-index. All-cause HCRU and costs (2012 USD) in the 1 year post-failure were assessed by LOT, and the comparisons between 1L and 2L failures were also adjusted using multivariate generalized linear models (GLMs) to control for underlying differences.
Results:
A total of 706 episodes were identified (518 1L; 180 2L; 8 3L). Unadjusted HCRU over 1 year post-failure increased significantly. This was accompanied by a significant increase in unadjusted mean costs for 2L failures vs. 1L failures ($99,624 vs. $78,667, p = 0.021, Δ$20,957). Following the adjustment using GLMs, adjusted mean costs were 38% higher (95% CI 1.14–1.68), driven primarily by use of medical services. In adjusted analyses, compared to 1L, 2L failures had: 45% more ambulatory visits (mean 31 vs. 21, 95% CI 1.26–1.66), 75% higher risk of hospitalization (33% vs. 23% hospitalized, 95% CI 1.16–2.64), and 73% higher medical costs (95% CI 1.31–2.29). Medical costs comprised a greater proportion of total costs in 2L vs. 1L (55% vs. 44%); pharmacy costs did not increase significantly.
Conclusions:
The economic burden over 1 year post TKI failure increased with each sequential line of TKI treatment failure.
Introduction
Tyrosine kinase inhibitors (TKIs), oral agents that are the standard of care for patients with chronic myeloid leukemia (CML), target the abnormal BCR-ABL protein that drives the proliferation of white blood cellsCitation1. Between 2008 and 2011 (the selection period of this study), three TKIs were available which had been approved for use in CML: imatinib, dasatinib and nilotinib. Imatinib was approved by the US Food and Drug Administration (FDA) in 2002 for first-line (1L) useCitation2. Dasatinib and nilotinib were initially approved in 2006 and 2007, respectively, for second-line (2L) use following imatinib failure due to resistance or intolerance, and later approved for 1L use (both in 2010)Citation3,Citation4. By the end of 2012, two additional TKIs, bosutinib and ponatinib were approved in resistant and intolerant CMLCitation5,Citation6.
Treatment failure due to resistance or intolerance to TKI therapy is a major challenge in the management of CMLCitation7–9. Selection of the appropriate TKI treatment to manage CML requires balancing pharmacologic and medical care costs, efficacy, and safety of therapy options. Overtreatment and undertreatment with TKIs are also potential concerns in the management of CMLCitation10. For example, for a low-risk patient in chronic phase, imatinib may be indicated initially, and it is important to avoid overtreatment with a more powerful TKI (e.g., dasatinib or nilotinib) upfront in the disease course. Critical issues to be considered to prevent overtreatment and undertreatment include presentation and course of CML, patient characteristics and comorbidities, and the different TKI toxicity profiles. Additionally, patient quality of life (QoL) and symptom burden are also important considerations in TKI selection. For instance, compared to controls without CML, CML patients on TKI therapy are more likely to report significantly worse symptoms such as fatigue, depression and nausea, as well as significantly worse symptom burden, role limitations and physical QoLCitation11,Citation12. Initiating a therapy that is ineffective may result in resistance or intolerance (i.e., treatment failure) followed by substantial economic consequences, which may increase for patients failing multiple therapy lines. To better understand the value of efficacious TKI treatment, there is a need to understand the economic consequences of treatment choice and of repeated TKI treatment failureCitation13.
Clinical trials have shown increased occurrences of treatment failure by line of therapy (LOT), with 14–33% of patients discontinuing 1L therapy by approximately 2 years post-initiation, 41–61% discontinuing 2L therapy by 2 years, 44% discontinuing third-line (3L) nilotinib at 1 year, and 82% discontinuing 3L dasatinib at 16 monthsCitation14–19. Several studies have examined health care resource use (HCRU) and costs of managing CML for the overall CML population (regardless of LOT or treatment outcome), for specific sub-groups (1L imatinib users, or 2L dasatinib and nilotinib users) or by TKI generation (first generation vs. second generation)Citation20–24. Only one study has evaluated the economic burden of TKI treatment failure versus successfully remaining on TKI therapyCitation25. Although this study provides evidence of substantial treatment failure burden, to date and to our knowledge, no real-world studies have quantified and compared the economic burden of TKI treatment failure by LOT.
The study objective was to assess the economic burden of TKI treatment failure in terms of HCRU and associated costs over the 1 year following TKI treatment failure by LOT (1L, 2L, or 3L).
Methods
Data source
This retrospective study utilized data between 1 March 2008 and 31 December 2012 (‘study window’) from the IMS PharMetrics Plus Health Plan Claims Database, which comprises adjudicated health plan claims data for >150 million unique health plan members, and is nationally representative of the commercially insured US population in terms of age and gender. Data are available from 2006 onward. Standard fields include inpatient and outpatient diagnoses and procedures, prescription records, provider details (e.g., specialty, zip code, etc.), dates of service, demographics, and start and stop dates of health-plan enrolment. All data are HIPAA compliant to protect patient privacy.
Study design
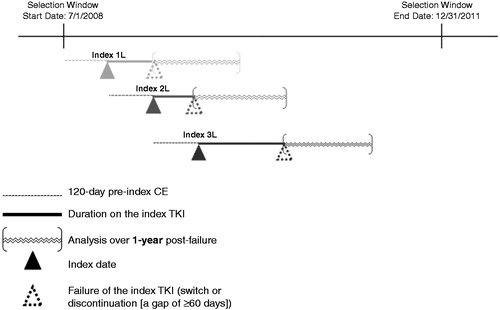
To maximize the use of available data, the analysis was conducted at the TKI treatment episode levelCitation26. Treatment episodes for patients with CML receiving a TKI of interest (1L imatinib; or 1L, 2L or 3L dasatinib or nilotinib) were identified for treatment initiated between 1 July 2008 and 31 December 2011 (‘selection window’; ). The initiated TKI was termed ‘index TKI’, and the date of initiation was termed ‘index date’ for that treatment episode. Because a patient could initiate more than one TKI during the selection window, a patient could contribute more than one treatment episode (e.g. a patient who initiated 1L imatinib and then 2L dasatinib could contribute both a 1L and 2L treatment episode). The number of unique non-index TKIs used within the fixed 120 day period prior to the index date (‘pre-index’) was tallied to define LOT (1L: no pre-index TKI used; 2L: one pre-index non-index TKI used; 3L: two pre-index non-index TKIs used), consistent with prior studiesCitation21,Citation25. Use of imatinib in 1L only, per its label indication, was included; while dasatinib and nilotinib were included in 1L or 2L, per label indication, as well as in 3L due to the potential for off-label 3L use following the failure of the alternative TKI in 2L.
Figure 1. Treatment episode example. The above is just an example of treatment episode identification at the patient level to illustrate a potential sequence of treatment. 1L = first line; 2L = second line; 3L = third line; CE = continuous health plan enrollment.
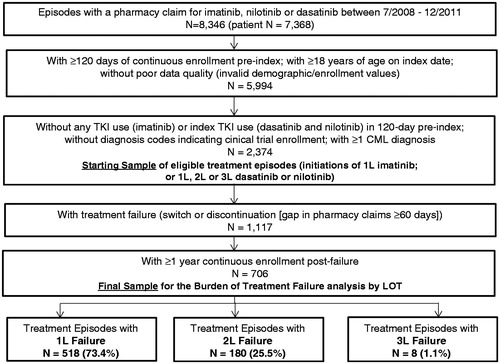
Treatment episodes were included in the study for patients meeting the following eligibility criteria (): CML diagnosis (ICD-9-CM 205.1x) pre-index or 360 day post-index, ≥120 days of continuous health plan enrollment (CE) pre-index, 18 + years of age at index, and no evidence of clinical trial enrollment or participation (ICD-9-CM V70.7x) at any time within the study window. It is possible that a patient contributed more than one treatment episode, and thus, had more than one index date, and eligibility criteria were evaluated over different time periods for each episode contributed by that patient.
Figure 2. Study sample selection flow. 1L = first line; 2L = second line; 3L = third line; CML = chronic myeloid leukemia; TKI = tyrosine kinase inhibitor; LOT = line of therapy.
Treatment failure was assessed among eligible TKI treatment episodes, starting from the index date to the end of available follow-up (i.e., end of patient’s CE or selection window [31 December 2011], whichever occurred first); where treatment failure was defined as a switch to a non-index TKI or discontinuation (defined as a gap in pharmacy claims of index TKI for ≥60 days). The ‘date of treatment failure’ was defined as the prescription date of non-index TKI (if switch) or the end of days supplied by the last index TKI prescription before the gap (if discontinuation). The criterion of gap of 60 days of supply was derived based on clinical expert opinion (e.g., a 15–30 day gap or ‘treatment holiday’ may be appropriate for a treatment interruption due to intolerance) and sensitivity analysis to test for the gap threshold ranging from 30 to 90 days, which showed that the gap threshold of 60 days achieved a good balance between identifying patients who did not subsequently resume index TKI (potential drug holiday) and maximizing sample size. For example, a gap of 1.5 times the days’ supply of the prior prescription has been utilized to define treatment interruption/non-persistence in CMLCitation27. We found that almost all patients (∼90% or more) had TKI prescriptions with days’ supply of 28/30 days. We therefore examined the 45 day cutoff to define discontinuation among the initial sample applying only minimal eligibility criteria (with CML diagnosis, without the index TKI in the pre-index and with at least 360 days of post-failure continuous enrollment) to understand the impact on sample size with sufficient follow-up. We also examined time to index therapy restart among patients who restarted (an important impact of intolerance). With a 45 day cutoff, 1044 episodes of failure were identified, with 49.7% (519 out of 1044) restarting the index drug within an average of 132 days. We explored the expansion of the threshold by 15 more days (from 45 to 60 days) which removed 70 patients from the discontinuer group in total (from 1044 to 974) and primarily affected patients with restart within 90 days. Thus, we selected the gap threshold of 60 days, which has also been used to define discontinuation in other studies of TKIs in CMLCitation25,Citation28. The final sample for the HCRU and cost analysis consisted of eligible episodes that resulted in treatment failure and that had ≥1 year CE following the date of treatment failure, termed the 1 year ‘post-failure’.
Study measures
Treatment failure
Among the starting sample of eligible TKI treatment episodes, we assessed the proportion of treatment episodes resulting in treatment failure by 6 months, 1 year, 2 years and 3 years of follow-up, as well as time to treatment failure from index date, and reported for each LOT.
Baseline measures (pre-index and at index)
Baseline demographic characteristics as of the index date are reported for the patients contributing treatment episodes resulting in failure for each LOT. Clinical characteristics were assessed in the 120 days pre-index, and include common and CML-related comorbidities informed by the literature, Charlson Comorbidity Index (CCI), and two validated disease measures defined by ICD-9-CM diagnosis codes: ‘CML severity’ to measure active CML and CML-related comorbidities or complications, and ‘cancer complexity’ to assess difficulty in managing a patient’s tumorCitation21,Citation22. In addition, pre-index total health care costs were assessed.
Follow-up measures
All-cause HCRU and costs were measured over the 1 year post-failure. HCRU was categorized in two major service groups: pharmacologic (TKI and non-TKI prescriptions) and medical (non-pharmacologic) services. Medical services comprised inpatient, emergency room (ER), ambulatory and lab tests and other services categories. The ambulatory services category comprised services received at outpatient offices and surgical centers. The lab tests and other services category comprised lab and pathology, radiology, injections, and all other ancillary services. Analytical measures included flags (yes or no) to indicate use of specific HCRU services, and quantities among those who had utilization of a service (e.g., number of outpatient pharmacy prescriptions [overall, and also separately for TKI and non-TKI], inpatient stays and days, ER visits, office visits, lab tests). The allowed amounts reported by payers (including copays and coinsurance) were summed to determine health care costs over the 1 year post-failure. All costs were adjusted to 2012 US dollars using the medical care component of the US Consumer Price IndexCitation29.
Statistical analysis
Descriptive statistics (counts, proportions [%], means, standard deviations [SD], and medians) were used to characterize the study measures for episodes grouped by LOT. Statistical comparisons were two-tailed at an alpha level of p = 0.05 between 1L and 2L failures only. Chi-square test was used for categorical variables, and Student’s t-test and Wilcoxon rank-sum test were used for continuous or count variables. Statistical analyses did not include the 3L data, due to its small sample size; however, unadjusted data are presented for 3L to provide real-world data on this poorly understood population.
Generalized linear models (GLMs) were developed to compare marginal effects between 1L and 2L failures and to provide estimates of HCRU and costs adjusting for patient characteristics that may otherwise confound the relationship between LOT and HCRU/costs: age, gender, geographic region at index; CML severity, cancer complexity, comorbidities (anemia, chronic pulmonary disease, depression, diabetes, fluid electrolyte disorders, hyperlipidemia, renal failure, solid tumor, and valvular heart disease), and log of pre-index health care costs. The pre-index rather than pre-failure characteristics were used in the models to ensure that we were adjusting for confounding by baseline patient characteristics rather than for characteristics related to the treatment failure itself (e.g., worsening CML symptoms, adverse events.) A recycled-prediction method was used to predict mean adjusted values in natural units (e.g., dollars, visits) by LOTCitation30. Adjusted estimates for HCRU were assessed for mean number of encounters or prescriptions (using negative binomial distribution with log link function), and for proportion (%) of episodes with ≥1 hospitalization or ER visit (using binomial distribution with logit link function) due to small numbers of inpatient or ER events. Adjusted mean cost estimates also were generated for total health care and separately for medical and pharmacy services, based on GLM regression models with a gamma distribution and a log link function. Analyses were conducted using SAS Release 9.2 (SAS Institute Inc., Cary, NC, USA).
Results
Study sample
A total of 2374 episodes (contributed from 2009 unique patients) of TKI treatment initiation were identified. depicts the selection flow of the study sample by eligibility criteria. Of the 2374 episodes, 1117 (47.1%) had evidence of treatment failure from index date to end of available follow-up. Of the 1117 episodes, 706 episodes (contributed from 597 unique patients) had CE for ≥1 year post-failure and comprised the final sample to estimate the economic burden over the 1 year post-failure. The 706 episodes comprised 518 1L, 180 2L, and 8 3L episodes.
Treatment failure
Failure of treatment within 3 months, 6 months and 1 year post-index increased with each LOT (). This pattern continued thereafter at 2 years and 3 years following index for 1L and 2L; however, there was inadequate sample size to assess 3L failures at 2 and 3 years. Days from TKI initiation to treatment failure decreased from 1L to 2L, with 1L failure occurring in a median of 125 days vs. 90 days for 2L (p < 0.001); the eight 3L failures failed in a median of 45 days.
Table 1. Proportion failing treatment at specific timepoints among treatment episodes of TKI Initiation by LOT.
Patient characteristics
Demographic characteristics at index, including age, gender and geographic region were similar in 1L and 2L failure; however, select comorbidities (diabetes, hyperlipidemia and hypertension) were higher among 1L patients and CCI and CML severity scores more evenly distributed across categories in 1L than in 2L. Pre-index costs were higher in 2L ().
Table 2. Baseline characteristics of the final sample with TKI treatment failure by line of therapy.
Health care resource utilization (HCRU)
The unadjusted estimates of HCRU in 1L versus 2L over the 1 year post-failure are presented in . Second-line failures were associated with significantly more pharmacy fills (i.e., dispensed prescriptions) compared to 1L failures. This was driven by more non-TKI pharmacy fills (38.2 vs. 31.4, p = 0.023), while TKI pharmacy fills were similar (6.0 vs. 5.6, p = 0.252). Third-line failures had a mean of 63.0 total fills post-failure. Second-line failures also had significantly higher use of several medical service types compared to 1L failures: they were 34% more likely to have ≥1 hospitalization, had 25% more visits to physician offices (including 39% more oncologist or hematologist office visits [mean 6.7 vs. 4.8 visits, p = 0.008]), had 60% more visits to outpatient surgical centers, and underwent 37% more lab tests and other services, driven by 40% more lab and pathology services.
Table 3. Unadjusted health care resource utilization in the 1 year post-failure..
After controlling for demographic and clinical characteristics, compared to 1L failures, 2L failures continued to have significantly higher HCRU of ambulatory visits and hospitalizations (). Consistent with the unadjusted findings, 2L failures had 45% more ambulatory visits and 75% higher odds of being hospitalized compared to 1L failures, while odds of having an ER visit were similar.
Table 4. Adjusted health care resource utilization and costs in the 1 year post treatment failure.
Health care costs
Compared to failures of 1L TKI, 2L failures incurred 27% higher average costs in the 1 year post-failure (). The majority (74%) of the cost difference was attributable to medical services. Total costs were substantial for the small number of 3L failures in our sample, at a mean of $181,029 (standard deviation $185,854) with medical services contributing 81.1% of the total. depicts total health care costs by LOT and service component.
Figure 3. Unadjusted mean health care costs in the 1 year post TKI treatment failure by line of therapy. 1L = first line; 2L = second line; 3L = third line; ‘Medical’ = costs for medical (nonpharmacologic) services; ‘Outpatient Pharmacy’ = costs for pharmacy claims.
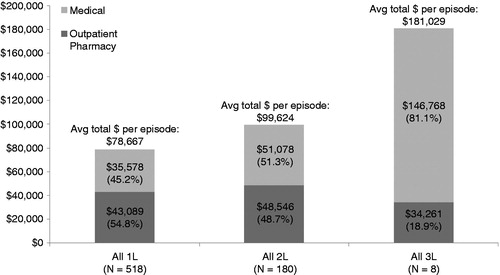
Table 5. Unadjusted health care costs in the 1 year post TKI treatment failure.
Second-line failures had only nominally higher total outpatient pharmacy cost and cost for medical services compared to 1L failures. However, 2L failures had significantly higher costs for specific medical services: physician office visits, and lab and pathology services. Compared to 1L failures, a higher proportion of 2L failures (4.4% [n = 8] vs. 1.9% [n = 10], p = 0.006) received bone marrow transplant or hematopoietic stem cell transplantation (BMT/HSCT) in the 1 year post-failure. Among patients with BMT/HSCT, associated costs for BMT/HSCT services were substantial (mean $226,669 1L, $243,435 2L and $210,612 3L [n = 1]).
After adjustment, 2L failures continued to have significantly higher mean total costs, 38% more than 1L failures (). Adjusted costs for medical services in total and component ambulatory services became significantly higher among 2L failures than 1L failures: 73% higher costs for medical services, including 39% higher costs for ambulatory services. Outpatient pharmacy costs remained similar between 2L and 1L failures.
Discussion
This study, examining the economic burden of failure of TKI treatment for CML using US health care claims data, suggests an increasing burden of treatment failure with each subsequent LOT. The proportions of episodes with TKI treatment failure by 1 year post-initiation increased with each subsequent LOT (1L 34.6%, 2L 43.0%, and 3L 55.6%), and the duration in days from TKI initiation to failure decreased by LOT (median 1L: 125 days vs. 2L: 90 days, p < 0.001; 3L 45 days), such that, with each subsequent therapy line, more patients were likely to fail and in a shorter period of time. Among the treatment episodes that resulted in therapy failure, inpatient and ambulatory service HCRU and total costs in the 1 year post-failure were significantly higher in 2L compared to 1L failure, in both adjusted and unadjusted analyses. Higher costs for medical services were the primary driver of the higher treatment failure cost burden in later LOT, comprising 45.2% of 1L, 51.3% of 2L, and 81.1% of 3L total costs. Pharmacy costs were similar between 1L and 2L failures. The observed increase in oncologist/hematologist office visits, use of laboratory/other services (driven by lab and pathology tests), and non-TKI pharmacy fills between 1L and 2L suggest greater need for medical management of worsening CML disease and symptoms, comorbidities and complications, and/or drug side effects.
Real-world evidence quantifying the cost of TKI treatment failure is limited, with previous studies reporting outcomes for patients with CML as a whole or for patients using specific TKIs rather than the costs associated with failureCitation20–24. Iyer et al. estimated the overall HCRU and costs of 2583 patients with CML, regardless of LOT or treatment type (including non-TKI therapy), using claims data in the years 2002–2009 in the US, and found a 1 year mean total cost of $64,441Citation20. This estimate is lower than the 1 year mean costs found in our population of 1L failures ($78,667), which is expected since we used more recent data, focused on TKI-treated patients, and targeted patients with treatment failure. Another recent study by the authors using the IMS PharMetrics Plus database (2008–2012) quantified the economic burden of TKI treatment failure among episodes of TKI treatment failure matched to those without failure in the 1 year following TKI initiationCitation25. This study combined data for failure episodes across all lines of therapy, and estimated a 1 year cost among failures of $103,857. This estimate is within the range of our estimates for first-line through third-line failure ($78,667–$181,029), and similar to our estimate for second-line failure ($99,624).
It is important to note the limitations with respect to data source and study design. Claims data used in this study were collected for adjudicating payment and not for research purposes; therefore, they do not provide the clinical details to distinguish patients discontinuing therapy due to resistance versus intolerance or to definitively confirm the lack of drug effectiveness (i.e., response to therapy). However, discontinuation or switch of a TKI therapy may reasonably be considered as a proxy for treatment failure when relevant, defining clinical data are unavailable. It is also possible that a patient we identified as having treatment failure based on discontinuation could have discontinued the therapy due to financial reasons rather than due to resistance or intolerance. While our analysis did not capture patient out-of-pocket costs, the evidence is equivocal with regard to the association between patient cost-sharing and adherence to TKI therapy in CMLCitation28,Citation31. Additionally, claims data do not capture unreimbursed medical expenses, indirect costs or quality of life impacts, which may substantially increase the burden of disease and treatment; including these outcomes likely would have increased the burden of TKI failure. Despite these limitations, claims data have the benefit of providing a longitudinal view of a patient’s interactions with the health care system across treatment sites, and can be assumed to accurately reflect prescriptions, tests, procedures, and services provided to the commercially insured patient. It is another limitation that our analysis was not designed to examine or compare specific treatment outcomes between individual TKIs such as efficacy, adverse treatment outcomes, or etiology of specific adverse events. While we examined health care utilization and costs, the impact of TKI toxicity (such as vascular adverse events) on the economic burden of TKI failure remains unknown. Additionally, given the study design and selection window (2008–2012), we were unable to investigate outcomes for the TKIs introduced in 2012, bosutinib and ponatinib, or how treatment failure and the associated burden may have changed since their introduction.
We further note that, because the unit of analysis in our study was the treatment episode rather than the patient, a number of patients contributed more than one episode and there may be overlap in the periods over which study measures are evaluated (e.g., the 1 year post-failure following 1L failure may overlap with baseline 2L measures, or potentially even the beginning of the 1 year post-failure following 2L failure). While this method may lead to some correlation in the episodes examined across different therapy lines, it was judged that this approach provided the least biased sample of all CML treatment episodes, and best allowed us to capture the full downstream and sequential costs of failure for the most patients.
In addition, continuous health plan enrollment was required for inclusion in the study to eliminate the impact of insurance coverage interruptions in estimating HCRU and costs; however, this requirement may exclude patients who disenroll due to changes in employment, death, or for other reasons that make them different from the remaining sample. The exclusion of patients who died may also bias the analysis towards a healthier sample. Thus, results presented in this study may be a conservative estimate of the economic burden of TKI treatment failure. A further limitation relates to LOT, defined based on the number of unique non-index TKIs used in the 120 days pre-index. This 120 day period is unlikely to capture all previously used TKI therapies before index and, in fact, our analysis suggests that only about 40% of the patients failing within 3 years will have failed at 6 months. For this reason, we may be misclassifying episodes to earlier therapy lines. However, because this misclassification would likely make the cost in the different therapy lines more similar, the reported increase in burden between 1L and 2L failure remains valid to estimate the growing burden with sequential failures. We further note that this LOT definition resulted in the identification of very few 3L patients, and these patients may not be typical of the 3L population; however, results for this population are presented descriptively, given the limited previously published data to characterize this population.
Conclusions
The economic burden in the 1 year after TKI treatment failure in patients with CML increases by line of therapy, primarily driven by higher utilization of medical (i.e., non-pharmacologic) services and associated costs. This suggests that costs are driven by the increased need for medical management of CML, comorbidities, and side effects, over therapy lines. The observed growing economic burden to the health care system with each subsequent TKI failure shows the importance of identifying effective therapy as early as possible in CML treatment.
Transparency
Declaration of funding
This study was funded by ARIAD Pharmaceuticals Inc.
Declaration of financial/other relationships
L.J.M., H.H., and C.C.N. have disclosed that they are employees and shareholders of ARIAD. C.R.T. has disclosed that she was employed by ARIAD at the time of the study and is a shareholder of ARIAD. V.D. and J.M. have disclosed that they are employed by IMS Health, which received funding from ARIAD for this study. Y.J.C. and S.P. have disclosed that they were employed by IMS Health at the time of the study. E.J. has disclosed that he is employed by the MD Anderson Cancer Center and was a consultant to ARIAD on this study. D.C.M. has disclosed that he is employed by Strategic Therapeutics LLC and University of Arizona College of Pharmacy and was a consultant to IMS on this study.
CMRO peer reviewers on this manuscript have received an honorarium from CMRO for their review work. Peer reviewer 1 has disclosed that he has received grants from Novartis; is an advisor to BMS and is on the Speakers’ Bureau of Novartis. Peer reviewer 2 has no relevant financial or other relationships to disclose.
References
- Smith CC, Shah NP. Tyrosine kinase inhibitor therapy for chronic myeloid leukemia: approach to patients with treatment-naive or refractory chronic-phase disease. Hematology Am Soc Hematol Educ Program 2011;2011:121-7
- Gleevec [package insert]. Novartis Pharmaceuticals Corp., East Hanover, NJ, USA. January 2015. Available at: http://www.pharma.us.novartis.com/product/pi/pdf/gleevec_tabs.pdf [Last accessed 19 October 2015]
- Sprycel [package insert]. Bristol-Myers Squibb Co., Princeton, NJ, USA. August 2015. Available at: http://packageinserts.bms.com/pi/pi_sprycel.pdf [Last accessed 19 October 2015]
- Tasigna [package insert]. Novartis Pharmaceuticals Corp., East Hanover, NJ, USA. October 2015. Available at: http://www.pharma.us.novartis.com/product/pi/pdf/tasigna.pdf [Last accessed 19 October 2015]
- Bosulif [package insert]. Pfizer Inc., NY, NY, USA. September 2015. Available at: http://labeling.pfizer.com/ShowLabeling.aspx?id=884 [Last accessed 19 October 2015]
- Iclusig [package insert]. ARIAD Pharmaceuticals Inc., Cambridge, MA, USA. September 2014. Available at: http://iclusig.com/hcp/wp-content/uploads/2014/10/October-2014-Iclusig-Prescribing-Information.pdf [Last accessed 19 October 2015]
- Santos FP, Kantarjian H, Quintás-Cardama A, Cortes J. Evolution of therapies for chronic myelogenous leukemia. Cancer J 2011;17:465-76
- Jabbour E, Cortes J, Kantarjian H. Long-term outcomes in the second-line treatment of chronic myeloid leukemia: a review of tyrosine kinase inhibitors. Cancer 2011;117:897-906
- Jabbour EJ, Cortes JE, Kantarjian HM. Resistance to tyrosine kinase inhibition therapy for chronic myelogenous leukemia: a clinical perspective and emerging treatment options. Clin Lymphoma Myeloma Leuk 2013;13:515-29
- Haznedaroglu IC. Current concerns of undertreatment and overtreatment in chronic myeloid leukemia based on European LeukemiaNet 2013 recommendations. Expert Opin Pharmacother 2013;14:2005-10
- Efficace F, Baccarani M, Breccia M, et al. Health-related quality of life in chronic myeloid leukemia patients receiving long-term therapy with imatinib compared with the general population. Blood 2011;118:4554-60
- Phillips KM, Pinilla-Ibarz J, Sotomayor E, et al. Quality of life outcomes in patients with chronic myeloid leukemia treated with tyrosine kinase inhibitors: a controlled comparison. Support Care Cancer 2013;21:1097-103
- Experts in Chronic Myeloid Leukemia. The price of drugs for chronic myeloid leukemia (CML) is a reflection of the unsustainable prices of cancer drugs: from the perspective of a large group of CML experts. Blood 2013;121:4439-42
- O’Brien SG, Guilhot F, Larson RA, et al. Imatinib compared with interferon and low-dose cytarabine for newly diagnosed chronic-phase chronic myeloid leukemia. N Engl J Med 2003;348:994-1004
- Kantarjian HM, Hochhaus A, Saglio G, et al. Nilotinib versus imatinib for the treatment of patients with newly diagnosed chronic phase, Philadelphia chromosome-positive, chronic myeloid leukaemia: 24-month minimum follow-up of the phase 3 randomised ENESTnd trial. Lancet Oncol 2011;12:841-51
- Kantarjian HM, Giles FJ, Bhalla KN, et al. Nilotinib is effective in patients with chronic myeloid leukemia in chronic phase after imatinib resistance or intolerance: 24-month follow-up results. Blood 2011;117:1141-5
- Shah NP, Kim DW, Kantarjian H, et al. Potent, transient inhibition of BCR-ABL with dasatinib 100 mg daily achieves rapid and durable cytogenetic responses and high transformation-free survival rates in chronic phase chronic myeloid leukemia patients with resistance, suboptimal response or intolerance to imatinib. Haematologica 2010;95:232-40
- Giles FJ, Abruzzese E, Rosti G, et al. Nilotinib is active in chronic and accelerated phase chronic myeloid leukemia following failure of imatinib and dasatinib therapy. Leukemia 2010;24:1299-301
- Garg RJ, Kantarjian H, O’Brien S, et al. The use of nilotinib or dasatinib after failure to 2 prior tyrosine kinase inhibitors: long-term follow-up. Blood 2009;114:4361-8
- Iyer S, Trask PC, Siu G, Mardekian J. Health care resource utilization and cost in patients with chronic myeloid leukemia in a privately insured patient population in the United States. Blood (ASH Annual Meeting Abstracts) 2011;118:Abstract 4220
- Wu EQ, Johnson S, Beaulieu N, et al. Healthcare resource utilization and costs associated with non-adherence to imatinib treatment in chronic myeloid leukemia patients. Curr Med Res Opin 2010;26:61-9
- Darkow T, Henk HJ, Thomas SK, et al. Treatment interruptions and non-adherence with imatinib and associated healthcare costs: a retrospective analysis among managed care patients with chronic myelogenous leukaemia. Pharmacoeconomics 2007;25:481-96
- Wu EQ, Guerin A, Yu AP, et al. Retrospective real-world comparison of medical visits, costs, and adherence between nilotinib and dasatinib in chronic myeloid leukemia. Curr Med Res Opin 2010;26:2861-9
- Ward MA, Fang G, Richards KL, et al. Comparative evaluation of patients newly initiating first-generation versus second-generation tyrosine kinase inhibitors for chronic myeloid leukemia and medication adherence, health services utilization, and healthcare costs. Curr Med Res Opin 2015;31:289-97
- Knopf KB, Divino V, McGarry L, et al. Economic burden of tyrosine kinase inhibitor treatment failure in chronic myeloid leukemia. Clin Lymphoma Myeloma Leuk 2015; 15(11):e163-71. doi: 10.1016/j.clml.2015.07.647.Epub 2015 Aug 5
- Teitelbaum A, Ba-Mancini A, Huang H, Henk HJ. Health care costs and resource utilization, including patient burden, associated with novel-agent-based treatment versus other therapies for multiple myeloma: findings using real-world claims data. Oncologist 2013;18:37-45
- Trivedi D, Landsman-Blumberg P, Darkow T, et al. Adherence and persistence among chronic myeloid leukemia patients during second-line tyrosine kinase inhibitor treatment. J Manag Care Spec Pharm 2014;20:1006-15
- Dusetzina SB, Winn AN, Abel GA, et al. Cost sharing and adherence to tyrosine kinase inhibitors for patients with chronic myeloid leukemia. J Clin Oncol 2014;32:306-11
- US Bureau of Labor Statistics. Consumer Price Indexes (CPI) Program. Available at: http://www.bls.gov/cpi/ [Last accessed 5 March 2014]
- Basu A, Rathouz PJ. Estimating marginal and incremental effects on health outcomes using flexible link and variance function models. Biostatistics 2005;6:93-109
- Darkow T, Maclean JR, Joyce GF, et al. Coverage and use of cancer therapies in the treatment of chronic myeloid leukemia. Am J Manag Care 2012;18:S272-8