
Abstract
Background/aim: Ultra-orphan diseases (UODs) have been defined by a prevalence of less than 1 per 50,000 persons. However, little is known about budget impact of ultra-orphan drugs. Methods: For analysis, the budget impact analysis (BIA) had a time horizon of 10 years (2012–2021) and a pan-European payer’s perspective, based on prevalence data for UODs for which patented drugs are available and/or for which drugs are in clinical development. Results: A total of 18 drugs under patent protection or orphan drug designation for non-oncological UODs were identified. Furthermore, 29 ultra-orphan drugs for non-oncological diseases under development that have the potential of reaching the market by 2021 were found. Total budget impact over 10 years was estimated to be €15,660 and €4965 million for approved and pipeline ultra-orphan drugs, respectively (total: €20,625 million). Conclusion: The analysis does not support concerns regarding an uncontrolled growth in expenditures for drugs for UODs.
In the USA, in the EU as well as in Japan, Australia and some other jurisdictions, legislation has been adopted to encourage the development of treatments for rare or ‘orphan’ diseases. Under this legislation, developers and manufacturers of so-called orphan drugs used to treat orphan diseases benefit from a range of incentives, including reduced or waived licensing fees, extended market exclusivity periods and in the USA and Japan, tax relief on development costs.
In theory, there are no distinct (sub-)categories of orphan and ultra-orphan diseases (UODs) and treatments. Increasing rarity of a condition merely represents the end of a continuum, just like increasing severity and increasing comorbidities represent continuous, not discrete phenomena. For policy-makers, it may nevertheless be pragmatic to define different categories of diseases and interventions, irrespective of the (absence of) theoretical merits of such an approach.
‘Orphan disorders’ have been defined by the US and EU legislation. In the USA, these are diseases with a prevalence of fewer than 200,000 affected persons; in the EU, prevalence must be fewer than 5 per 10,000 (or less than 0.05%) of the population. Currently, no official definition of ‘ultra-orphan disorders’ has been adopted globally. Rather, this informal subcategory was introduced by NICE (formerly, the Institute for Health and Clinical Excellence, and the Institute for Clinical Excellence), which applied it to drugs with indications for conditions with a prevalence of fewer than 1 per 50,000 persons.
Many drugs developed to treat (ultra-)orphan diseases will not meet the cost–effectiveness thresholds stipulated by some official regulatory bodies such as NICE, that is, not to exceed a cost of £20,000 to £30,000 per quality-adjusted life-year gained. On the other hand, it is less clear how large cost–effectiveness ratios translate into a budget impact for payers. An analysis by Schey and collaborators predicted a modest share of orphan drugs as part of total pharmaceutical expenditures in Europe, reaching a maximum of 4.6% in 2016. Recent extensions of the model presented similar country-specific projections for France and Sweden, suggesting that in these countries orphan medications may account for 4.9 and 4.1% of total drug expenditure by 2020, respectively Citation[1].
An open question is how drugs for UODs as opposed to orphan drugs impact health expenditures in Europe. Given the inverse relationship between disease prevalence and annual per-patient orphan drug costs Citation[2,3], a lower number of patients affected could be compensated by higher per-patient costs. Therefore, it is a priori unclear whether the budget impact of drugs for UODs is smaller compared with orphan drugs due to the smaller patient population.
Health economists have expressed concern that drugs for orphan diseases ‘may impose substantial and increasing costs to the healthcare system’ Citation[4]. By multiplying annual costs of treatment and patient numbers it was calculated that it would cost up to US$6.9 billion in the USA alone, if ‘the five most expensive drugs in the world’ Citation[5] – all of which happen to be medications for UODs – were actually prescribed to all patients in the USA (ranging from 900 cases with glycogen storage disease type II to 8000 cases with paroxysmal nocturnal hemoglobinuria).
The goal of the present European study was therefore to conduct a budget impact analysis (BIA) of drugs for ultra-orphan non-oncological diseases in Europe (including all non-EU countries). The purpose of a BIA is to estimate the financial consequences of adoption and diffusion of a new healthcare intervention within a specific healthcare setting or system context given inevitable resource constraints Citation[6]. In contrast to the analysis by Schey et al. Citation[7], which forecasted future market entrants by extrapolating the number of current market entrants, we forecasted future market entrants based on the current drug pipeline. We focused on non-oncological diseases assuming that they are more likely to represent distinct disease entities with typically less off-label use (while acknowledging that this does not need to hold for each disease). Also the approved indications of cancer treatments are more often broadened over time Citation[8].
Methods
For purposes of this analysis, the BIA had a time horizon of 10 years (2012–2021) (since the data past 10 years are not reliable) and adopted a payer’s perspective. We included European countries regardless of whether they were EU Member States or not. The estimate was based on sales data of pharmaceutical companies as well as prevalence data for UODs for which drugs under patent protection or orphan drug designation are currently available (based on approval from the EMA), or for which drugs are currently in clinical development (based on the Medtrack patent database, Medtrack United States, New York, NY, USA). All input variables are listed in . We used averages across Europe and not country-specific data as our intention was not to provide country-specific estimates on budget impact.
Table 1. Base-case values and ranges used in the budget impact model and sensitivity analysis.
Drugs under patent protection or orphan drug designation
To identify drugs for UODs under patent protection or benefitting from market exclusivity conditions due to an active orphan drug designation by the end of 2012, which were approved by the EMA for non-oncological diseases, we applied a cutoff prevalence rate of 1:50,000 (0.002%) in the general population. When possible, we used prevalence data gathered by Orphanet Citation[9,10]. Alternatively, we relied on international or national data sources (mostly Western Europe and the USA) as listed in . Drugs licensed for both oncological and non-oncological use (e.g., cord blood transplants) were excluded as well as drugs for UODs without patent protection or an active orphan drug designation at the end of 2012.
Table 2. Drugs for ultra-orphan diseases under patent protection or benefitting from market exclusivity conditions due to an active orphan drug designation for non-oncological diseases.
Table 3. Pipeline drugs for ultra-orphan non-oncological diseases. Product names are listed when active substance names were unavailable or unspecific.
Information on patent expiration dates was obtained from the Medtrack database. We assumed a period of 10 years for market exclusivity.
As an approximation of payers’ expenditures, we used sales data of pharmaceutical companies. European sales data for each ultra-orphan drug was extrapolated from the US sales data due to limited data availability. To this end, we estimated the proportion of patients treated (penetration rate) in the USA from the prevalence rate and annual sales in the USA. We then calculated sales in Europe by considering European data on annual drug costs Citation[3], prevalence rate and penetration rate. As a reference value for the penetration rate in Europe, we used a 22% estimate by Schey et al. for orphan drugs. On the one hand, for drugs for UODs, uptake may be even lower due to even fewer patients correctly identified with a particular disease. On the other hand, uptake may increase in the future due to advances in genomic medicine leading to improved diagnosis. Therefore, we tested both a 10 and 30% penetration rate in the sensitivity analysis.
When estimated budget impact in Europe was above worldwide non-US sales, we used worldwide non-US sales as an estimate for European sales. In order to estimate budget impact for ultra-orphan drugs without information on the US sales data, we described the relationship between annual per-patient drug costs and prevalence based on existing data using a mathematical function. We then applied the function to ultra-orphan drugs without information on the US sales data, by predicting annual per-patient drug costs based on the prevalence data available for the target disease in question.
For UOD drugs with an indication for more than one UOD (i.e., eculizumab and miglustat), we were not able to separate sales data by indication. Therefore, we assumed that market exclusivity for all indications would last until expiration of market exclusivity for the last indication authorized.
Annual growth rate in sales volume was conservativelyFootnote1 assumed to be 10% based on a 7.7% estimate for the growth in global orphan drug sales between 2012 and 2018 Citation[11]. This growth captures a potential increase in the size of the eligible population as mortality may be reduced without curing the condition and disease awareness and diagnostic rates may improve. The assumption on future sales growth was also conservative with respect to potential future policy changes in the EU leading to lower prices of (ultra-)orphan drugs. Examples may be better exchange of information between EU Member States on the value of an (ultra-)orphan drug as well as joint procurement contracts through which several Member States can coordinate their purchase of (ultra-)orphan drugs.
While for the base case we assumed no generic competition after expiration of patents or market exclusivity based on evidence that orphan drugs have significantly less generic competition than other drugs Citation[12], we assumed generic entry in a sensitivity analysis. In order to estimate a price reduction after expiration of patents or market exclusivity (beyond the year 2012), we used information on a sample of medicines that faced generic entry in the period from 2000 to 2007 Citation[13]. Based on this source, we assumed average savings (as measured by a weighted price index of originator and generic products) of 20% 1 year after the first generic entry, and about 25% after 2 years.
Drugs under development
We identified pipeline drugs for non-oncological UODs from the Medtrack database as well. We also included drugs which are developed/tested for UODs but where the combined prevalence of all UODs is larger than 1:50,000 (e.g., lysosomal storage disorders). The reason is that ultimately in these cases the drug may be approved for only one of the UODs. Furthermore, we also included drugs which are currently tested for non-oncological UODs but are already approved for oncological diseases. Future sales volume for pipeline UOD drugs was estimated based on the relationship between annual per-patient drug costs and prevalence for approved drugs as described above. Given that in markets where competitors already exist prices and penetration rates may be lower, this is again a conservative assumption, thus potentially overestimating budget impact. Annual growth rate in sales volume was assumed to be the same as for approved drugs.
Clinical phase durations as well as transition probabilities between phases of drug development were based on data from the Tufts Center for the Study of Drug Development for all drugs. We assumed durations of 2, 1.5, 1.5 and 1.5 years for Phase I, Phase II and Phase III trials, and approval, respectively. While for some ultra-orphan drugs clinical phase durations might be shorter due to accelerated approval, for highly innovative technologies (e.g., antisense and gene therapy), they can be longer due to safety concerns Citation[14,15]. For transitions to Phase II, Phase III, New Drug Application (NDA) submission and NDA approval, we assumed probabilities of 70.6, 45.4, 63.6 and 93.2%, respectively. Uncertainty of time and risk of development was again reflected in sensitivity analyses . Transition probabilities for ultra-orphan drugs may in fact be lower than for other drugs, particularly in case of challenging disease targets or particularly difficult methods of delivery (e.g., central nervous diseases and gene therapy). On the other hand, ultra-orphan drugs may be approved on the basis of Phase I/II studies. This was considered in a two-way sensitivity analysis, by setting the transition from Phase III to NDA submission to 100% and the duration of Phase III trials to zero .
Discount rate
The annual discount rate of costs (from a payer’s perspective) was assumed to be 3.5%, which is the average discount rate recommended by guidelines in England, Germany and the Netherlands. The discount rate was applied to the budget impact estimate as well as its reference values, that is, total pharmaceutical and total health expenditures in Europe, respectively (see below). As the analysis does not hold a commercial perspective, we did not apply the average company cost-of-capital.
Sensitivity analysis
To address uncertainty around the mean budget impact estimate, we conducted univariate sensitivity analyses. We also conducted a worst-case and best-case scenario analysis, where we used extreme values of the two most influential variables.
Results
We identified 18 drugs for non-oncological UODs under patent protection or benefitting from market exclusivity conditions due to an active orphan drug designation . Furthermore, we found 29 drugs for non-oncological UODs under development that have the potential of reaching the market by 2021 .
To estimate budget impact for UOD drugs without information on US sales data, we estimated the relationship between annual per-patient cost of drugs for ultra-orphan non-oncological diseases (total sales divided by the prevalence rate) and prevalence based on existing data. A power function with the following equation provided an excellent fit (R² = 0.92):
where C is annual per-patient drug costs in Euros and p is the prevalence per 100,000 persons.
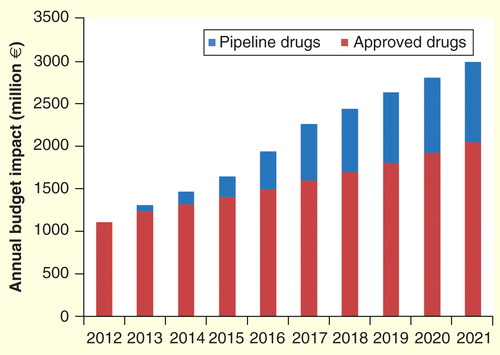
Total budget impact over 10 years was estimated to be €15,660 and €4965 million for approved and pipeline UOD drugs, respectively (total: €20,625 million). Yearly estimates are shown in . The increase in budget impact was 169% over the 10-year period from 2012 to 2021. The annual increase was 10%. Over a 5-year period, total budget impact was estimated to be €7483 million.
Figure 1. Annual budget impact of approved and pipeline drugs for ultra-orphan diseases over 10 years (2012–2021) in Europe from a payer’s perspective.
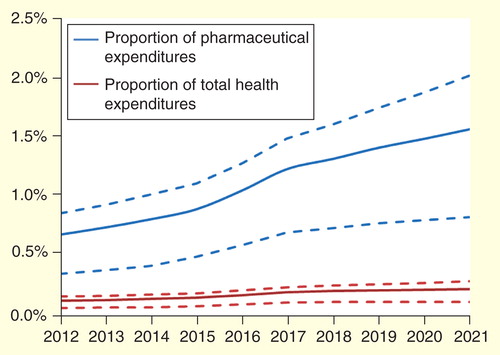
To set expenditures for UOD drugs in relation to total pharmaceutical expenditures in Europe, we used recent estimates by IMS Health on the pharmaceutical market size in Europe in 2012 (€163 billion) as well as on the expected annual growth rate (1.1%) Citation[16]. Results are shown in . Also, we set expenditures for ultra-orphan drugs in relation to total health expenditures in Europe , assuming that the past growth in EU health expenditures Citation[17] would continue in the future.
Figure 2. Proportion of pharmaceutical and total health expenditures in Europe spent on drugs for ultra-orphan diseases. Dashed lines indicate ranges provided by the extreme-case scenario analyses.
Sensitivity analysis
In the univariate sensitivity analysis, the variables with the largest impact on the budget impact were the market penetration rate and the annual growth rate in sales volume . The worst-case scenario analysis based on the two most influential variables yielded a budget impact of €31,149 million. The impact of uncertainty around the prevalence rate was estimated separately based on the above power function. Based on an elasticity of –0.623, a 10% increase in prevalence leads to a 6.23% decrease in price and a 3.1% (110 × 93.77%) increase in sales (budget impact). Finally, analyzing approval of ultra-orphan drugs on the basis of Phase I/II studies yielded a budget impact of €25,753 million.
Table 4. Univariate sensitivity analyses.
Discussion
Our analysis shows that based on patent expiries and a limited number of new market entrants, budget impact of ultra-orphan drugs for non-oncological diseases in Europe may be expected to increase at a modest rate only. The predicted average annual increase in budget impact is 10%, which translates into a 6% increase above the expected growth in total health expenditures. Growth is expected to level off after 2017. Relative to total pharmaceutical expenditures in Europe, spending on ultra-orphan drugs is estimated to be 0.7% at present and this share is expected to increase moderately after 2017. In this regard, it is important to remember that we assumed an annual growth rate of 10% for ultra-orphan drugs but of 1.1% only for non-UOD pharmaceuticals. Estimates were relatively robust to changes in the sensitivity analysis.
Using the estimate by Schey et al. as a basis, the predicted budget impact of drugs for ultra-orphan non-oncological diseases is 36% of the budget impact of orphan drugs for oncological and non-oncological diseases. We aimed to use conservative assumptions throughout, thus potentially overestimating budget impact. This may explain, in part, the relatively high share of predicted spending for drugs for UODs when judged against the forecast by Schey et al.
However, there are important differences between our study and that by Schey et al., that is, we did not consider oncological diseases, and we estimated the occurrence of new diseases based on actual data on the current drug pipeline. Still, our model is far from being perfect, but in BIAs this is rarely the case due to limited information availability Citation[18]. First, sales on drugs for UODs may present an overestimation because it cannot be excluded that a portion of sales is attributable to non-UOD. Second, although market exclusivity for orphan drugs is usually granted over a 10-year period, it may be extended to 12 years for pediatric products, or may be reduced to 6 years if, at the end of the 5th year of exclusivity, the drug no longer satisfies the original designation criteria (e.g., there is adequate evidence that the product is sufficiently profitable not to justify maintenance of market exclusivity) Citation[19]. However, such reduction has not been applied so far. Third, we assumed a fixed growth rate in sales across all products. However, growth rate may depend on the product cycle, with higher growth during earlier stages and lower growth during later stages. Similarly, factors such as penetration rate or clinical phase durations are disease-specific, but were not considered at a disease-level due to limited data availability. Forth, we used sales data as an approximation of payers’ expenditures. On the one hand, sales may be higher than payers’ expenditures because of co-payments by patients. On the other hand, payers also cover distributional costs, for example, costs of pharmacies. It is unclear to what degree the two opposing effects cancel out. Fifth, due to a lack of data, the model did not include potential savings from avoided clinical events and reductions in morbidity due to ultra-orphan drugs as well as potential savings from treatments that are currently prescribed but will be substituted in the future due to drugs for UODs. On the other hand, savings from avoided clinical events and reductions in morbidity are not achieved in the short run due to the presence of fixed costs Citation[20].
In conclusion, our analysis does not support concerns about an uncontrolled growth in expenditures for ultra-orphan drugs. The estimated budget thus leaves room for future innovations in this area. We recommend continuously monitoring the budget impact in order to provide an input to rational policy making.
There is an inverse relationship between disease prevalence and annual per-patient orphan drug costs.
Health economists have expressed concern that drugs for orphan disorders may impose substantial and increasing costs to the health care system.
The present study addressed the budget impact of drugs for ultra-orphan non-oncological diseases in Europe.
The analysis based on patent expiries and likely new market entrants over a ten-year period predicted a moderately increasing rate of ultra-orphan drug expenditures through year 2012.
While the analysis, which was enhanced by extensive sensitivity analyses, did not support popular concerns about un uncontrolled growth in ultra-orphan drug spending, continuous monitoring of ultra-orphan drug expenditures was recommended.
Financial & competing interests disclosure
The study was supported by two biopharmaceutical firms, Alexion, Cheshire, CT, and BioMarin, San Rafael, CA, under an unrestricted educational grant policy. The authors have no other relevant affiliations or financial involvement with any organization or entity with a financial interest in or financial conflict with the subject matter or materials discussed in the manuscript apart from those disclosed.
No writing assistance was utilized in the production of this manuscript.
Notes
1In the present context, we use the term ‘conservative’ to characterize all those assumptions potentially leading to a higher sales forecast. Whenever we had a choice between plausible assumptions, we selected the ‘conservative’ one.
Related Research Data
References
- Hutchings A, Schey C, Dutton R, et al. Estimating the budget impact of orphan drugs in Sweden and France 2013-2020. Orphanet J Rare Dis 2014;9:22
- Schlander M, Beck M. Expensive drugs for rare disorders: to treat or not to treat? The case of enzyme replacement therapy for mucopolysaccharidosis VI. Curr Med Res Opin 2009;25:1285-93
- Simoens S. Pricing and reimbursement of orphan drugs: the need for more transparency. Orphanet J Rare Dis 2011;6:42
- McCabe C, Claxton K, Tsuchiya A. Orphan drugs and the NHS: should we value rarity? Br Med J 2005;331:1016-19
- Williams S. The five most expensive drugs in the world. The Motley Fool. 2013. Available from: www.fool.com/investing/general/2013/06/29/the-5-most-expensive-drugs-in-the-world.aspx [Last accessed 21 June 2014]
- Mauskopf JA, Sullivan SD, Annemans L, et al. Principles of good practice for budget impact analysis: report of the ISPOR Task Force on good research practices--budget impact analysis. Value Health 2007;10(5):336-47
- Schey C, Milanova T, Hutchings A. Estimating the budget impact of orphan medicines in Europe: 2010 - 2020. Orphanet J Rare Dis 2011;6:62
- Kobayashi K, DeLab RJ. FDA review practices and priorities for drugs used in cancer treatment. Ann N Y Acad Sci 2001;949:341-4
- Orphanet. Available from: www.orpha.net/ [Last accessed on 20 December 2013]
- Orphanet Report Series. Prevalence of rare diseases: bibliographic data. 2012. Available from: www.orpha.net
- EvaluatePharma. Orphan Drug Report. 2013
- Seoane-Vazquez E, Rodriguez-Monguio R, Szeinbach SL, Visaria J. Incentives for orphan drug research and development in the United States. Orphanet J Rare Dis 2008;3:33
- EU Competition Commission Pharmaceutical Sector Inquiry, Fact Sheet 1. Prices, time to generic entry and consumer savings. Available from: http://ec.europa.eu/competition/sectors/pharmaceuticals/inquiry/fact_sheet_1.pdf [Last accessed on 19 December 2013]
- Tambuyzer E. Rare diseases, orphan drugs and their regulation: questions and misconceptions. Nature Rev Drug Dev 2010;9(12):921-9
- Orfali M, Feldman L, Bhattachariee V, et al. Raising orphans: how clinical development programs of drugs for rare and common diseases are different. Clin Pharmacol Ther 2012;92(2):262-4
- IMS Health Market Prognosis, June 2013. Available from: www.imshealth.com/deployedfiles/imshealth/Global/Content/Corporate/Press%20Room/Total_World_Pharma_Market_Topline_metrics_2012-17_regions.pdf [Last accessed on 30 January 2014]
- OECD. Health at a glance: Europe 2012, OECD Publishing. 2012. Available from: http://dx.doi.org/10.1787/9789264183896-en [Last accessed on 20 December 2013]
- Sullivan SD, Mauskopf JA, Augustovski F, et al. Budget impact analysis—principles of good practice: report of the ISPOR. 2012 Budget Impact Analysis Good Practice II Task Force. Value Health 2014;17(1):5-14
- European Commission. Guideline on aspects of the application of Article 8(1) and (3) of Regulation (EC) No 141/2000: Assessing similarity of medicinal products versus authorised orphan medicinal products benefiting from market exclusivity and applying derogations from that market exclusivity. Official Journal of the European Union. 2008
- Adang EM. Economic evaluation of innovative technologies in health care should include a short-run perspective. Eur J Health Econ 2008;9(4):381-4
- A.D.A.M. Editorial Board. Familial lipoprotein lipase deficiency. In: Dugdale DC, Zieve D, editors. A.D.A.M. Medical Encyclopedia (National Center for Biotechnology Information). 2013
- Jacobsohn DA, Vogelsang GB. Acute graft versus host disease. Orphanet J Rare Dis 2007;2:35
- Genetics Home Reference. National Center for Biotechnology Information, Bethesda, Maryland, Available from: http://ghr.nlm.nih.gov/ [ Last accessed on 19 December 2013]
- Lobo C, Angulo IL, Aparicio LR, RELATH Investigators. Retrospective epidemiological study of Latin American patients with transfusional hemosiderosis: the first Latin American epidemiological study in iron overload--the RELATH study. Hematology (Am Soc Hematol Educ Program) 2011;16(5):265-73
- Zimmerhackl LB, Besbas N, Jungraithmayr T, European Study Group for Haemolytic Uraemic Syndromes and Related Disorders. Epidemiology, clinical presentation, and pathophysiology of atypical and recurrent hemolytic uremic syndrome. Semin Thromb Hemost 2006;32(2):113-20
- Cystic Fibrosis Foundation. Cystic fibrosis foundation patient registry: annual data report 2011. Bethesda, MD: 2011
- Health Grades. Homozygous familial hypercholesterolemia. Available from: www.rightdiagnosis.com/h/homozygous_familial_hypercholesterolemia/basics.htm [Last accessed on 20 December 2013]
- Hoffman HM, Yasothan U, Kirkpatrick P. Fresh from the pipeline: rilonacept. Nat Rev Drug Discov 2008;7(5):385-6
- Coelho T, Ericzon BG, Falk R, et al. A physician’s guide to transthyretin amyloidosis. 2008. Available from: www.amyloidosis.org/pdf/TTR%2008.pdf [Last accessed on 20 December 2013]
- Centers for Disease Control and Prevention. Anthrax (2009). Available from: www.cdc.gov/nczved/divisions/dfbmd/diseases/anthrax/technical.html [Last accessed on 20 December 2013]
- Fraser D. Hypophosphatasia. Am J Med 1957;22(5):730-46
- Berentsen S, Ulvestad E, Langholm R, et al. Primary chronic cold agglutinin disease: a population based clinical study of 86 patients. Haematologica 2006;91(4):460-6
- Organ Procurement and Transplantation Network. Available from: http://optn.transplant.hrsa.gov/ [Last accessed on 3 January 2014]
- United States Renal Data System. Annual data report: atlas of chronic kidney disease and end-stage renal disease in the United States. Bethesda, MD: National Institutes of Health, National Institute of Diabetes and Digestive and Kidney Diseases. 2011
- World Health Organization. GKT1 Activity and Practices. Available from: www.who.int/transplantation/gkt/statistics/en/index.html [Last accessed on 20 December 2013]
- Orens JB, Garrity ERJr. General overview of lung transplantation and review of organ allocation. Proc Am Thorac Soc 2009;6(1):13-19
- Hoofnagle JH, Carithers RLJr, Shapiro C, Ascher N. Fulminant hepatic failure: summary of a workshop. Hepatology 1995;21(1):240-52
- Meikle PJ, Hopwood JJ, Clague AE, Carey WF. Prevalence of lysosomal storage disorders. JAMA 1999;20;281(3):249-54