
Abstract
Mass spectrometry-based proteomics has considerably extended our knowledge about the occurrence and dynamics of protein post-translational modifications (PTMs). So far, quantitative proteomics has been mainly used to study PTM regulation in cell culture models, providing new insights into the role of aberrant PTM patterns in human disease. However, continuous technological and methodical developments have paved the way for an increasing number of PTM-specific proteomic studies using clinical samples, often limited in sample amount. Thus, quantitative proteomics holds a great potential to discover, validate and accurately quantify biomarkers in body fluids and primary tissues. A major effort will be to improve the complete integration of robust but sensitive proteomics technology to clinical environments. Here, we discuss PTMs that are relevant for clinical research, with a focus on phosphorylation, glycosylation and proteolytic cleavage; furthermore, we give an overview on the current developments and novel findings in mass spectrometry-based PTM research.
The role of post-translational modifications in biological systems
Biological systems maintain homeostasis by dynamic adaptation to the rapidly changing environment. While transcription, translation (and degradation) affect protein abundance, protein activity and function are mainly defined by structure . The latter can be regulated by post-translational modifications (PTMs), allowing rapid response to external/internal stimuli within (milli-)seconds.
Figure 1. Frequently reported post-translational protein modifications.
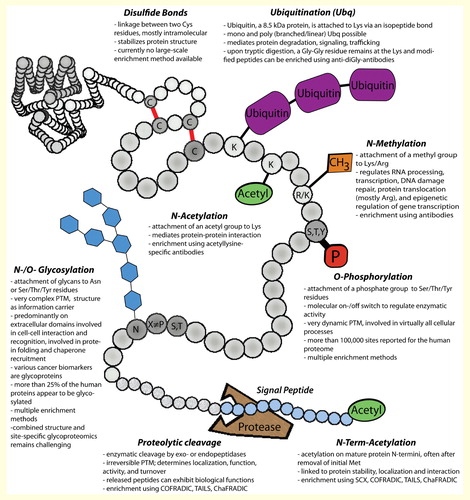
Currently, 469 PTMs are reported in the UniProt database (January 2015), of which 326 are reported in eukaryotes, 250 in bacteria, and 80 in archeae Citation[1]. Some PTMs have only been found in specialized bacteria Citation[2,3], but more than 100 different PTMs are reported in Homo sapiens. According to PhosphoSitePlus Citation[4], protein phosphorylation is by far the most common PTM and has been detected on approximately 17,500 human gene products . Other frequently reported PTMs are ubiquitination (∼8100 proteins), lysine acetylation (∼6700 proteins), and lysine methylation (∼2400 proteins). The heterogeneous group of protein glycosylation has been reported for approximately 4500 proteins (PhosphoSitePlus and UniProt), but is estimated to occur on ≥50% of all human proteins Citation[5]. Further PTMs such as succinylation, SUMOylation and citrullination Citation[6,7] are increasingly added to the databases . Importantly, >95% of these data are derived from mass spectrometry (MS)-based proteome studies Citation[8], and with the advent of tools that allow automated re-processing of large-scale MS data sets Citation[9] from repositories such as PRIDE Citation[10] or proteomeXchange Citation[11], it can be assumed that our knowledge about the prevalence of PTMs will further increase Citation[12].
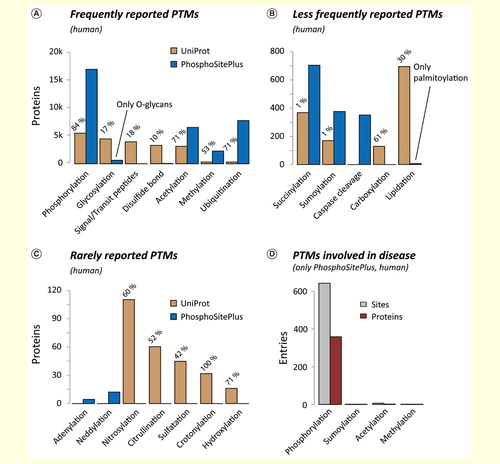
Figure 2. Frequency of human PTMs. Summary of human PTMs which, according to UniProt and PhosphoSitePlus, have been detected (A) frequently, (B) less frequently and (C) rarely. For UniProt, the percentage of entries with experimental evidence is given (ECO:0000269). (D) The high number of known PTMs is in stark contrast to the limited knowledge about their involvement in disease.PTM: Post-translational modification.
Notably, for a given protein, not only the individual PTMs, but rather the combinations of PTMs and PTM crosstalk define protein function Citation[13–16]. Altered PTM patterns have been connected to various diseases. However, according to PhosphoSitePlus, this has been experimentally validated for only 350 proteins , rendering studying the role of PTMs in the genesis and progression of human disease a major goal of current life science.
For decades, PTM characterization was mainly confined to individual proteins or defined pathways. With the advent of liquid chromatography online coupled to MS (LC-MS) analysis and PTM enrichment Citation[17–20], the identification, localization and quantitation of hundreds to even thousands of PTMs have become possible.
From discovery to clinical research
To date, PTM analysis by MS is mainly based on the analysis of peptides in so-called ‘bottom-up’ approaches. Thus, sample preparation typically comprises: protein extraction from the sample of interest (tissues, body fluids, cells, organelles), enzymatic digestion Citation[21,22] and enrichment of modified peptides to deplete the bulk of non-modified peptides that hamper PTM analysis Citation[17,23,24]. The employed techniques target either PTM structure, such as in affinity chromatography Citation[25,26], or physicochemical characteristics of the modified peptides, for example, resulting in specific retention characteristics in reversed phase (RP) Citation[27] or hydrophilic interaction chromatography (HILIC) Citation[28]. Strong cation exchange chromatography (SCX) can be used to selectively enrich charge-reduced peptides (phosphopeptides, glycopeptides or N-terminally acetylated peptides) Citation[29–31]. Often, two and more enrichment techniques are combined (e.g., affinity chromatography and HILIC for the selective enrichment of phosphopeptides Citation[32,33]) in order to increase specificity and additionally fractionate the complex samples.
Notably, most strategies for the enrichment of modified peptides have been developed, evaluated and applied using cell lines such as HeLa Citation[33] or HEK 293 Citation[34] rather than primary tissues Citation[19]. Consequently, our knowledge about PTM involvement in disease mechanisms is mainly derived from in vitro or animal models. For instance PanCa-1 cells can be stimulated with EGF or TNF-β to induce an epidermal mesenchymal transition, an important mechanism involved in metastasis formation in various cancer types Citation[35,36]. Such cell culture-based studies can provide high amounts of sample material (often in the milligram range Citation[37]) and, therefore, allow a large-scale analysis of PTMs without the ultimate need for high enrichment specificity or sensitivity. In contrast, the availability of sample material in clinical research is often restricted Citation[38]. Hence, one future challenge will be to move one step ahead by validating proposed and identifying novel models directly in clinical samples Citation[39]. This might be imperative to the identification and verification of biomarker candidates and drug targets, and represents a current bottleneck in MS-based PTM research Citation[40].
Whereas body fluids (such as blood, urine or tear fluid) are usually readily available in high amounts, tissue samples are often restricted and/or formalin-fixed and paraffin-embedded. In addition, the bulk of a clinical sample is usually needed for diagnostic purposes and sample storage in biobanks. Consequently, the amount of protein available for proteomics analyses is often in the microgram range, requiring the use of robust and sensitive analytical workflows. If feasible, developing standard operating procedures that are both applicable in a clinical environment and compatible with downstream proteomics is highly recommended. Here, the first challenge is an efficient and reproducible sample preparation Citation[38], ideally in a single tube to maximize sample recovery Citation[41,42]. Recently, Hughes et al. used a novel bead-based sample preparation protocol for proteome analysis to analyze single fly embryos and merely 1000 HeLa cells (<1 µg of protein), respectively Citation[43]. Although not evaluated for clinical samples, such novel methods might be the future for efficient sample preparation of ultra-low sample amounts. A second challenge is downscaling PTM enrichment, as currently only a few techniques allow large-scale analysis of PTMs from low sample amounts. In phosphoproteomics, recent advances enable the detection of thousands of phosphopeptides from ≤100 µg of protein Citation[20,32,33]. For low sample amounts, as often obtained from microdissected tissue, several groups have set up platforms to analyze the samples in a single-shot analysis. For example, Masuda et al. presented an online fractionation approach for the identification of approximately 1000 phosphorylation sites from only 1 µg of protein by using optimized surfactant-aided sample preparation, hydroxy acid-modified metal oxide affinity chromatography (MOAC) and miniaturization of the HPLC system Citation[44]. Lam et al. reported an online LC-MS platform employing two subsequent RP-HPLC fractionations for peptide separation, combined with porous graphitic carbon chromatography for retention of hydrophilic glycopeptides. This enabled an efficient proteomics and glycoproteomics analysis with only 25 µg of sample material Citation[45]. Such online approaches are promising for restricted samples; however, high-throughput analysis of large sample cohorts demands for considerable robustness of the entire analytical procedure, which often contradicts ultra-high sensitivity approaches. Currently, common offline enrichment strategies might still represent the more robust alternative.
Quantification strategies for PTM-focused clinical proteomics
In biological systems, proteins are usually expressed in several up to many copies, which may differ with regard to their PTM patterns. Thus, for each putatively modified amino acid, there usually is equilibrium between different modification states that can be rapidly altered by enzymes such as kinases or phosphatases. Consequently, a protein can be simultaneously present in multiple variations, and therefore, regulation by PTMs is a function of site occupancy and full PTM patterns (also called PTM code). Thus, given a sensitive detection system such as LC-MS and a cell population rather than individual cells, qualitative changes between none and full-site occupancy are rather sparse. Hence, PTM studies focus mainly on quantifying – sometimes slight – relative changes of modified peptides between different sample states, in order to discover relevant biological features Citation[46].
To quantify PTM peptides in clinical samples, the following points regarding study design and the quantification method should be considered beforehand: How many sample (including technical and biological) replicates can and have to be analyzed? Is the availability of LC-MS analysis time-limited? Can the samples be analyzed in successive batches? Which accuracy is required for quantification? In general, it is recommended to randomize the order in which samples are analyzed and to place samples freshly on the LC autosampler prior to LC-MS analysis.
The following techniques may be used for relative quantification of PTMs in clinical samples: label-free quantification, super-stable isotope labeling by amino acids in cell culture (SILAC) or chemical labeling. They have certain advantages and disadvantages, and may differ in their compatibility with common PTM enrichment techniques, as summarized in the following sections.
In label-free quantification, samples are analyzed in separate LC-MS runs and peptides are quantified by comparing either the number of peptide spectrum matches (spectral counting Citation[47]) or precursor ion signal intensities (i.e., the area under the curve) Citation[48], whereas the latter is more accurate and precise. In any case, a high run-to-run reproducibility substantially improves the confidence of peptide quantification. Thus, the quality of label-free quantification strongly depends on the reproducibility of sample preparation, LC and MS performance, and requires a high level of quality control Citation[21,49] that may not be easily established in each environment. Even then, the comparability between two samples can suffer from instrumental variations, particularly when measured over a long period of time, such that measuring several replicates is important to improve statistical robustness. Notably, label-free quantification of previously fractionated samples is even more challenging, as slight variations in the fractionation, for example, small retention time shifts during offline chromatography, are virtually inevitable and can considerably impair quantification. Novel bioinformatics strategies promise a more sophisticated label-free comparison of such difficult examples Citation[50,51].
Super-SILAC is similar to label-free quantification. It, however, makes use of a heavy SILAC-labeled internal standard that is spiked as the reference to each sample, in order to facilitate the comparison between different samples. A super-SILAC standard consists of either a mixture of different heavy SILAC-labeled cell lines, for example, when analyzing complex tissue samples, or simply the very cell type of interest Citation[52]. Each biological sample is individually quantified relative to this standard, thus tackling instrumental variations. Schweppe et al. used a super-SILAC non-small lung cancer cell line standard for quantitative phosphoproteomics of the lung tissue Citation[53]. Boersema et al. quantified 180 N-glycosylation sites from breast cancer patient plasma using a dedicated super-SILAC mix Citation[54]. Notably, qualitative differences in the proteomes of tissue and cell lines may impair the quantification of proteins, which might be even more pronounced on the level of PTMs. Using mixtures of cell lines can partially compensate for this, however, at the expense of a substantially increased sample complexity and, consequently, the impaired detection of low-abundant peptides.
Chemical labels can be used to introduce stable isotopes on the protein or peptide level for quantitative analyses. Depending on the employed label, currently up to 3 (dimethyl labeling Citation[55,56]), 8 (isobaric tag for relative and absolute quantitation [iTRAQ] Citation[57,58]) or 10 samples (tandem mass tags [TMT] Citation[59,60]) can be multiplexed, considerably facilitating the use of extensive fractionation and enrichment protocols prior to LC-MS analysis. In case of reporter ion-based iTRAQ and TMT, after labeling, the same peptide derived from different samples is always isobaric, such that even multiplexing 10 samples does not considerably increase sample complexity. Thus, for each differentially labeled peptide, only a single precursor isotope pattern is detected and isolated to generate MS/MS spectra. Upon fragmentation, the non-isobaric reporter ions are released from their precursors and their intensities reflect the relative abundance of the respective peptide in the different samples. Owing to the multiplexing capacity in conjunction with the isobaric nature of the labels, iTRAQ and TMT are ideally suited for studies in which the available amount of protein per sample/condition is limited Citation[61]. Notably, for reporter-ion based strategies, MS/MS identification rates are below those for non-labeled samples, resulting partially from elevated charge states Citation[62] and from the different fragmentation behavior of the labeled peptides Citation[63]. However, the possibility to conduct extensive fractionation prior to LC-MS allows increasing the number of peptide spectrum matches and, importantly, even improves quantification accuracy owing to reduced co-isolation of precursor ions. As each labeled peptide releases the same m/z reporter ions, particularly in highly complex samples, the reporter ion intensities may reflect a mixture of co-isolated peptides, often distorting ratio estimation Citation[64,65]. It was reported that besides reducing isolation windows for precursor ions and extended fractionation Citation[64], MS3 analysis can improve ratio determination Citation[60,66], the latter, however, happening at the expense of sensitivity. iTRAQ and TMT are widely used for quantification Citation[67–69], but the labels can alter the physicochemical properties of peptides and thus directly affect the efficiency of PTM enrichment. This can be circumvented by labeling after enrichment, which allows using higher amounts of starting material and/or saving expensive label reagents; this, however, induces higher systematic biases from sample-to-sample variations Citation[70,71].
Recently, a new strategy termed neutron encoding (NeuCode), utilizing the subtle mass differences (low millidalton range) of different isotopologues for quantification, has been developed to further expand multiplexing capacities in LC-MS–based quantitative proteomics Citation[72]. In theory, as many as 39 different isotopologues of lysine can be incorporated in cell culture and multiplexed for analysis. If a resolution of 30,000–60,000 is used for the initial survey scan, the unresolved isotopologue signals do not increase spectral complexity, and thus, all channels are co-isolated for fragmentation and peptide identification. Quantification is done by an additional high-resolution survey scan which resolves the different isotopologues (R ≥ 480,000 to resolve 18 mDa differences in a 3-plex experiment). Notably, the NeuCode technology is experimentally challenging and currently limited to only few mass spectrometers with sufficient resolution and scan speed. Nevertheless, the development of NeuCode-based chemical labels Citation[73,74] and the rapid technological progress in MS instrumentation render NeuCode a most promising and valuable tool for future clinical (PTM) proteomics.
Whereas label-free analysis, super-SILAC and chemical labeling provide the repertoire for the large-scale detection of aberrant PTM regulation, validation and assay detection of potential biomarkers requires more accurate and precise quantification. In a clinical environment, this can be done by ELISA-based methods, which, nevertheless, can only target single or few biomarkers simultaneously. The use of targeted MS-based proteomics overcomes this constraint, offering equal or even higher sensitivity for multiple analytes Citation[40]. Here, a pre-defined set of peptide candidates can be relatively quantified over a high dynamic range with high precision and accuracy. Depending on the sensitivity of the equipment and the abundance of the peptides of interest, targeted MS can be utilized to monitor >100 different peptides from complete cell digests within a single LC-MS analysis, and without the need for fractionation or enrichment. This allows refining and validating the results obtained from ‘discovery’ experiments with larger sets of samples in a short time. Furthermore, spiked-in stable isotope-labeled reference peptides allow for absolute quantification in an assay-like manner, without the need for cost-intensive antibodies as required for ELISA.
For a targeted approach, peptides of interest have to be evaluated for their suitability, that is, stability and uniqueness Citation[75]. Targeted MS is classically conducted with the help of triple-quadrupole mass spectrometers in multiple reaction monitoring (MRM) mode or, more recently, using parallel reaction monitoring, as reviewed elsewhere Citation[76]. Whereas generating reliable high-quality targeted assays requires a substantial effort and the incorporation of robust quality control measures Citation[77], once set up and validated, they enable analyzing larger sample cohorts in accordance with the demands of clinical research. The technology provides good inter-lab reproducibility and precision Citation[78], and current research is aiming at more cost-effective and standardized MRM assays for widespread applicability Citation[79].
Targeted methods have been used for the quantification of low-abundant modified peptides, as demonstrated for glycosylated Citation[80] or phosphorylated species Citation[81]. Recently, Yoneyama et al. developed a targeted assay to monitor the levels of proline hydroxylation in fibrinogen from serum samples of pancreatic cancer patients Citation[82]. Such exemplary studies render targeted LC-MS/MS, though still not frequently employed for PTMs, a highly promising approach for future clinical research that, however, is still far from routine use.
Study design & statistics for biomarker discovery
In most clinical proteomics studies, sample size is one of the major issues. LC-MS analysis time is expensive, well-classified patient material is often not easy to obtain and, particularly in pathological samples, biological variation can be huge. The importance of sample size (n) to gain statistical power and maximize the chances of identifying true-positive candidates from high-throughput experiments has been demonstrated previously Citation[83,84]. Skates et al. computed the probabilities for true biomarkers to pass the initial steps of proteomics-based biomarker discovery, namely, identification in a large-scale experiment to reach the subsequent verification step by MRM Citation[85]. They considered sample size (n), shedding (percentage of patients showing up-regulation of a certain biomarker, e.g., due to heterogeneity of a cancer) and the distance of biomarker intensities between patients and controls. Their simulations demonstrate that the probability that a biomarker with 50% shedding and a median distance of 3 standard deviations is passed to the verification step in an MRM assay with n = 10 (controls = patients = 10) is no more than 15% when performing 20 targeted assays after the discovery experiment. The probability can be increased by increasing the number of targeted assays or the number of samples in discovery phase. Indeed, this probability increases to 60%, 93% and almost 100% when increasing the sample sizes to n = 25, 50, 100 or to 35% when performing 50 targeted assays with n = 10. Thus, this simulation clearly confirms the importance of cohort size in biomarker discovery. Importantly, when analyzing diseases with low prevalence where samples can be obtained from only a few individuals, sample sizes are often far below n = 10, considerably reducing the statistical power of such experiments, particularly when considering the difficulties in making a precise and correct diagnosis.
Therefore, choosing appropriate normalization methods and statistical tests is a major concern directly affecting the final selection of candidates. The often used two-sample t-test to estimate whether a regulation can be considered as significant or not has some inherent drawbacks, since it takes into account both the fold-change and the estimated variance of each potential candidate. If the sample size is small (n ≤ 5), estimation of the variance is quite uncertain. Consequently, the t-test often declares strongly regulated hits with a high variance as ‘not significant’ Citation[86]. demonstrates how decisions for potentially regulated candidates would be made on the basis of a two-sample t-test (two-sided, unequal variance) for two simulated markers in an experiment with n = 3 (3 patients vs 3 controls). Marker 1 exhibits a clear fold-change (3.2-fold), but also a high variance, and thus would be rejected at a 5% confidence level. In contrast, marker 2 does not exhibit a biologically significant regulation (1.1-fold), but the low variance would render it ‘significant’ at a 5% confidence level. Thus, decisions should not be made merely based on p-values resulting from a two-sample t-test.
Figure 3. Using the classical t-test for biomarker research. Two simulated markers 1 and 2 (A) in a background of an iTRAQ-based phosphoproteomics experiment (B, C). Using the two-sample t-test, the not-promising marker 2 would be defined as significant, whereas marker 1 would not be considered. Using the moderated t-test provided in the Limma package Citation[92,89,93], only the promising marker 1 remains significant. A detailed description for the use of this package was recently published by Kammers et al. Citation[86].
![Figure 3. Using the classical t-test for biomarker research. Two simulated markers 1 and 2 (A) in a background of an iTRAQ-based phosphoproteomics experiment (B, C). Using the two-sample t-test, the not-promising marker 2 would be defined as significant, whereas marker 1 would not be considered. Using the moderated t-test provided in the Limma package Citation[92,89,93], only the promising marker 1 remains significant. A detailed description for the use of this package was recently published by Kammers et al. Citation[86].](/cms/asset/28a9ee01-02d4-4de7-9ca7-bba1b91ae430/ieru_a_1042867_f0003_oc.jpg)
Various studies addressed the incapacity of the t-test for omics experiments with often small replicate numbers Citation[87,88]. In recent years, statistical methods that had already been used in other high-throughput technologies have been employed for proteomics experiments Citation[89,90]. The inaccuracy of variance estimations in experiments with only few replicates can be compensated, for example, by ‘empirical Bayes method shrinking’ Citation[86]. The reduced variance can be used for a moderated t-test in which the p-value is rather assessed by the fold-change than by the initially estimated variance. Notably, empirical Bayes methods have been successfully used for approximately 10 years in the microarray field Citation[91] and can be easily adapted to proteomics experiments Citation[86,92,89]. Recently, Kammers et al. described the use of the R-package Limma Citation[92,93] for iTRAQ 8-plex data, including a detailed online description (see ‘Methods’ section of Citation[86]). We used the Limma package to assess p-values by the moderated t-test to illustrate the empirical Bayes method for the aforementioned simulated markers 1 and 2 . Indeed, using the moderated t-test, the promising marker 1 is declared as significant (5% confidence level), whereas the non-promising marker 2 shifts into the background. Thus, the results of the moderated t-test are more in agreement with the expected outcome for these two biomarkers.
In summary, statistical methods might help researchers to identify more promising candidates, but cannot compensate for low sample sizes. When only few replicates are analyzed, especially during the discovery (and perhaps also verification) phase, appropriate statistical methods might increase the probability of selecting promising candidates. Continuous improvements might help to adapt statistical methods to the needs of clinical (proteomics) research and to help identifying and validating promising biomarker candidates in the future.
Analyzing protein phosphorylation in clinical samples
Protein phosphorylation plays a key role in many clinically relevant processes such as stem cell differentiation Citation[94], platelet activation Citation[95] and cell cycle regulation Citation[96]. Abnormal phosphorylation patterns can be linked to several diseases such as Alzheimer’s disease Citation[97–99], diabetes Citation[100–102], cancer Citation[103–105] or cardiovascular diseases Citation[106–108]. Therefore, the detection of aberrant phosphorylation holds a great potential for understanding the genesis and progression of diseases, discovering new biomarkers and evaluating treatment response in clinical research (reviewed in Citation[109,110]).
Recent examples for the use of quantitative phosphoproteomics to characterize signaling events in clinically relevant targets include, for example, the comparison of phosphorylation patterns between plasma membrane proteins of sickle red blood cells and normal erythrocytes upon MEK1/2 inhibition or exogenous ERK2 addition. Here ERK1/2 could be further confirmed as potential therapeutic target, as the results indicated its connection to several dysfunctional aspects of sickle red blood cells Citation[111]. A study on primary adipocyte cell cultures from healthy and diabetes type 2 individuals suggested a putative mechanism for insulin resistance in obese patients Citation[112]. Recently, we used quantitative phosphoproteomics to study time-resolved changes upon inhibition of human platelets isolated from healthy donors by stimulation of the inhibitory cAMP/PKA pathway. This provided novel insights into the crosstalk of signaling pathways and pointed to potential new candidates for anti-platelet treatment Citation[19].
State-of-the-art MS-based phosphoproteomic workflows rely on the enrichment of phosphorylated peptides. For this purpose, various affinity chromatography-based methods are frequently employed, with Fe3+-immobilized metal ion affinity chromatography (IMAC) Citation[113,114], Ti4+-IMAC Citation[33,115,116] and TiO2-MOAC Citation[25,27,32,117,118] being prominent examples. Often, these techniques are combined with LC, either prior to or subsequent to enrichment, in order to fractionate and/or further enrich the sample. Successfully applied combinations comprise MOAC–IMAC–HILIC Citation[32], SCX–IMAC Citation[119], SCX–MOAC Citation[120], high-pH–RP-MOAC Citation[27] and HILIC–IMAC Citation[121]. Schweppe et al. used an SCX–MOAC to quantitatively profile non-small lung cancer tissue from human individuals in a super-SILAC approach to map substrates of the oncogenic kinase, PLK1. Moreover, they conducted a large-scale comparison of cancer signaling between different individuals, with the goal of monitoring cancer progression and treatment response in a personalized manner Citation[53]. Herskowitz et al. applied Ti4+-IMAC to characterize phosphorylation patterns in post-mortem brains of frontotemporal lobar degeneration patients and found GFAP, NDRG2, MAP1A, Nogo, PKCγ and HSP90AA1 abnormally regulated, compared to control brains Citation[122].
In affinity chromatography-based phosphoproteomics, throughput and reproducibility are generally limited owing to a multitude of labor-intensive manual steps. Thus, HPLC-based methods that target distinct physicochemical properties of phosphopeptides are attractive alternatives regarding automation toward clinical applications. At pH 2–3, phosphopeptides, similar to glycopeptides, are more hydrophilic and have a lower net charge than unmodified peptides. However, targeting only hydrophilicity using HILIC is not sufficient for selective enrichment of phosphopeptides, unless combined with affinity chromatography (e.g., IMAC or MOAC), as phosphopeptides are distributed rather evenly throughout the obtained fractions Citation[121]. Chromatographic modes targeting net charge proved to be more efficient, especially for tryptic peptides SCX can be used to effectively enrich phosphopeptides in the very early fractions Citation[123]. However, a drawback of charge-based separation is the co-elution of other charge state-reduced peptides, such as N-terminally acetylated peptides, or most C-terminal peptides, hampering the specificity of this method and demanding for further separation/enrichment. The probably most promising HPLC-based approach is termed electrostatic repulsion-hydrophilic interaction liquid chromatography (ERLIC) Citation[124]. In ERLIC, an anion exchange column is used with a HILIC-type buffer system (70% acetonitrile) at low pH to superimpose two effects that help to separate phosphorylated from non-modified peptides. First, phosphopeptides are less repulsed by the positively charged stationary phase than unmodified (tryptic-) peptides, and second they are additionally retained by their more pronounced hydrophilicity. This ERLIC mechanism was exploited and characterized in various phosphoproteomics studies and yields highly selective phosphopeptide enrichment using a solely HPLC-based approach. The majority of unphosphorylated peptides are in the flow-through and early fractions Citation[125], whereas phosphopeptides are not only efficiently retained Citation[126] but furthermore separated according to the number of phosphoamino acids Citation[127]. Consequently, ERLIC has proven very efficient for the enrichment of multiply phosphorylated peptides Citation[128]. We recently demonstrated that a tailored strong cation exchange/reversed-phase solid-phase extraction (SCX/RP-SPE) further boosts the sensitivity and performance of ERLIC for efficient phosphopeptide enrichment from limited sample material. Thus, approximately 7500 highly confident phosphorylation sites could be identified from 100 µg of non-stimulated HeLa cells, by measuring only 50% per fraction on an Orbitrap Velos mass spectrometer Citation[20]. Indeed, this approach can be further refined to include a global proteome analysis from the same sample Citation[129]. Consequently, ERLIC ranks among the most sensitive phosphoproteomics workflows to date and, more importantly, can be conducted without any offline AC. In our opinion, ERLIC provides a flexible, sensitive and efficient platform with high reproducibility that may be used for high-throughput phosphoproteomics studies in the future.
Although phosphopeptide enrichment has improved with regard to efficiency and sensitivity, phosphoproteomics still faces some considerable challenges some of which are given below. The overlap between biological replicates (even for cell culture) is often comparably low. First of all, this might derive from low reproducibility and specificity during enrichment (e.g., presence of other modifications) and LC-MS analysis (e.g., retention time shifts, MS performance). However, high sample complexity and differences in phosphopeptide identification (e.g., undersampling, peptide and site localization scoring) can have a strong impact. These technical issues can be partially addressed by more extensive sample fractionation and, thus, increased analysis time, as well as the use of faster and more sensitive mass spectrometers to reduce undersampling. However, the biological variance between samples will remain a source of irreproducibility, hampering the comprehensive detection of ‘the phosphoproteome’, particularly owing to the highly dynamic and complex nature of PTM patterns.The applied enrichment method can introduce a certain bias, preferentially enriching phosphopeptides with distinct physicochemical properties (e.g., acidic, basic, hydrophilic or hydrophobic phosphopeptides) and, therefore, subsets of the phophoproteome. Targeting different physicochemical properties simultaneously, as done in ERLIC, could help to overcome this limitation.Digestion efficiency can be reduced if a phosphorylation is in proximity to a proteolytic cleavage site, such that a mixture of fully and missed cleaved phosphopeptides can be generated. This further impairs the detection and even more the quantification of phosphorylation sites, demanding for adjusted digestion parameters to improve digestion efficiency Citation[130]. The complementary use of alternative proteases is another promising approach toward a more comprehensive phosphoproteome Citation[131,132], including the usage of non-specific proteases Citation[133].The localization of a phosphate moiety within a peptide sequence can be challenging and irreproducible, even though specific statistical tools have been developed to determine probabilities of site localization Citation[134–138]. Importantly, even if a phosphopeptide is present in all analyzed replicates, it might not always yield confident and/or the same site localization, thus apparently reducing the overlap between replicates. The use of alternative fragmentation techniques such as electron-transfer dissociation (ETD) Citation[139] and electron-transfer-higher energy collision-induced dissociation (etHCD) Citation[140] for sequencing phosphopeptides can assist site assignment, particularly compared to ion trap collision-induced dissociation (CID) which is often dominated by neutral losses of the precursor ion Citation[141].The separation of phosphopeptides by RP chromatography can suffer from peak broadening in case of multiply phosphorylated peptides. To improve peak shape and width (i.e., to obtain higher sensitivity), the use of chelating agents such as ethylenediaminetetraacetic acid to remove metal ion contaminations in the HPLC system Citation[142] has been reported.
In summary, it is most important to consider possible pitfalls and sources of error (or bias) in the design of clinical phosphoproteomics studies; otherwise, important biological information can be easily misinterpreted or simply lost.
Analyzing protein glycosylation in clinical samples
Protein glycosylation, the attachment of glycan structures to proteins, is another well-known and clinically relevant PTM that has been found on asparagine in N-X-S/T (X≠P) motifs (N-glycosylation), as well as on serine, threonine and, recently, tyrosine (O-glycosylation) Citation[143,144]. The attached glycan structures can be highly complex combinations of different carbohydrate-building blocks and act as dense information carriers Citation[145]. Thus, not only the position within the protein and glycosylation site occupancy, but also the glycan structure has to be elucidated for a deeper understanding of its pathological role. Glycosylation is known to assist in protein folding Citation[146,147], and folding quality control Citation[148,149], protein sorting Citation[150], protein degradation, cell–cell interaction and host–pathogen interaction Citation[151].
Protein glycosylation has a major impact on protein–protein interaction and has been shown to play a primary role in various pathologies, for example, in certain types of cancer Citation[152,153] and the hypoxia-induced invasiveness of cancer cells Citation[71], neurodegenerative diseases such as Alzheimer’s Citation[154,155], multiple sclerosis Citation[156], atherosclerosis Citation[157], bleeding disorders Citation[158,159], diabetes Citation[160] and inflammation Citation[161]. Thus, glycosylation is a key target in biomarker discovery, underscored by the fact that several cancer biomarkers are indeed glycoproteins Citation[162] and by the existence of cancer-specific glycan structures Citation[163]. Differential glycoprotein expression might be used for cancer classification, as demonstrated for breast cancer cell lines Citation[164]. Moreover, glycoproteins might be promising markers to reliably detect early cancer forms like hepatocellular carcinoma Citation[165], allowing differentiation from other liver-related diseases such as fibrosis and cirrhosis Citation[166]. However, the assessment of a single biomarker for diagnosis often results in insufficient specificity, whereas monitoring multiple glycoproteins might be the key to increase the specificity and, furthermore, sensitivity in diagnosis Citation[167,168]. Semi-quantitative glycoproteomics is mostly conducted by enrichment of glycosylated peptides from the vast majority of non-glycosylated peptides, for instance, by targeting the strongly pronounced hydrophilicity of glycopeptides by HILIC Citation[67,169]. The reduced net charge of sialic acid containing glycans can be exploited to separate them from the bulk of tryptic peptides by SCX Citation[170]. This can be combined with glycopeptide enrichment based on hydrazide chemistry Citation[171], lectins Citation[172,173] and TiO2-MOAC Citation[174], as well as pre-fractionation techniques such as high-pH-RP Citation[28]. For N-glycosylation analysis, large-scale LC-MS–based profiling so far mostly focuses on the identification of sites rather than glycan structures, as glycopeptide fragment ion spectra can be extremely complex and hard to interpret. Hence, N-glycans are typically removed using Peptide N-Glycosidase F prior to LC-MS analysis, leading to a conversion of Asn to Asp. Such site-specific approaches can identify hundreds or thousands of N-glycosylation sites in a single experiment Citation[5]. The conversion of Asn to Asp induces a mass shift of +1 Da, which is a key feature for the identification of the N-glycosylation sites using LC-MS. However, this deamidation might be an artifact from sample preparation that can even occur within the N-glycosylation consensus motif N-X-S/T Citation[175]. The use of H218O during Peptide N-Glycosidase F digestion introduces a more specific mass shift of +3 Da, which is distinguishable from unspecific deamidation events.
Although recent advances enable large-scale identification of the O-glycoproteome in a similar manner (reviewed recently by Levery et al. Citation[176]), we will here mainly focus on LC-MS–based N-glycoproteomics.
Strategies employing HPLC-based enrichment and fractionation are frequently used especially for the quantitative profiling of N-glycosylation. HPLC columns for lectin-affinity chromatography exhibit high selectivity toward certain glycan structures and might be an excellent choice for studying specific sub-glycoproteomes, as demonstrated for fucosylation in the sera of patients with small cell lung cancer Citation[70]. Zhao et al. recently used an online 2D-LC HILIC-RP setup for the detection of approximately 250 glycosylation sites from iTRAQ-labeled plasma samples from Macaca fascicularis Citation[67].
As previously mentioned, SCX and TiO2 have been used for targeting sialic acid containing glycopeptides Citation[30], but both do not enable a reasonable fractionation or separation from other PTMs, which might lead to signal suppression in LC-MS Citation[17,177]. In contrast, ERLIC might allow overcoming these limitations, as it targets both the reduced net charge and the increased hydrophilicity, as first demonstrated by Lewandrowski et al. Citation[178]. Since then, ERLIC has been used in various N-glycoproteomics profiling studies Citation[179–181] and recently in conjunction with iTRAQ-based quantification as demonstrated by Ren et al. Citation[71]. After ERLIC-based glycopeptide enrichment and N-glycan release, deamidated peptides were iTRAQ-labeled and fractionated in a second ERLIC run, enabling the detection of approximately 200 N-glycosylation sites in an epidermoid carcinoma cell line. Thus, although not yet employed in large-scale glycosylation profiling studies, again ERLIC shows great potential for the enrichment and separation of glycosylated peptides and might complement the toolbox for large-scale N-glycoproteomics Citation[5].
Analyzing proteolytic cleavage in clinical samples
Proteolytic cleavage is an irreversible PTM that occurs on the global proteome scale and is known to determine the intra- or extracellular fate, function, activity and turnover rate of proteins. The enzymes involved in these processes are exo- and endopeptidases, together termed the ‘degradome’. N- or C-terminal signal sequences of newly synthesized proteins can determine their subcellular destination, as shown for the endoplasmic reticulum Citation[182], nucleus Citation[183] or mitochondria Citation[184]. These signal sequences are, in most cases, enzymatically removed after translocation Citation[185,186]. Besides, pro-proteins can mature to an active form by sequential trimming or can be cleaved into smaller functional proteins of the same or even completely different function. This is known for several hormones, such as preproinsulin processing into active insulin upon release of the C-peptide Citation[187] or angiotensin II release by C-terminal cleavage of angiotensin I Citation[188]. On the cellular level, the family of caspases (cysteine proteases), for example, activated upon apoptosis, is well known to process various proteins Citation[189]. The cleavage-based inactivation of focal adhesion kinase proteins by caspases is known to suppress cell–cell-dependent survival signaling in the early stages of apoptosis Citation[190]. Aberrant proteolytic cleavage is connected to a variety of diseases, including cardiovascular and neurodegenerative diseases Citation[191,192], inflammation and impaired wound healing Citation[193], as well as tumor metastasis Citation[194].
The identification of mature protein C- and N-termini, as well as of the so-called ‘neo’ N-termini that are produced upon proteolytic cleavage allows to determine and monitor protease function and to identify substrates, their cleavage sites and, thus, potential consensus motifs. Whereas in the past protein termini were characterized by Edman degradation Citation[195,196], nowadays specific methods for enrichment of N-terminal and C-terminal peptides are applied in conjunction with LC-MS.
The crucial step for a successful, unbiased terminomic analysis is a (more or less) complete derivatization (i.e., labeling) of free termini on the protein level, followed by proteolytic digestion. The labeling step is required to clearly distinguish ‘real’ termini (i.e., terminal peptides) from those generated upon in vitro digestion (i.e., internal peptides). Next, different methods can be applied to separate internal from terminal peptides Citation[197]; however, C-terminal enrichment is complicated due to several reasons. The similar reactivity of C-terminal and Asp/Glu carboxyl groups leads to side reactions, and the generally low reactivity of carboxylic acids reduces labeling efficiency Citation[198].
The first method for large-scale N-terminomics was combined fractional diagonal chromatography (COFRADIC) Citation[199]. In COFRADIC, free N-termini and lysines (primary amines) are blocked on the protein level by deutero-acetylation, followed by a tryptic digestion. Whereas the deutero-acetylation allows distinguishing endogenous from in vitro N-terminal acetylation, the blocked Lys residues cause an ArgC specificity of trypsin. Next, the complex mixture of internal and N-terminal peptides is fractionated by RP-LC. All fractions are individually treated with 2,4,6-trinitrobenzenesulfonic acid, which can only react with free N-termini of internal peptides and induces an increase in hydrophobicity. In a subsequent RP-LC fractionation under the same conditions, the 2,4,6-trinitrobenzenesulfonic acid-derivatized peptides shift to later retention times, whereas unaltered N-terminal peptides retaining their elution behavior can be specifically collected. COFRADIC has been applied to reveal the role of the MPP/Icp55 interplay in the stabilization of the mitochondrial proteome Citation[200] or to characterize proteolytic processing in the secretome of gastric cancer associated myofibroblasts Citation[201]. SCX pre-fractionation and Qcyclase/pGAPase treatment to remove N-pyroglutamyl modifications after tryptic digestion can be used prior to COFRADIC to further increase enrichment specificity Citation[202]. In another powerful method, terminal amine isotopic labeling of substrates (TAILS), after blocking of primary amines on the protein level followed by proteolytic digestion, internal peptides are depleted using an aldehyde-functionalized water-soluble polymer Citation[203]. TAILS was successfully employed to investigate proteolytic events and the role of MMP2 during skin inflammation Citation[204], as well as of dipeptidyl peptidases 8 and 9 in energy metabolism and homeostasis Citation[205]. Recently, TAILS has been used for characterizing proteolytic events upon inflammation and wound healing Citation[206], and during platelet storage Citation[207].
We recently introduced charge-based FRADIC (ChaFRADIC) which makes use of the same principle as COFRADIC, however, using a 2D SCX-based charge state separation Citation[31]. This reduces the number of fractions obtained and, moreover, proved to be robust and highly sensitive for the identification of N-terminal peptides. After blocking of primary amines on the protein level and tryptic digestion (Arg-C specificity), the generated peptides are fractionated according to their charge state at pH 2.7. The internal peptides in each fraction (five fractions, charge state +1–≥+4) are subsequently deutero-acetylated, leading to a reduction in net charge. In a second SCX separation under the same conditions, the internal peptides consequently shift to an earlier charge state fraction, whereas N-terminal peptides retain their retention time window. ChaFRADIC allows a highly sensitive N-terminal enrichment, yielding considerable coverage of the N-terminome from less than 100 µg of cell lysate. Importantly, both FRADIC approaches can be adapted to enrich for other PTMs Citation[208].
Top-down protein analysis – current use & future perspectives
In top-down proteomics, intact proteins rather than peptides are analyzed by MS. Top-down-MS has been classically applied to characterize purified proteins and low-complexity protein mixtures, mainly due to separation and sensitivity issues, as proteins are considerably more heterogeneous than peptides. In recent years, these limitations have been partly overcome by new, efficient methods and instrumental developments. For a comprehensive overview of this fascinating and still emerging field, excellent reviews by the groups of MacLafferty and Kelleher Citation[209,210] can be referred to. To date, in clinical research, top-down-MS is mostly used to monitor distinct biomarker proteins, for example, those extracted from body fluids, such as monoclonal immunoglobulins from patient sera as a marker for monoclonal gammopathy Citation[211], as well as diabetes marker proteins, metabolites and PTMs of blood proteins Citation[212]. Moreover, matrix-assisted laser desorption/ionization (MALDI) top-down MS (as reviewed in Citation[213]) has been applied for diagnostic imaging of patient tissue resections, such as HER2 receptor status classification in breast cancer tissues Citation[214].
The probably most exciting feature of intact protein analysis is that given sufficient separation power, high mass accuracy, resolution and sensitivity, different ‘proteoforms’ Citation[215] can be distinguished. Hence, is it possible to deduce whether certain PTM regulations derive from the same protein molecule or represent different proteoforms – a clear advantage over the currently mostly used bottom-up approaches. Consequently, top-down-MS also enables the determination of site occupancies and, even more, the analysis of PTM crosstalk Citation[16].
Particularly the past 5 years have shown enormous progress in the applicability and power of top-down studies. Tran et al. utilized in-solution isoelectric focusing followed by gel elution liquid fraction entrapment electrophoresis (GELFrEE) and nano-LC-MS to identify 1043 protein accessions from 1045 genes (77% N-terminally acetylated), comprising 3039 proteoforms with different PTM patterns Citation[216]. Whereas large-scale top-down analysis has been rather restricted to small proteins, more recent developments have a good coverage of the proteome up to 50 kDa Citation[217], including integral membrane proteins Citation[218]. Lately, the field focused on transferring powerful bottom-up quantification strategies such as label free quantification Citation[219] and NeuCODE Citation[220] to top-down proteomics. These recent achievements show great promise for further advancing this technology into a highly valuable tool for PTM-related clinical research.
Expert commentary
The LC-MS–based analysis of clinically relevant PTMs has considerably improved over the past 10 years. Nowadays, sophisticated strategies enable the analysis of hundreds to thousands of PTMs form as little as 100 µg of protein starting material. However, to further reduce the required sample material, PTM enrichment strategies have to be refined to yield a quantitative recovery and, thus, maximize sensitivity – as sensitivity is the key to identifying low-abundant modified peptides. Considering a detection limit of 100 amol on column and a fully quantitative recovery (which is far from reality), identifying a peptide derived from a protein expressed with 10 copies per cell would require to start with at least 6 × 10⁶ cells. In case of HeLa, this would correspond to approximately 2–3 mg of protein as the starting material. However, if under the same conditions the sample material was limited to merely 600 cells, only proteins above 100,000 copies per cell could be identified. This is the case for less than half of a typical cancer cell line proteome Citation[221]. Notably, the low stoichiometry of PTMs further complicates detection and confident identification.
Figure 4. Protein copy number distribution in HeLa cells Citation[221] and copy numbers of some prominent cancer biomarkers. (*indicates a membrane protein). Dashed lines give the limits of detection when analyzing a certain number of cells, assuming a full quantitative recovery and a limit of detection of 100 amol. If only 600 cells are available, approximately 20% of the proteome will be covered.
![Figure 4. Protein copy number distribution in HeLa cells Citation[221] and copy numbers of some prominent cancer biomarkers. (*indicates a membrane protein). Dashed lines give the limits of detection when analyzing a certain number of cells, assuming a full quantitative recovery and a limit of detection of 100 amol. If only 600 cells are available, approximately 20% of the proteome will be covered.](/cms/asset/c412c433-f5aa-4ac6-b978-b039c6b95bcd/ieru_a_1042867_f0004_ob.jpg)
Besides sensitivity, LC-MS analysis time is the major bottleneck for large sample cohorts since many strategies rely on extensive peptide fractionation. To reduce the number of LC-MS runs, using state-of-the-art MS instruments that provide excellent scan rates is mandatory. Current mass spectrometers with acquisition rates of approximately 20 Hz enable the detection of 10,000 peptides per hour LC-MS time Citation[222], indicating that owing to technical advances, extensive fractionation might become less and less mandatory. Considering recent, and to be anticipated future improvement in sample preparation, enrichment strategies and LC-MS instrumentation, large-scale clinical proteomics of PTMs from limited sample material might be feasible in the near future.
Despite the numerous studies which efficiently target single PTMs, the knowledge about PTM crosstalk (reviewed in Citation[16]) is rather limited. Several examples for crosstalk events have been reported, such as phosphorylation-dependent ubiquitination in EGFR/MAPK signaling Citation[223], or phosphorylation-dependent SUMOylation on heat-shock proteins Citation[224], as well as the crosstalk between O-GlcNAc and phosphorylation in the stabilization of p53 Citation[225]. Particularly, crosstalk-mediated regulation of histones is well investigated and involves many PTMs, among which are included phosphorylation, lysine acetylation Citation[226] and arginine methylation Citation[227]. Thus, a single PTM-related discovery might not necessarily reveal the entire complexity of a corresponding PTM-dependent regulation. In-depth investigation of PTM crosstalk by combining several single-PTM analyses with highly sophisticated sample preparation strategies can be conducted, but so far has mostly required huge sample amounts and hundreds of hours of LC-MS time.
In conclusion, recent methodological advances in PTM research should be considered as valuable toolbox for the future development of more sensitive and time-efficient strategies that allow analyzing putative PTM codes even in clinical samples. This is particularly important not only for the discovery of novel, clinically relevant pathways and their interconnections, but also for treatment response studies in clinical trials Citation[228].
Five-year view
In the past two decades, MS-based proteomics has been a highly dynamic field with a strong impact on life science. This development has been boosted by the continuous development of more sensitive instrumentation, methodology and novel commercial applications. It can be expected that this trend will continue for the next 5 years, providing researchers even faster and more sensitive and powerful MS instrumentation. Faster acquisition rates will further reduce undersampling and, thus, improve the overlap between replicates. Data-independent acquisition methods are getting increasingly popular and may also have a strong impact on clinical research Citation[229,230], especially in early discovery phase experiments, as demonstrated in a recently published protocol for fast and reproducible quantitative proteome mapping with approximately 1 mg of tissue biopsy samples Citation[231]. Quality control measures established in recent years will further enhance sample preparation and analysis, with an impact on recovery, robustness and sensitivity of future studies Citation[43]. Ongoing efforts for automation and standardization of typical proteomics workflows and new developments such as NeuCode to expand multiplexing capabilities for quantitative proteomics show great promise to increase throughput and, thus, drive quantitative proteomics more toward clinical application. Alternative to the classical bottom-up proteomics, sophisticated top-down Citation[232] and middle-down Citation[233] approaches will allow a more detailed study of complex PTM patterns derived from the very same protein molecule. The development of novel MALDI-MS imaging techniques might allow to screen and visualize biomarkers directly from the tissue in order to aid pathological assessment in a clinical environment Citation[234]. To conclude, the recent and upcoming developments in the field are most exciting promises for the future that would help to exploit the full potential of MS-based proteomics for revealing disease mechanisms, identifying biomarker panels and developing diagnostic assays to path the way for a new age of personalized medicine.
LC-mass spectrometry (MS)–based post-translational modification (PTM) research enables the quantification of hundreds to thousands of PTMs in a single experiment. However, the link between aberrant PTM patterns and disease or during drug treatment is still poorly understood and is one of the main goals of LC-MS–based PTM research.
Typical workflows for analyzing PTMs are conducted on the peptide level, which allows specific enrichment of modified peptides from the bulk of non-modified peptides, prior to LC-MS analysis. Thus, the low abundance of PTMs can be overcome in the light of the dynamic range of mammalian cells.
State-of-the-art workflows enable quantitative analysis from less than 100 µg of cell lysate. Whereas in cell culture-based experiments sufficient sample is readily available, clinical applications with patient samples require highest sensitivity and robustness.
In clinical proteomics, label-free quantification, super-SILAC and chemical labels can be employed for large-scale quantitative discovery. Modified peptides that may serve as biomarkers can be validated with larger cohorts using targeted MS methods such as multiple reaction monitoring (MRM) or parallel reaction monitoring (PRM). These can also be designed for diagnostic purposes.
Aberrant protein phosphorylation has been connected to a wide variety of diseases. Nowadays, various sensitive phosphopeptide enrichment methods such as Ti4+-IMAC, TiO2-MOAC and electrostatic repulsion-hydrophilic interaction liquid chromatography (ERLIC) are established. Particularly, ERLIC is a simple and sensitive method for enrichment and simultaneous fractionation of both singly and multiphosphorylated peptides.
Glycosylation is an extremely heterogeneous group of PTMs that is characterized by the attachment of complex carbohydrate structures to proteins. Various cancer biomarkers are glycoproteins and several studies indicate that both glycosylation levels and glycan structures are potential biomarkers. Although dedicated enrichment methods are available for glycopeptides, site-specific analysis of glycosylation structure is challenging. Therefore, most studies focus on monitoring glycosylation sites rather than resolving glycan structures.
Proteolytic processing is a ubiquitous, non-reversible PTM. Generated ‘neo’-N-termini can be enriched using methods such as combined fractional diagonal chromatography (COFRADIC), terminal amine isotopic labeling of substrates (TAILS) and charge-based fractional diagonal chromatography (ChaFRADIC). These enable the identification of protease substrates as well as their distinct cleavage sites. Charge-based fractional diagonal chromatography has been demonstrated to be a sensitive and straightforward method that might be applicable for clinical proteomics. The analysis of ‘neo’-C-termini, however, is still more challenging.
The role of PTM crosstalk is still not well understood. The current limitations in performing real large-scale PTM crosstalk analyses render the development of adequate clinical biomarker assays that target peptides with different modifications extremely challenging and rather unlikely for the near future.
Financial & competing interests disclosure
The authors were supported by the Ministerium für Innovation, Wissenschaft und Forschung des Landes Nordrhein-Westfalen and the Deutsche Forschungsgemeinschaft (DFG ZA 639/4-1). The authors have no other relevant affiliations or financial involvement with any organization or entity with a financial interest in or financial conflict with the subject matter or materials discussed in the manuscript apart from those disclosed.
No writing assistance was utilized in the production of this manuscript.
Notes
References
- UniProt Consortium. UniProt: a hub for protein information. Nucleic Acids Res 2015;43(D1):D204-12
- Okada M. Post-translational isoprenylation of tryptophan. Biosci Biotechnol Biochem 2011;75(8):1413-17
- Nolan EM, Walsh CT. Investigations of the MceIJ-catalyzed posttranslational modification of the microcin E492 C-terminus: linkage of ribosomal and nonribosomal peptides to form “trojan horse” antibiotics. Biochemistry 2008;47(35):9289-99
- Hornbeck PV, Kornhauser JM, Tkachev S, et al. PhosphoSitePlus: a comprehensive resource for investigating the structure and function of experimentally determined post-translational modifications in man and mouse. Nucleic Acids Res 2012;40(Database issue):D261-70
- Thaysen-Andersen M, Packer NH. Advances in LC-MS/MS-based glycoproteomics: getting closer to system-wide site-specific mapping of the N- and O-glycoproteome. Biochim Biophys Acta 2014;1844(9):1437-52
- Tutturen AE, Fleckenstein B, de Souza GA. Assessing the citrullinome in rheumatoid arthritis synovial fluid with and without enrichment of citrullinated peptides. J Proteome Res 2014;13(6):2867-73
- Doll S, Burlingame AL. Mass spectrometry-based detection and assignment of protein posttranslational modifications. ACS Chem Biol 2015;10(1):63-71
- Hornbeck PV, Zhang B, Murray B, et al. PhosphoSitePlus, 2014: mutations, PTMs and recalibrations. Nucleic Acids Res 2015;43(Database issue):D512-20
- Matic I, Ahel I, Hay RT. Reanalysis of phosphoproteomics data uncovers ADP-ribosylation sites. Nat Methods 2012;9(8):771-2
- Martens L, Hermjakob H, Jones P, et al. PRIDE: the proteomics identifications database. Proteomics 2005;5(13):3537-45
- Vizcaino JA, Deutsch EW, Wang R, et al. ProteomeXchange provides globally coordinated proteomics data submission and dissemination. Nat Biotechnol 2014;32(3):223-6
- Vaudel M, Burkhart JM, Zahedi RP, et al. PeptideShaker enables reanalysis of MS-derived proteomics data sets. Nat Biotechnol 2015;33(1):22-4
- Hunter T. The age of crosstalk: phosphorylation, ubiquitination, and beyond. Mol Cell 2007;28(5):730-8
- Lothrop AP, Torres MP, Fuchs SM. Deciphering post-translational modification codes. FEBS Lett 2013;587(8):1247-57
- Peng M, Scholten A, Heck AJ, van Breukelen B. Identification of enriched PTM crosstalk motifs from large-scale experimental data sets. J Proteome Res 2014;13(1):249-59
- Venne AS, Kollipara L, Zahedi RP. The next level of complexity: crosstalk of posttranslational modifications. Proteomics 2014;14(4-5):513-24
- Pasing Y, Sickmann A, Lewandrowski U. N-glycoproteomics: mass spectrometry-based glycosylation site annotation. Biol Chem 2012;393(4):249-58
- Di Palma S, Zoumaro-Djayoon A, Peng M, et al. Finding the same needles in the haystack? A comparison of phosphotyrosine peptides enriched by immuno-affinity precipitation and metal-based affinity chromatography. J Proteomics 2013;91:331-7
- Beck F, Geiger J, Gambaryan S, et al. Time-resolved characterization of cAMP/PKA-dependent signaling reveals that platelet inhibition is a concerted process involving multiple signaling pathways. Blood 2014;123(5):e1-e10
- Loroch S, Zahedi RP, Sickmann A. Highly sensitive phosphoproteomics by tailoring solid-phase extraction to electrostatic repulsion-hydrophilic interaction chromatography. Anal Chem 2015;87(3):1596-604
- Burkhart JM, Schumbrutzki C, Wortelkamp S, et al. Systematic and quantitative comparison of digest efficiency and specificity reveals the impact of trypsin quality on MS-based proteomics. J Proteomics 2012;75(4):1454-62
- Meyer JG, Kim S, Maltby DA, et al. Expanding proteome coverage with orthogonal-specificity alpha-lytic proteases. Mol Cell Proteomics 2014;13(3):823-35
- Loroch S, Dickhut C, Zahedi RP, Sickmann A. Phosphoproteomics–more than meets the eye. Electrophoresis 2013;34(11):1483-92
- Rogers LD, Overall CM. Proteolytic post-translational modification of proteins: proteomic tools and methodology. Mol Cell Proteomics 2013;12(12):3532-42
- Pinkse MW, Uitto PM, Hilhorst MJ, et al. Selective isolation at the femtomole level of phosphopeptides from proteolytic digests using 2D-NanoLC-ESI-MS/MS and titanium oxide precolumns. Anal Chem 2004;76(14):3935-43
- Mithoe SC, Boersema PJ, Berke L, et al. Targeted quantitative phosphoproteomics approach for the detection of phospho-tyrosine signaling in plants. J Proteome Res 2012;11(1):438-48
- Batth TS, Francavilla C, Olsen JV. Off-Line High-pH Reversed-Phase Fractionation for In-Depth Phosphoproteomics. J Proteome Res 2014;13(12):6176-86
- Parker BL, Thaysen-Andersen M, Solis N, et al. Site-specific glycan-peptide analysis for determination of N-glycoproteome heterogeneity. J Proteome Res 2013;12(12):5791-800
- Peng J, Elias JE, Thoreen CC, et al. Evaluation of multidimensional chromatography coupled with tandem mass spectrometry (LC/LC-MS/MS) for large-scale protein analysis: the yeast proteome. J Proteome Res 2003;2(1):43-50
- Lohrig K, Sickmann A, Lewandrowski U. Strong cation exchange chromatography for analysis of sialylated glycopeptides. Methods Mol Biol 2011;753:299-308
- Venne AS, Vogtle FN, Meisinger C, et al. Novel highly sensitive, specific, and straightforward strategy for comprehensive N-terminal proteomics reveals unknown substrates of the mitochondrial peptidase Icp55. J Proteome Res 2013;12(9):3823-30
- Engholm-Keller K, Birck P, Storling J, et al. TiSH–a robust and sensitive global phosphoproteomics strategy employing a combination of TiO2, SIMAC, and HILIC. J Proteomics 2012;75(18):5749-61
- Zhou H, Di Palma S, Preisinger C, et al. Toward a comprehensive characterization of a human cancer cell phosphoproteome. J Proteome Res 2013;12(1):260-71
- Cheng K, Chen R, Seebun D, et al. Large-scale characterization of intact N-glycopeptides using an automated glycoproteomic method. J Proteomics 2014;110:145-54
- Valastyan S, Weinberg RA. Tumor metastasis: molecular insights and evolving paradigms. Cell 2011;147(2):275-92
- Kabashima-Niibe A, Higuchi H, Takaishi H, et al. Mesenchymal stem cells regulate epithelial-mesenchymal transition and tumor progression of pancreatic cancer cells. Cancer Sci 2013;104(2):157-64
- Ficarro SB, Zhang Y, Carrasco-Alfonso MJ, et al. Online nanoflow multidimensional fractionation for high efficiency phosphopeptide analysis. Mol Cell Proteomics 2011;10(11):O111 011064
- Megger DA, Bracht T, Meyer HE, Sitek B. Label-free quantification in clinical proteomics. Biochim Biophys Acta 2013;1834(8):1581-90
- Hu B, Niu X, Cheng L, et al. Discovering cancer biomarkers from clinical samples by protein microarrays. Proteomics Clin Appl 2015;9(1-2):98-110
- Parker CE, Borchers CH. Mass spectrometry based biomarker discovery, verification, and validation – Quality assurance and control of protein biomarker assays. Mol Oncol 2014;8(4):840-58
- Manza LL, Stamer SL, Ham AJ, et al. Sample preparation and digestion for proteomic analyses using spin filters. Proteomics 2005;5(7):1742-5
- Wisniewski JR, Zougman A, Nagaraj N, Mann M. Universal sample preparation method for proteome analysis. Nat Meth 2009;6(5):359-62
- Hughes CS, Foehr S, Garfield DA, et al. Ultrasensitive proteome analysis using paramagnetic bead technology. Mol Syst Biol 2014;10:757
- Masuda T, Sugiyama N, Tomita M, Ishihama Y. Microscale phosphoproteome analysis of 10,000 cells from human cancer cell lines. Anal Chem 2011;83(20):7698-703
- Lam MP, Lau E, Siu SO, et al. Online combination of reversed-phase/reversed-phase and porous graphitic carbon liquid chromatography for multicomponent separation of proteomics and glycoproteomics samples. Electrophoresis 2011;32(21):2930-40
- Olsen JV, Mann M. Status of large-scale analysis of post-translational modifications by mass spectrometry. Mol Cell Proteomics 2013;12(12):3444-52
- Zybailov B, Mosley AL, Sardiu ME, et al. Statistical analysis of membrane proteome expression changes in Saccharomyces cerevisiae. J Proteome Res 2006;5(9):2339-47
- Wang W, Zhou H, Lin H, et al. Quantification of proteins and metabolites by mass spectrometry without isotopic labeling or spiked standards. Anal Chem 2003;75(18):4818-26
- Vaudel M, Burkhart JM, Breiter D, et al. A complex standard for protein identification, designed by evolution. J Proteome Res 2012;11(10):5065-71
- Cox J, Hein MY, Luber CA, et al. Accurate proteome-wide label-free quantification by delayed normalization and maximal peptide ratio extraction, termed MaxLFQ. Molecular Cell Proteomics 2014;13(9):2513-26
- Luber CA, Cox J, Lauterbach H, et al. Quantitative proteomics reveals subset-specific viral recognition in dendritic cells. Immunity 2010;32(2):279-89
- Geiger T, Cox J, Ostasiewicz P, et al. Super-SILAC mix for quantitative proteomics of human tumor tissue. Nat Methods 2010;7(5):383-5
- Schweppe DK, Rigas JR, Gerber SA. Quantitative phosphoproteomic profiling of human non-small cell lung cancer tumors. J Proteomics 2013;91:286-96
- Boersema PJ, Geiger T, Wisniewski JR, Mann M. Quantification of the N-glycosylated secretome by super-SILAC during breast cancer progression and in human blood samples. Mol Cell Proteomics 2013;12(1):158-71
- Melo-Braga MN, Schulz M, Liu Q, et al. Comprehensive quantitative comparison of the membrane proteome, phosphoproteome, and sialiome of human embryonic and neural stem cells. Mol Cell Proteomics 2014;13(1):311-28
- Jentoft N, Dearborn DG. Labeling of proteins by reductive methylation using sodium cyanoborohydride. J Biol Chem 1979;254(11):4359-65
- Ross PL, Huang YN, Marchese JN, et al. Multiplexed protein quantitation in Saccharomyces cerevisiae using amine-reactive isobaric tagging reagents. Mol Cell Proteomics 2004;3(12):1154-69
- Treitz C, Cassidy L, Hockendorf A, et al. Quantitative proteome analysis of Caenorhabditis elegans upon exposure to nematicidal Bacillus thuringiensis. J Proteomics 2015;113:337-50
- Thompson A, Schafer J, Kuhn K, et al. Tandem mass tags: a novel quantification strategy for comparative analysis of complex protein mixtures by MS/MS. Anal Chem 2003;75(8):1895-904
- Erickson BK, Jedrychowski MP, McAlister GC, et al. Evaluating multiplexed quantitative phosphopeptide analysis on a hybrid quadrupole mass filter/linear ion trap/Orbitrap mass spectrometer. Anal Chem 2015;87(2):1241-9
- Venne AS, Solari FA, Faden F, et al. An improved workflow for quantitative N-terminal charge-based fractional diagonal chromatography (ChaFRADIC) to study proteolytic events in Arabidopsis thaliana, Proteomics 2015; In press
- Thingholm TE, Palmisano G, Kjeldsen F, Larsen MR. Undesirable charge-enhancement of isobaric tagged phosphopeptides leads to reduced identification efficiency. J Proteome Res 2010;9(8):4045-52
- Pichler P, Köcher T, Holzmann J, et al. Peptide labeling with isobaric tags yields higher identification rates using iTRAQ 4-Plex Compared to TMT 6-Plex and iTRAQ 8-Plex on LTQ Orbitrap. Anal Chem 2010;82(15):6549-58
- Vaudel M, Burkhart JM, Radau S, et al. Integral quantification accuracy estimation for reporter ion-based quantitative proteomics (iQuARI). J Proteome Res 2012;11(10):5072-80
- Karp NA, Huber W, Sadowski PG, et al. Addressing accuracy and precision issues in iTRAQ quantitation. Mol Cell Proteomics 2010;9(9):1885-97
- Ting L, Rad R, Gygi SP, Haas W. MS3 eliminates ratio distortion in isobaric multiplexed quantitative proteomics. Nat Meth 2011;8(11):937-40
- Zhao Y, Szeto SS, Kong RP, et al. Online two-dimensional porous graphitic carbon/reversed phase liquid chromatography platform applied to shotgun proteomics and glycoproteomics. Anal Chem 2014;86(24):12172-9
- Fahlman RP, Chen W, Overall CM. Absolute proteomic quantification of the activity state of proteases and proteolytic cleavages using proteolytic signature peptides and isobaric tags. J Proteomics 2014;100:79-91
- Glibert P, Meert P, Van Steendam K, et al. Phospho-iTRAQ: assessing isobaric labels for the large-scale study of phosphopeptide stoichiometry. J Proteome Res 2015;14(2):839-49
- Ahn JM, Sung HJ, Yoon YH, et al. Integrated glycoproteomics demonstrates fucosylated serum paraoxonase 1 alterations in small cell lung cancer. Mol Cell Proteomics 2014;13(1):30-48
- Ren Y, Hao P, Law SK, Sze SK. Hypoxia-induced changes to integrin alpha 3 glycosylation facilitate invasion in epidermoid carcinoma cell line A431. Mol Cell Proteomics 2014;13(11):3126-37
- Hebert AS, Merrill AE, Bailey DJ, et al. Neutron-encoded mass signatures for multiplexed proteome quantification. Nat Methods 2013;10(4):332-4
- Hebert AS, Merrill AE, Stefely JA, et al. Amine-reactive neutron-encoded labels for highly plexed proteomic quantitation. Mol Cell Proteomics 2013;12(11):3360-9
- Frost DC, Greer T, Li L. High-Resolution Enabled 12-Plex DiLeu Isobaric Tags for Quantitative Proteomics. Anal Chem 2015;87(3):1646-54
- Mohammed Y, Domanski D, Jackson AM, et al. PeptidePicker: a scientific workflow with web interface for selecting appropriate peptides for targeted proteomics experiments. J Proteomics 2014;106:151-61
- Domon B, Gallien S. Recent advances in targeted proteomics for clinical applications. Proteomics Clin Appl 2014. [Epub ahead of print]
- Carr SA, Abbatiello SE, Ackermann BL, et al. Targeted peptide measurements in biology and medicine: best practices for mass spectrometry-based assay development using a fit-for-purpose approach. Mol Cell Proteomics 2014;13(3):907-17
- Abbatiello SE, Mani DR, Schilling B, et al. Design, implementation and multisite evaluation of a system suitability protocol for the quantitative assessment of instrument performance in liquid chromatography-multiple reaction monitoring-MS (LC-MRM-MS). Mol Cell Proteomics 2013;12(9):2623-39
- Percy AJ, Chambers AG, Yang J, et al. Method and platform standardization in MRM-based quantitative plasma proteomics. J Proteomics 2013;95:66-76
- Goldman R, Sanda M. Targeted methods for quantitative analysis of protein glycosylation. Proteomics Clini Appl 2015;9(1-2):17-32
- Narumi R, Murakami T, Kuga T, et al. A strategy for large-scale phosphoproteomics and SRM-based validation of human breast cancer tissue samples. J Proteome Res 2012;11(11):5311-22
- Yoneyama T, Ohtsuki S, Ono M, et al. Quantitative targeted absolute proteomics-based large-scale quantification of proline-hydroxylated alpha-fibrinogen in plasma for pancreatic cancer diagnosis. J Proteome Res 2013;12(2):753-62
- Hernandez B, Parnell A, Pennington SR. Why have so few proteomic biomarkers "survived" validation? (Sample size and independent validation considerations). Proteomics 2014;14(13-14):1587-92
- Christin C, Hoefsloot HC, Smilde AK, et al. A critical assessment of feature selection methods for biomarker discovery in clinical proteomics. Mol Cell Proteomics 2013;12(1):263-76
- Skates SJ, Gillette MA, LaBaer J, et al. Statistical design for biospecimen cohort size in proteomics-based biomarker discovery and verification studies. J Proteome Res 2013;12(12):5383-94
- Kammers K, Cole RN, Tiengwe C, Ruczinski I. Detecting Significant Changes in Protein Abundance. EuPA Open Proteomics 2015;7:11-19
- Dunkler D, Sanchez-Cabo F, Heinze G. Statistical analysis principles for Omics data. Methods Mol Biol 2011;719:113-31
- Wheelock AM, Wheelock CE. Trials and tribulations of ’omics data analysis: assessing quality of SIMCA-based multivariate models using examples from pulmonary medicine. Mol Biosyst 2013;9(11):2589-96
- Ting L, Cowley MJ, Hoon SL, et al. Normalization and statistical analysis of quantitative proteomics data generated by metabolic labeling. Mol Cell Proteomics 2009;8(10):2227-42
- Margolin AA, Ong SE, Schenone M, et al. Empirical Bayes analysis of quantitative proteomics experiments. PLoS ONE 2009;4(10):e7454
- Datta S, Satten GA, Benos DJ, et al. An empirical bayes adjustment to increase the sensitivity of detecting differentially expressed genes in microarray experiments. Bioinformatics 2004;20(2):235-42
- Wettenhall JM, Smyth GK. limmaGUI: a graphical user interface for linear modeling of microarray data. Bioinformatics 2004;20(18):3705-6
- Ritchie ME, Phipson B, Wu D, et al. limma powers differential expression analyses for RNA-sequencing and microarray studies. Nucleic Acids Res 2015. [Epub ahead of print]
- Van Hoof D, Munoz J, Braam SR, et al. Phosphorylation dynamics during early differentiation of human embryonic stem cells. Cell Stem Cell 2009;5(2):214-26
- Kaibuchi K, Sano K, Hoshijima M, et al. Phosphatidylinositol turnover in platelet activation; calcium mobilization and protein phosphorylation. Cell Calcium 1982;3(4-5):323-35
- Dephoure N, Zhou C, Villen J, et al. A quantitative atlas of mitotic phosphorylation. Proc Natl Acad Sci USA 2008;105(31):10762-7
- Tepper K, Biernat J, Kumar S, et al. Oligomer formation of tau protein hyperphosphorylated in cells. J Biol Chem 2014;289(49):34389-407
- Ohno M. Roles of eIF2alpha kinases in the pathogenesis of Alzheimer’s disease. Front Mol Neurosci 2014;7:22
- Grundke-Iqbal I, Iqbal K, Tung YC, et al. Abnormal phosphorylation of the microtubule-associated protein tau (tau) in Alzheimer cytoskeletal pathology. Proc Natl Acad Sci USA 1986;83(13):4913-17
- Scheuner D, Mierde DV, Song B, et al. Control of mRNA translation preserves endoplasmic reticulum function in beta cells and maintains glucose homeostasis. Nat Med 2005;11(7):757-64
- Ortsäter H, Grankvist N, Honkanen RE, Sjöholm Å. Protein phosphatases in pancreatic islets. J Endocrinol 2014;221(3):R121-44
- Meyerovitch J, Backer JM, Kahn CR. Hepatic phosphotyrosine phosphatase activity and its alterations in diabetic rats. J Clin Invest 1989;84(3):976-83
- Blume-Jensen P, Hunter T. Oncogenic kinase signalling. Nature 2001;411(6835):355-65
- Zanivan S, Meves A, Behrendt K, et al. In vivo SILAC-based proteomics reveals phosphoproteome changes during mouse skin carcinogenesis. Cell reports 2013;3(2):552-66
- Huelsemann MF, Patz M, Beckmann L, et al. Hypoxia-induced p38 MAPK activation reduces Mcl-1 expression and facilitates sensitivity towards BH3 mimetics in chronic lymphocytic leukemia. Leukemia 2014;29(4):981-4
- Decker RS, Decker ML, Kulikovskaya I, et al. Myosin-binding protein C phosphorylation, myofibril structure, and contractile function during low-flow ischemia. Circulation 2005;111(7):906-12
- El-Armouche A, Pohlmann L, Schlossarek S, et al. Decreased phosphorylation levels of cardiac myosin-binding protein-C in human and experimental heart failure. J Mol Cell Cardiol 2007;43(2):223-9
- Schoutsen B, Blom JJ, Verdouw PD, Lamers JM. Calcium transport and phospholamban in sarcoplasmic reticulum of ischemic myocardium. J Mol Cell Cardiol 1989;21(7):719-27
- Tedford NC, Hall AB, Graham JR, et al. Quantitative analysis of cell signaling and drug action via mass spectrometry-based systems level phosphoproteomics. Proteomics 2009;9(6):1469-87
- Kumar A, Baycin-Hizal D, Shiloach J, et al. Coupling enrichment and proteomics methods for understanding and treating disease. Proteomics Clin Appl 2015;9(1-2):33-47
- Soderblom EJ, Thompson JW, Schwartz EA, et al. Proteomic analysis of ERK1/2-mediated human sickle red blood cell membrane protein phosphorylation. Clin Proteomics 2013;10(1):1
- Nyman E, Rajan MR, Fagerholm S, et al. A Single Mechanism Can Explain Network-wide Insulin Resistance in Adipocytes from Obese Patients with Type 2 Diabetes. J Biological Chem 2014;289(48):33215-30
- Andersson L, Porath J. Isolation of phosphoproteins by immobilized metal (Fe3+) affinity chromatography. Anal Biochem 1986;154(1):250-4
- Ruprecht B, Koch H, Medard G, et al. Comprehensive and reproducible phosphopeptide enrichment using Fe-IMAC columns. Mol Cell Proteomics 2015;14(1):205-15
- Yu Z, Han G, Sun S, et al. Preparation of monodisperse immobilized Ti(4+) affinity chromatography microspheres for specific enrichment of phosphopeptides. Anal Chim Acta 2009;636(1):34-41
- de Graaf EL, Giansanti P, Altelaar AF, Heck AJ. Single-step Enrichment by Ti4+-IMAC and Label-free Quantitation Enables In-depth Monitoring of Phosphorylation Dynamics with High Reproducibility and Temporal Resolution. Mol Cell Proteomics 2014;13(9):2426-34
- Paulo JA, McAllister FE, Everley RA, et al. Effects of MEK inhibitors GSK1120212 and PD0325901 in vivo using 10-plex quantitative proteomics and phosphoproteomics. Proteomics 2015;15(2-3):462-73
- Kelstrup CD, Jersie-Christensen RR, Batth TS, et al. Rapid and Deep Proteomes by Faster Sequencing on a Benchtop Quadrupole Ultra-High-Field Orbitrap Mass Spectrometer. J Proteome Res 2014;13(12):6187-95
- Gruhler A, Olsen JV, Mohammed S, et al. Quantitative phosphoproteomics applied to the yeast pheromone signaling pathway. Mol Cell Proteomics 2005;4(3):310-27
- Olsen JV, Blagoev B, Gnad F, et al. Global, in vivo, and site-specific phosphorylation dynamics in signaling networks. Cell 2006;127(3):635-48
- McNulty DE, Annan RS. Hydrophilic interaction chromatography reduces the complexity of the phosphoproteome and improves global phosphopeptide isolation and detection. Mol Cell Proteomics 2008;7(5):971-80
- Herskowitz JH, Seyfried NT, Duong DM, et al. Phosphoproteomic analysis reveals site-specific changes in GFAP and NDRG2 phosphorylation in frontotemporal lobar degeneration. J Proteome Res 2010;9(12):6368-79
- Gauci S, Helbig AO, Slijper M, et al. Lys-N and trypsin cover complementary parts of the phosphoproteome in a refined SCX-based approach. Anal Chem 2009;81(11):4493-501
- Alpert AJ. Electrostatic repulsion hydrophilic interaction chromatography for isocratic separation of charged solutes and selective isolation of phosphopeptides. Anal Chem 2008;80(1):62-76
- Chien KY, Liu HC, Goshe MB. Development and application of a phosphoproteomic method using electrostatic repulsion-hydrophilic interaction chromatography (ERLIC), IMAC, and LC-MS/MS analysis to study Marek’s Disease Virus infection. J Proteome Res 2011;10(9):4041-53
- Hao P, Ren Y, Dutta B, Sze SK. Comparative evaluation of electrostatic repulsion-hydrophilic interaction chromatography (ERLIC) and high-pH reversed phase (Hp-RP) chromatography in profiling of rat kidney proteome. J Proteomics 2013;82:254-62
- Chen X, Wu D, Zhao Y, et al. Increasing phosphoproteome coverage and identification of phosphorylation motifs through combination of different HPLC fractionation methods. J Chromatogr B Analyt Technol Biomed Life Sci 2011;879(1):25-34
- Gan CS, Guo T, Zhang H, et al. A comparative study of electrostatic repulsion-hydrophilic interaction chromatography (ERLIC) versus SCX-IMAC-based methods for phosphopeptide isolation/enrichment. J Proteome Res 2008;7(11):4869-77
- Loroch S, Schommartz T, Brune W, et al. Multidimensional electrostatic repulsion–hydrophilic interaction chromatography (ERLIC) for quantitative analysis of the proteome and phosphoproteome in clinical and biomedical research. Biochi Biophys Acta 2015;1854(5(0):460-8
- Dickhut C, Feldmann I, Lambert J, Zahedi RP. Impact of Digestion Conditions on Phosphoproteomics. J Proteome Res 2014;13(6):2761-70
- Glatter T, Ludwig C, Ahrne E, et al. Large-scale quantitative assessment of different in-solution protein digestion protocols reveals superior cleavage efficiency of tandem Lys-C/trypsin proteolysis over trypsin digestion. J Proteome Res 2012;11(11):5145-56
- Bian Y, Ye M, Song C, et al. Improve the coverage for the analysis of phosphoproteome of HeLa cells by a tandem digestion approach. J Proteome Res 2012;11(5):2828-37
- Gonczarowska-Jorge H, Dell’Aica M, Dickhut C, RP Z. Variable digestion strategies for phosphoproteomics analysis. Methods Mol Biol Clifton, N.J 2015; In press
- Taus T, Kocher T, Pichler P, et al. Universal and confident phosphorylation site localization using phosphoRS. J Proteome Res 2011;10(12):5354-62
- Vaudel M, Breiter D, Beck F, et al. D-score: a search engine independent MD-score. Proteomics 2013;13(6):1036-41
- Fermin D, Walmsley SJ, Gingras AC, et al. LuciPHOr: algorithm for phosphorylation site localization with false localization rate estimation using modified target-decoy approach. Mol Cell Proteomics 2013;12(11):3409-19
- Savitski MM, Lemeer S, Boesche M, et al. Confident phosphorylation site localization using the Mascot Delta Score. Mol Cell Proteomics 2011;10(2):M110 003830
- Beausoleil SA, Villen J, Gerber SA, et al. A probability-based approach for high-throughput protein phosphorylation analysis and site localization. Nat Biotechnol 2006;24(10):1285-92
- Syka JE, Coon JJ, Schroeder MJ, et al. Peptide and protein sequence analysis by electron transfer dissociation mass spectrometry. Proc Natl Acad Sci USA 2004. 101(26):9528-33
- Frese CK, Altelaar AF, van den Toorn H, et al. Toward full peptide sequence coverage by dual fragmentation combining electron-transfer and higher-energy collision dissociation tandem mass spectrometry. Anal Chem 2012;84(22):9668-73
- Schroeder MJ, Shabanowitz J, Schwartz JC, et al. A neutral loss activation method for improved phosphopeptide sequence analysis by quadrupole ion trap mass spectrometry. Anal Chem 2004;76(13):3590-8
- Fleitz A, Nieves E, Madrid-Aliste C, et al. Enhanced detection of multiply phosphorylated peptides and identification of their sites of modification. Anal Chem 2013;85(18):8566-76
- Halim A, Brinkmalm G, Ruetschi U, et al. Site-specific characterization of threonine, serine, and tyrosine glycosylations of amyloid precursor protein/amyloid beta-peptides in human cerebrospinal fluid. Proc Natl Acad Sci USA 2011;108(29):11848-53
- Vakhrushev SY, Steentoft C, Vester-Christensen MB, et al. Enhanced mass spectrometric mapping of the human GalNAc-type O-glycoproteome with SimpleCells. Mol Cell Proteomics 2013;12(4):932-44
- Solis D, Bovin NV, Davis AP, et al. A guide into glycosciences: How chemistry, biochemistry and biology cooperate to crack the sugar code. Biochim Biophys Acta 2015;1850(1):186-235
- Mitra N, Sinha S, Ramya TN, Surolia A. N-linked oligosaccharides as outfitters for glycoprotein folding, form and function. Trends Biochem Sci 2006;31(3):156-63
- Shental-Bechor D, Levy Y. Effect of glycosylation on protein folding: a close look at thermodynamic stabilization. Proc Natl Acad Sci USA 2008;105(24):8256-61
- Parodi AJ. Reglucosylation of glycoproteins and quality control of glycoprotein folding in the endoplasmic reticulum of yeast cells. Biochim Biophys Acta 1999;1426(2):287-95
- Yoshida Y, Adachi E, Fukiya K, et al. Glycoprotein-specific ubiquitin ligases recognize N-glycans in unfolded substrates. EMBO Rep 2005;6(3):239-44
- Helenius A, Aebi M. Intracellular functions of N-linked glycans. Science 2001;291(5512):2364-9
- Tate MD, Job ER, Deng YM, et al. Playing hide and seek: how glycosylation of the influenza virus hemagglutinin can modulate the immune response to infection. Viruses 2014;6(3):1294-316
- Christiansen MN, Chik J, Lee L, et al. Cell surface protein glycosylation in cancer. Proteomics 2014;14(4-5):525-46
- Stuchlova Horynova M, Raska M, Clausen H, Novak J. Aberrant O-glycosylation and anti-glycan antibodies in an autoimmune disease IgA nephropathy and breast adenocarcinoma. Cell Mol Life Sci 2013;70(5):829-39
- Schedin-Weiss S, Winblad B, Tjernberg LO. The role of protein glycosylation in Alzheimer disease. FEBS J 2014;281(1):46-62
- Zhu Y, Shan X, Yuzwa SA, Vocadlo DJ. The Emerging Link between O-GlcNAc and Alzheimer Disease. J Biol Chem 2014;289(50):34472-81
- Grigorian A, Mkhikian H, Li CF, et al. Pathogenesis of multiple sclerosis via environmental and genetic dysregulation of N-glycosylation. Semin Immunopathol 2012;34(3):415-24
- Xu YX, Ashline D, Liu L, et al. The glycosylation-dependent interaction of perlecan core protein with LDL: implications for atherosclerosis. J Lipid Res 2015;56(2):266-76
- Willig TB, Breton-Gorius J, Elbim C, et al. Macrothrombocytopenia with abnormal demarcation membranes in megakaryocytes and neutropenia with a complete lack of sialyl-Lewis-X antigen in leukocytes–a new syndrome? Blood 2001;97(3):826-8
- Brooks AR, Sim D, Gritzan U, et al. Glycoengineered factor IX variants with improved pharmacokinetics and subcutaneous efficacy. J Thromb Haemost 2013;11(9):1699-706
- Ma J, Hart GW. Protein O-GlcNAcylation in diabetes and diabetic complications. Expert Rev Proteomics 2013;10(4):365-80
- Scott DW, Patel RP. Endothelial heterogeneity and adhesion molecules N-glycosylation: implications in leukocyte trafficking in inflammation. Glycobiology 2013;23(6):622-33
- Zhang Y, Jiao J, Yang P, Lu H. Mass spectrometry-based N-glycoproteomics for cancer biomarker discovery. Clin Proteomics 2014;11(1):18
- Song E, Mayampurath A, Yu CY, et al. Glycoproteomics: Identifying the Glycosylation of Prostate Specific Antigen at Normal and High Isoelectric Points by LC-MS/MS. J Proteome Res 2014;13(12):5570-80
- Yen TY, Macher BA, McDonald CA, et al. Glycoprotein profiles of human breast cells demonstrate a clear clustering of normal/benign versus malignant cell lines and basal versus luminal cell lines. J Proteome Res 2012;11(2):656-67
- Malaguarnera G, Giordano M, Paladina I, et al. Serum markers of hepatocellular carcinoma. Dig Dis Sci 2010;55(10):2744-55
- Cho HJ, Kim SS, Ahn SJ, et al. Serum transferrin as a liver fibrosis biomarker in patients with chronic hepatitis B. Clin Mol Hepatol 2014;20(4):347-54
- Bertino G, Ardiri A, Malaguarnera M, et al. Hepatocellualar carcinoma serum markers. Semin Oncol 2012;39(4):410-33
- Lee JH, Cho CH, Kim SH, et al. Semi-quantitative Measurement of a Specific Glycoform Using a DNA-tagged Antibody and Lectin Affinity Chromatography for Glyco-biomarker Development. Mol Cell Proteomics 2015;14(3):782-95
- Palmisano G, Parker BL, Engholm-Keller K, et al. A novel method for the simultaneous enrichment, identification, and quantification of phosphopeptides and sialylated glycopeptides applied to a temporal profile of mouse brain development. Mol Cell Proteomics 2012;11(11):1191-202
- Lewandrowski U, Zahedi RP, Moebius J, et al. Enhanced N-glycosylation site analysis of sialoglycopeptides by strong cation exchange prefractionation applied to platelet plasma membranes. Mol Cell Proteomics 2007;6(11):1933-41
- Zhu J, Sun Z, Cheng K, et al. Comprehensive mapping of protein N-glycosylation in human liver by combining hydrophilic interaction chromatography and hydrazide chemistry. J Proteome Res 2014;13(3):1713-21
- Ma C, Zhao X, Han H, et al. N-linked glycoproteome profiling of human serum using tandem enrichment and multiple fraction concatenation. Electrophoresis 2013;34(16):2440-50
- Yin X, Bern M, Xing Q, et al. Glycoproteomic analysis of the secretome of human endothelial cells. Mol Cell Proteomics 2013;12(4):956-78
- Palmisano G, Lendal SE, Engholm-Keller K, et al. Selective enrichment of sialic acid-containing glycopeptides using titanium dioxide chromatography with analysis by HILIC and mass spectrometry. Nat Protoc 2010;5(12):1974-82
- Beck F, Lewandrowski U, Wiltfang M, et al. The good, the bad, the ugly: Validating the mass spectrometric analysis of modified peptides. Proteomics 2011;11(6):1099-109
- Levery SB, Steentoft C, Halim A, et al. Advances in mass spectrometry driven O-glycoproteomics. Biochim Biophys Acta 2015;1850(1):33-42
- Froehlich JW, Dodds ED, Wilhelm M, et al. A classifier based on accurate mass measurements to aid large scale, unbiased glycoproteomics. Mol Cell Proteomics 2013;12(4):1017-25
- Lewandrowski U, Lohrig K, Zahedi R, et al. Glycosylation Site Analysis of Human Platelets by Electrostatic Repulsion Hydrophilic Interaction Chromatography. Clin Proteom 2008;4(1-2):25-36
- Zhang H, Guo T, Li X, et al. Simultaneous characterization of glyco- and phosphoproteomes of mouse brain membrane proteome with electrostatic repulsion hydrophilic interaction chromatography. Mol Cell Proteomics 2010;9(4):635-47
- Cao L, Yu L, Guo Z, et al. Application of a strong anion exchange material in electrostatic repulsion-hydrophilic interaction chromatography for selective enrichment of glycopeptides. J Chromatogr A 2013;1299:18-24
- Hao P, Guo T, Sze SK. Simultaneous analysis of proteome, phospho- and glycoproteome of rat kidney tissue with electrostatic repulsion hydrophilic interaction chromatography. PLoS One 2011;6(2):e16884
- Blobel G, Dobberstein B. Transfer of proteins across membranes. I. Presence of proteolytically processed and unprocessed nascent immunoglobulin light chains on membrane-bound ribosomes of murine myeloma. J Cell Biol 1975;67(3):835-51
- Silver P, Goodson H. Nuclear protein transport. Crit Rev Biochem Mol Biol 1989;24(4):419-35
- Pfanner N, Hartl FU, Neupert W. Import of proteins into mitochondria: a multi-step process. Eur J Biochem 1988;175(2):205-12
- Chung JJ, Shikano S, Hanyu Y, Li M. Functional diversity of protein C-termini: more than zipcoding? Trends Cell Biol 2002;12(3):146-50
- Lopez-Otin C, Bond JS. Proteases: multifunctional enzymes in life and disease. J Biol Chem 2008;283(45):30433-7
- Nerelius C, Alvelius G, Jornvall H. N-terminal segment of proinsulin C-peptide active in insulin interaction/desaggregation. Biochem Biophys Res Commun 2010;403(3-4):462-7
- Hildebrand D, Merkel P, Eggers LF, Schluter H. Proteolytic processing of angiotensin-I in human blood plasma. PLoS One 2013;8(5):e64027
- Kurokawa M, Kornbluth S. Caspases and Kinases in a Death Grip. Cell 2009;138(5):838-54
- Gervais FG, Thornberry NA, Ruffolo SC, et al. Caspases cleave focal adhesion kinase during apoptosis to generate a FRNK-like polypeptide. J Biol Chem 1998;273(27):17102-8
- Petrera A, Lai ZW, Schilling O. Carboxyterminal protein processing in health and disease: key actors and emerging technologies. J Proteome Res 2014;13(11):4497-504
- Mossmann D, Vogtle FN, Taskin AA, et al. Amyloid-beta peptide induces mitochondrial dysfunction by inhibition of preprotein maturation. Cell Metab 2014;20(4):662-9
- McCarty SM, Percival SL. Proteases and Delayed Wound Healing. Adv Wound Care 2013;2(8):438-47
- Csiszar A, Kutay B, Wirth S, et al. Interleukin-like epithelial-to-mesenchymal transition inducer activity is controlled by proteolytic processing and plasminogen-urokinase plasminogen activator receptor system-regulated secretion during breast cancer progression. Breast Cancer Res 2014;16(5):433
- Smith H, Edman P, Owen JA. N-Terminal amino-acids of human haptoglobins. Nature 1962;193:286-7
- Edman P. A method for the determination of amino acid sequence in peptides. Arch Biochem 1949;22(3):475
- Agard NJ, Wells JA. Methods for the proteomic identification of protease substrates. Curr Opin Chem Biol 2009;13(5-6):503-9
- Tanco S, Gevaert K, Van Damme P. C-terminomics: Targeted analysis of natural and post-translationally modified protein and peptide C-termini. Proteomics 2015;15(5-6):903-14
- Gevaert K, Goethals M, Martens L, et al. Exploring proteomes and analyzing protein processing by mass spectrometric identification of sorted N-terminal peptides. Nat Biotechnol 2003;21(5):566-9
- Vogtle FN, Wortelkamp S, Zahedi RP, et al. Global analysis of the mitochondrial N-proteome identifies a processing peptidase critical for protein stability. Cell 2009;139(2):428-39
- Holmberg C, Ghesquiere B, Impens F, et al. Mapping proteolytic processing in the secretome of gastric cancer-associated myofibroblasts reveals activation of MMP-1, MMP-2, and MMP-3. J Proteome Res 2013;12(7):3413-22
- Staes A, Van Damme P, Helsens K, et al. Improved recovery of proteome-informative, protein N-terminal peptides by combined fractional diagonal chromatography (COFRADIC). Proteomics 2008;8(7):1362-70
- Kleifeld O, Doucet A, auf dem Keller U, et al. Isotopic labeling of terminal amines in complex samples identifies protein N-termini and protease cleavage products. Nat Biotechnol 2010;28(3):281-8
- auf dem Keller U, Prudova A, Eckhard U, et al. Systems-level analysis of proteolytic events in increased vascular permeability and complement activation in skin inflammation. Sci Signal 2013;6(258):rs2
- Wilson CH, Indarto D, Doucet A, et al. Identifying natural substrates for dipeptidyl peptidases 8 and 9 using terminal amine isotopic labeling of substrates (TAILS) reveals in vivo roles in cellular homeostasis and energy metabolism. J Biol Chem 2013;288(20):13936-49
- Sabino F, Hermes O, Egli FE, et al. In Vivo Assessment of Protease Dynamics in Cutaneous Wound Healing by Degradomics Analysis of Porcine Wound Exudates. Mol Cell Proteomics 2015;14(2):354-70
- Prudova A, Serrano K, Eckhard U, et al. TAILS N-terminomics of human platelets reveals pervasive metalloproteinase-dependent proteolytic processing in storage. Blood 2014;124(26):e49-60
- Venne AS, Zahedi RP. The potential of fractional diagonal chromatography strategies for the enrichment of post-translational modifications. EuPA Open Proteomics 2014;4(0):165-70
- Breuker K, Jin M, Han X, et al. Top-Down Identification and Characterization of Biomolecules by Mass Spectrometry. J Am Soc Mass Spectrom 2008;19(8):1045-53
- Catherman AD, Skinner OS, Kelleher NL. Top Down proteomics: facts and perspectives. Biochem Biophys Res Commun 2014;445(4):683-93
- Barnidge DR, Dasari S, Botz CM, et al. Using mass spectrometry to monitor monoclonal immunoglobulins in patients with a monoclonal gammopathy. J Proteome Res 2014;13(3):1419-27
- Mao P, Wang D. Top-down proteomics of a drop of blood for diabetes monitoring. J Proteome Res 2014;13(3):1560-9
- Seeley EH, Caprioli RM. MALDI imaging mass spectrometry of human tissue: method challenges and clinical perspectives. Trends Biotechnol 2011;29(3):136-43
- Rauser S, Marquardt C, Balluff B, et al. Classification of HER2 receptor status in breast cancer tissues by MALDI imaging mass spectrometry. J Proteome Res 2010;9(4):1854-63
- Smith LM, Kelleher NL. Proteoform: a single term describing protein complexity. Nat Methods 2013;10(3):186-7
- Tran JC, Zamdborg L, Ahlf DR, et al. Mapping intact protein isoforms in discovery mode using top-down proteomics. Nature 2011;480(7376):254-8
- Kellie JF, Catherman AD, Durbin KR, et al. Robust analysis of the yeast proteome under 50 kDa by molecular-mass-based fractionation and top-down mass spectrometry. Anal Chem 2012;84(1):209-15
- Catherman AD, Durbin KR, Ahlf DR, et al. Large-scale top-down proteomics of the human proteome: membrane proteins, mitochondria, and senescence. Mol Cell Proteomics 2013;12(12):3465-73
- Ntai I, Kim K, Fellers RT, et al. Applying label-free quantitation to top down proteomics. Anal Chem 2014;86(10):4961-8
- Rhoads TW, Rose CM, Bailey DJ, et al. Neutron-encoded mass signatures for quantitative top-down proteomics. Anal Chem 2014;86(5):2314-19
- Nagaraj N, Wisniewski JR, Geiger T, et al. Deep proteome and transcriptome mapping of a human cancer cell line. Mol Syst Biol 2011;7:548
- Hebert AS, Richards AL, Bailey DJ, et al. The one hour yeast proteome. Mol Cell Proteomics 2014;13(1):339-47
- Nguyen LK, Kolch W, Kholodenko BN. When ubiquitination meets phosphorylation: a systems biology perspective of EGFR/MAPK signalling. Cell Commun Signal 2013;11:52
- Hietakangas V, Anckar J, Blomster HA, et al. PDSM, a motif for phosphorylation-dependent SUMO modification. Proc Natl Acad Sci USA 2006;103(1):45-50
- Yang WH, Kim JE, Nam HW, et al. Modification of p53 with O-linked N-acetylglucosamine regulates p53 activity and stability. Nat Cell Biol 2006;8(10):1074-83
- Cheung P, Tanner KG, Cheung WL, et al. Synergistic coupling of histone H3 phosphorylation and acetylation in response to epidermal growth factor stimulation. Mol Cell 2000;5(6):905-15
- Kowenz-Leutz E, Pless O, Dittmar G, et al. Crosstalk between C/EBPβ phosphorylation, arginine methylation, and SWI/SNF/Mediator implies an indexing transcription factor code. EMBO J 2010;29(6):1105-15
- Smith LE, White MY. The role of post-translational modifications in acute and chronic cardiovascular disease. Proteomics Clin Appl 2014;8(7-8):506-21
- Sajic T, Liu Y, Aebersold R. Using data-independent, high resolution mass spectrometry in protein biomarker research: Perspectives and clinical applications. Proteomics. Clin Appl 2014. [Epub ahead of print]
- Liu Y, Chen J, Sethi A, et al. Glycoproteomic analysis of prostate cancer tissues by SWATH mass spectrometry discovers N-acylethanolamine acid amidase and protein tyrosine kinase 7 as signatures for tumor aggressiveness. Mol Cell Proteomics 2014;13(7):1753-68
- Guo T, Kouvonen P, Koh CC, et al. Rapid mass spectrometric conversion of tissue biopsy samples into permanent quantitative digital proteome maps. Nat Med 2015;21(4):407-13
- Nagel T, Meyer B. Simultaneous characterization of sequence polymorphisms, glycosylation and phosphorylation of fibrinogen in a direct analysis by LC-MS. Biochim Biophys Acta 2014;1844(12):2284-9
- Sidoli S, Schwammle V, Ruminowicz C, et al. Middle-down hybrid chromatography/tandem mass spectrometry workflow for characterization of combinatorial post-translational modifications in histones. Proteomics 2014;14(19):2200-11
- Diehl HC, Beine B, Elm J, et al. The challenge of on-tissue digestion for MALDI MSI- a comparison of different protocols to improve imaging experiments. Anal Bioanal Chem 2015;407(8):2223-43