Abstract
Protein phosphorylation is a central regulatory mechanism of cell signaling pathways. This highly controlled biochemical process is involved in most cellular functions, and defects in protein kinases and phosphatases have been implicated in many diseases, highlighting the importance of understanding phosphorylation-mediated signaling networks. However, phosphorylation is a transient modification, and phosphorylated proteins are often less abundant. Therefore, the large-scale identification and quantification of phosphoproteins and their phosphorylation sites under different conditions are one of the most interesting and challenging tasks in the field of proteomics. Both 2D gel electrophoresis and liquid chromatography-tandem mass spectrometry serve as key phosphoproteomic technologies in combination with prefractionation, such as enrichment of phosphorylated proteins/peptides. Recently, new possibilities for quantitative phosphoproteomic analysis have been offered by technical advances in sample preparation, enrichment, separation, instrumentation, quantification and informatics. In this article, we present an overview of several strategies for quantitative phosphoproteomics and discuss how phosphoproteomic analysis can help to elucidate signaling pathways that regulate various cellular processes.
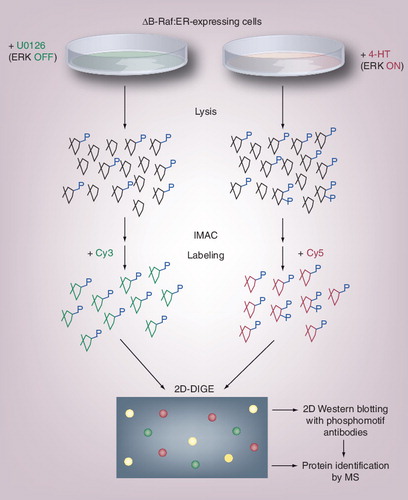
Phosphoprotein fraction from kinase-activated or -inhibited cells was labeled with Cy5 (shown in red) or Cy3 (shown in green), respectively. The paired samples were combined and separated on the same 2D gel, which was scanned at different wavelengths to visualize spot patterns. The overlaid image clearly shows spots of kinase targets with phosphorylation-dependent acidic shifts. Various stoichiometries of phosphorylation give multiple spots in a row with short intervals (circles).
MW: Molecular weight.
Data from [Kosako H, Unpublished Data].
![Figure 1. Detection of changes in phosphorylation by 2D difference gel electrophoresis.Phosphoprotein fraction from kinase-activated or -inhibited cells was labeled with Cy5 (shown in red) or Cy3 (shown in green), respectively. The paired samples were combined and separated on the same 2D gel, which was scanned at different wavelengths to visualize spot patterns. The overlaid image clearly shows spots of kinase targets with phosphorylation-dependent acidic shifts. Various stoichiometries of phosphorylation give multiple spots in a row with short intervals (circles).MW: Molecular weight.Data from [Kosako H, Unpublished Data].](/cms/asset/6a898807-c40c-457c-935d-38bd4dafa1cb/ieru_a_11217269_f0001_b.jpg)
Fibroblastic cell lines expressing ΔB-Raf:ER were treated with 4-hydroxy-tamoxifen to activate the Raf–MEK–ERK pathway or with the MEK inhibitor U0126 to inhibit the pathway. Cell lysates were subjected to IMAC to enrich phosphoproteins, followed by labeling with different fluorophores. After 2D-DIGE analysis, changed protein spots were characterized for reactivity to ERK phosphomotif antibodies and identified by MS. Various types of phosphomotif-specific antibodies are available from Cell Signaling Technology, and this strategy may be applicable to other protein kinases.
IMAC: Immobilized metal ion-affinity chromatography; MS: Mass spectrometry.
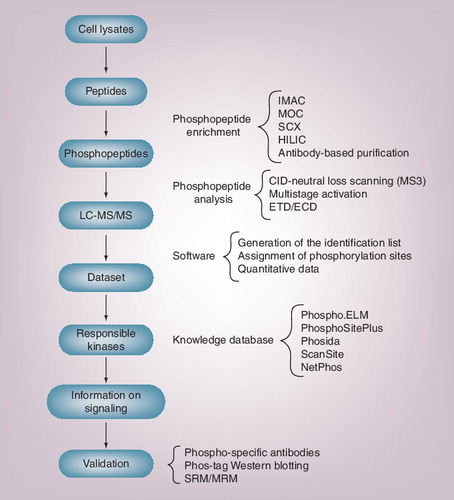
In shotgun proteomics, peptide mixtures are first prepared from cell/tissue lysates. Phosphopeptides are then enriched using various technologies and analyzed by LC-MS/MS. Large mass spectrometry datasets are then processed with software to generate the identification list with quantitative information. Because phosphoproteomics identifies the in vivo phosphorylation status of the substrates, knowledge databases for kinase–substrate relationships are used to predict the activation status of the corresponding kinases. To confirm the findings from quantitative phosphoproteomics, validation studies must be performed by other methods, such as phospho-specific antibodies, Phos-tag Western blotting or recently established mass spectrometry measurement, multiple reaction monitoring (also called SRM).
CID: Collision-induced dissociation; ECD: Electron capture dissociation; ELM: Eukaryotic linear motif; ETD: Electron transfer dissociation; HILIC: Hydrophilic interaction chromatography; IMAC: Immobilized metal ion-affinity chromatography; LC-MS/MS: Liquid chromatography-tandem mass spectrometry; MOC: Metal oxide chromatography; MRM: Multiple reaction monitoring; MS3: Mass spectrometry/tandem mass spectrometry; SCX: Strong cation exchange; SRM: Selected reaction monitoring.
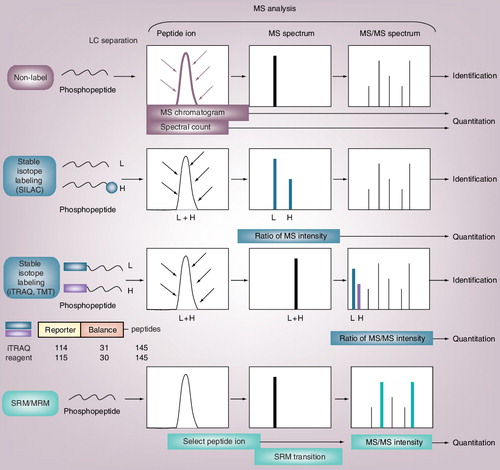
There are three major methods for quantification: non-labeling (maroon), labeling with stable isotopes (teal) and SRM/MRM (turquoise). The two main non-labeling methods are based on the intensity of MS chromatograms and the spectral counts of identified peptides. Labeling methods are classified into two major groups: metabolic labeling and in vitro labeling. The representative of the metabolic labeling is SILAC. In SILAC, two cell cultures to be compared are differentially labeled with heavy amino acids containing stable isotopes (heavy) and normal amino acids (light). Lysates from differentially labeled cells are mixed, digested with protease and analyzed by LC-MS/MS. Differentially labeled peptides having the same amino acid sequence are detected in MS spectrum, and the relative abundance of the peptides can be compared by calculating their ratio. The representative of the in vitro labeling is performed using isobaric amine-specific tandem mass tags, such as iTRAQ and TMT. The iTRAQ reagent consists of reporter regions with 1 Da difference (molecular weight: 114, 115, 116…) and balance regions that adjust the molecular weight of the labeled parent ions (molecular weight: 31, 30, 29…). Each tag generates a unique reporter ion in the MS/MS spectra, and the relative abundance of the peptides can be compared by calculating their ratio. In SRM/MRM, the selected precursor to fragment ion transition is continuously monitored to diagnose for the presence of the desired ion in the sample. The abundance of the peptides is quantified by the intensity of the selected product ions in the MS/MS spectra.
H: Heavy; iTRAQ: Isobaric tag for relative and absolute quantitation; L: Light; LC: Liquid chromatography; MRM: Multiple reaction monitoring; MS: Mass spectrometry; MS/MS: Tandem mass spectrometry; SILAC: Stable isotope labeling by amino acids in cell culture; SRM: Selected reaction monitoring; TMT: Tandem mass tag.
Protein phosphorylation on serine, threonine and tyrosine residues is one of the most widespread types of post-translational modifications used in cell signaling and can regulate diverse properties of proteins Citation[1]. In cells, numerous proteins are continuously and dynamically phosphorylated and dephosphorylated at specific sites under the control of complex signaling networks Citation[2]. This reversible phosphorylation is mediated by the opposite action of large families of protein kinases and phosphatases. Protein kinases are major components of signal transduction pathways and are encoded by over 500 genes in the human genome Citation[3], emphasizing the important and complicated roles of phosphorylation. In fact, many pathologies such as cancer Citation[4], autoimmune diseases Citation[5], metabolic disorders Citation[6] and pathogenic infections Citation[7] are associated with protein kinase-mediated signaling pathways.
To fully understand the complex signaling networks, it is essential to develop analytical strategies for the global identification of phosphorylated proteins and the characterization of phosphorylation sites under different biological conditions. Furthermore, the global identification and characterization of in vivo substrates of an individual protein kinase would be useful for a thorough and therapeutically applicable understanding of its cellular functions. However, the low abundance of most signaling proteins, thelow stoichiometry of phosphorylation and the highly dynamic regulation of phosphoproteins put great demands on these analytical strategies. Recent advances in various proteomic technologies have enabled more sensitive, comprehensive and quantitative analysis of protein phosphorylation in cells and tissues, as reviewed previously Citation[8–13].
Two-dimensional gel electrophoresis (2DE) and gel-free, liquid chromatography-tandem mass spectrometry (LC-MS/MS) are two major proteomic technologies. Both methods require prefractionation of proteins or peptides to reduce sample complexity and detect low-abundance phosphorylation events. In this article, we will first focus on these two proteomic methods coupled with various prefractionation procedures for the quantitative characterization of in vivo phosphorylation. Quantitative proteomic methods that are based on the analysis of in vitro phosphorylation, such as the kinase substrate tracking and elucidation (KESTREL) Citation[14], analog-sensitive kinase alleles Citation[15], expression library screening Citation[16] and protein chips Citation[17] are excluded. In addition, prediction of the responsible kinases, validation of the obtained proteomic data and functional analysis of the kinase-mediated cell signaling pathways will be discussed.
Strategies for quantitative phosphoproteomics using 2DE
Two-dimensional gel electrophoresis is a classical and powerful analytical method in proteomics that can separate complex mixtures of proteins based on charge (by isoelectric focusing) and apparent molecular mass (by sodium dodecyl sulfate polyacrylamide gel electrophoresis) Citation[18]. In contrast to LC-MS/MS that analyzes digested peptides, 2DE delivers a map of intact proteins, which reflects changes in protein expression, isoforms or post-translational modifications Citation[19]. These changes can be confirmed by 1D or 2D Western blot analysis. Some forms of post-translational modification such as phosphorylation, glycosylation or limited proteolysis are easily located in 2DE gels as they appear as distinct spot trains along the horizontal and/or vertical axis. In 2DE, stoichiometry of phosphorylation can be readily determined by quantifying the spot intensity of each phosphorylated form. Furthermore, the combination of 2DE with 32P labeling, staining of phosphoproteins on gels or immunoblotting with phospho-specific antibodies makes it suitable for proteomics analysis of phosphorylation-mediated signaling pathways Citation[20,21].
For 2DE analysis of signaling pathways, the signal-dependent changes in the 2D separation patterns between samples must be compared. However, the major disadvantage of 2DE is the inherent lack of reproducibility between gels, and labor-intensive staining procedure and image analysis are usually required for gel matching and removal of artifacts. Fluorescent 2D-DIGE was developed to overcome this problem by labeling proteins from two to three samples with spectrally resolvable fluorescent dyes before running all the samples on the same gel Citation[22,23]. The fluorescent dyes used in 2D-DIGE are cyanine-based, size- and charge-matched, and reactive with lysine or cysteine residues in proteins. These characteristics reduce spot pattern variability and the number of gels in an experiment and thus allow simple and accurate spot matching Citation[24,25]. It should be noted that 2D-DIGE is well suited to detect quantitative changes in phosphorylation, which cause quantitative shifts of protein spots in the isoelectric point . The use of highly sensitive dyes and large-format gels increases the number of spots on the gel and detects low-abundance signaling proteins Citation[26]. Furthermore, 2D-DIGE can be followed by phosphoprotein staining or 2D-Western blotting with phospho-specific antibodies, both of which can be fluorescently detected and accurately compared with the fluorescent 2D-DIGE image Citation[27,28].
Prefractionation procedures have been shown to be effective for proteomic analysis of proteins of low abundance, such as signaling phosphoproteins. One of these methods, immobilized metal ion-affinity chromatography (IMAC), can enrich not only phosphopeptides (see later) but also phosphoproteins from lysates of cells and tissues Citation[29–31]. The authors previously developed a quantitative phosphoproteomics approach using phosphoprotein enrichment by IMAC followed by 2D-DIGE, which resulted in the detection of multiple protein spots involved in the p38 MAPK pathway Citation[32]. One of these spots was identified as the cochaperone BAG2, which was shown to be directly phosphorylated by MAPK-activated protein kinase 2 in vitro and in vivo. This approach has been successfully applied by different researchers to study other signaling systems Citation[33,34]. On the other hand, subcellular fractionation coupled with 2D-DIGE is particularly useful for the analysis of signaling events at specific intracellular locations. Huber et al. performed 2D-DIGE after purification of endosomes from EGF-treated mouse epithelial cells and identified 23 endosomal targets of EGF receptor signaling, such as R-Ras Citation[35]. Another group, led by Wang, performed 2D-DIGE analysis of phosphoprotein and plasma membrane fractions from brassinosteroid-treated ArabidopsisCitation[36] and identified homologous protein kinases as key transducers of this steroid hormone signaling in plants Citation[37]. Thus, the combination of prefractionation and 2D-DIGE is a powerful proteomics approach for unraveling protein kinase-mediated signaling networks.
Extracellular signal-regulated kinase (ERK)/MAPK is an evolutionally conserved and well-studied signaling kinase that regulates various cellular functions Citation[38,39]. Although many ERK substrates have been identified to date Citation[40], the diverse roles of the ERK pathway in cells suggest that more substrates remain to be identified. Therefore, the ERK signaling pathway has provided an excellent model system for phosphoproteomic identification of kinase targets by both in vitro and in vivo studies Citation[16,41–43]. Ahn et al. succeeded in identifying novel ERK targets by comparing 2DE gels where total proteins from ERK-activated or -inhibited cells were separately loaded and silver-stained Citation[44,45]. However, the core components of this kinase cascade, such as MAP kinase/ERK kinase 1, ERK1 and ERK2, could not be identified, and validation of direct substrates was not carried out. Recently, the authors have improved the previous phosphoproteomic approach Citation[32] by incorporating the estrogen receptor fusion system and phosphomotif-specific antibodies to globally identify ERK substrates in vivoCitation[28]. This approach used cultured cells expressing a kinase domain of B-Raf fused to the estrogen receptor, which was treated with tamoxifen to selectively activate the Raf–MEK–ERK pathway. To detect low-abundance ERK pathway components, lysates from ERK-activated or -inhibited cells were enriched for phosphoproteins by IMAC. Phosphoproteins obtained from these cells were subjected to 2D-DIGE, which allowed the detection of many protein spots with quantitatively different fluorescence intensities following ERK activation. 2D Western blotting and matching with the 2D-DIGE image showed that a number of these spots were reactive with ERK phosphomotif antibodies, indicating the possibility of direct ERK substrates. From this screen, 38 candidate targets were identified by mass spectrometry (MS), including 13 new substrates that were verified by in vitro ERK phosphorylation. Further studies of one of them, the nucleoporin Nup50, revealed an unexpected role of ERK signaling in the regulation of nucleocytoplasmic transport Citation[46]. Thus, quantitative phosphoproteomics strategies combining 2D-DIGE with various methods can provide new insights into certain cellular processes.
Strategies for quantitative phosphoproteomics using LC-MS/MS
Shotgun proteomics, where a peptide mixture from a sample is analyzed by LC-MS/MS without separating proteins on gels prior to the analysis, is a robust and high-throughput method and enables the identification of thousands of proteins in a single analysis. LC-MS/MS analysis can detect and characterize various post-translational modifications, including phosphorylation Citation[47]. Together with the improvement in phosphopeptide enrichment methods, LC-MS/MS analysis has been widely used for large-scale phosphoproteomic analysis. Furthermore, a variety of quantitative methods for LC-MS/MS analysis have been developed and successfully applied to quantify phosphopeptides from various cells and tissues. Thus, quantitative phosphoproteomics using LC-MS/MS has become the method of choice to analyze changes in phosphorylation at specific sites upon ligand stimulation and/or drug treatment instead of analyzing phosphoproteins, where the phosphorylation sites are undetermined. Strategies for quantitative phosphoproteomic analysis using LC-MS/MS are depicted in .
Phosphopeptide enrichment
Because of the small amounts of phosphopeptides in digested peptide mixtures from total cell/tissue lysates, they need to be enriched prior to LC-MS/MS analysis to make the identification more efficient. Although many different methods for phosphopeptide enrichment have been reported, IMAC and metal oxide chromatography (MOC) are now widely used. The IMAC method is based on the high affinity of phosphates to certain trivalent metal ions Citation[48] and has been further developed and improved by many others Citation[49–53]. Posewitz and Tempst compared the capacity and selectivity of trivalent ions, including Fe3+, Ga3+, Al3+ and Zr3+, for phosphopeptide binding and concluded that iminodiacetate columns coupled with Ga3+ resulted in the best selectivity Citation[52]. However, the main problem with IMAC is the nonspecific binding of acidic peptides. To prevent this, Ficarro et al. performed methylation of all acidic groups in peptides prior to IMAC enrichment Citation[53]. As a result, the selectivity of IMAC for phosphopeptides was increased and more than 216 phosphopeptides and 383 phosphorylation sites in a yeast lysate were successfully identified Citation[53]. Different phosphopeptide enrichment kits are now available from several companies, including Waters, Sigma, Perkin Elmer, BD Biosciences and Thermo Fisher Scientific, among others Citation[54–57]. The authors compared four commercially available kits and found that MassPREP™ from Waters was the most suitable for our purposes in terms of sensitivity, specificity and feasibility Citation[57]. This kit enabled the routine identification of 1000 phosphopeptides by LTQ-Orbitrap™ in a single analysis from 500 µg cell lysate.
The MOC using titanium dioxide (TiO2) or zirconium dioxide (ZrO2) has emerged as an alternative for phosphopeptide enrichment Citation[58–60]. Pinkse et al. developed a selective and robust technology for large-scale phosphoproteomics using TiO2Citation[58], although acidic peptides still caused contamination during enrichment. To prevent this, competitive binders such as aromatic modifiers (2,5-dihydroxybenzoic acid [DHB] and phthalic acid Citation[59]) or aliphatic hydroxy acids (lactic acid and 3-hydroxypropanoic acid Citation[61]) were used in the buffers during enrichment. These competitive binders significantly improved the selectivity of TiO2 for phosphopeptides.
Strong cation exchange (SCX) chromatography is another approach to enrich phosphopeptides. A typical tryptic peptide has a net charge of +2 at pH 2.7, because the N-terminal amino group and the C-terminal arginine or lysine side chain are protonated. When the peptide is phosphorylated, the negatively charged phosphate group reduces the charge state by one. Thus, phosphopeptides can be enriched using an ion-exchange column. Indeed, the +1 SCX fractions were highly enriched in phosphopeptides Citation[62], and the analysis of these fractions by LC-MS/MS on an ion trap led to the identification of more than 2000 phosphopeptides from a HeLa cell nuclear extract. Combination of SCX with IMAC and/or MOC was successfully applied to several large-scale phosphoproteomic analyses Citation[63–67].
Hydrophilic interaction chromatography (HILIC) is also used to separate phosphopeptides. In this method, peptides are loaded onto the HILIC column in an organic solvent and eluted with a gradient of aqueous solvent. Using this method, more than 1000 phosphorylation sites from 300 µg of HeLa cell lysate were identified Citation[68].
Anti-phosphotyrosine antibodies are well established and often used for enrichment of tyrosine-phosphorylated proteins. Immunoprecipitation with the anti-phosphotyrosine antibody followed by sodium dodecyl sulfate polyacrylamide gel electrophoresis or direct LC-MS/MS analysis has been performed in many studies Citation[69–71]. However, this analysis alone cannot determine the phosphorylation sites. Furthermore, many proteins are copurified by specific or nonspecific interaction, making it difficult to know whether the identified proteins are indeed tyrosine-phosphorylated or have been isolated by their interaction with phosphorylated proteins. Rush et al. and Rikova et al. performed immunoprecipitation of tyrosine-phosphorylated peptides instead of proteins, followed by LC-MS/MS Citation[72,73]. This method enabled the identification of over 100 tyrosine-phosphorylated sites in a single LC-MS/MS analysis. The peptides identified included many phosphorylation sites of which the responsible kinases are known, such as autophosphorylation sites of tyrosine kinases, which are usually difficult to identify using IMAC or MOC.
In contrast to anti-phosphotyrosine antibodies, antibodies for phosphoserine and phosphothreonine suffer from their specificity. However, some anti-phosphomotif antibodies have sufficient specificity to immunoprecipitate proteins that contain a phosphorylated residue in the context of a specific kinase substrate, binding motif or other phosphorylation motifs. Matsuoka et al. immunoprecipitated phosphopeptides from DNA-damaged cells with antibodies for phospho-SQ/TQ motif and identified more than 900 regulated phosphorylation sites containing the consensus ATM/ATR substrate motif Citation[74]. This approach is also considered to be useful to analyze other kinases-mediated signaling pathways when their phosphomotif antibodies are available.
Phosphopeptide analysis by MS
The major problem for phosphopeptide identification by MS/MS is that the O-phosphate bond in serine- and threonine-phosphorylated peptides is labile during collision-induced dissociation (CID), resulting in a neutral loss of phosphoric acid from the precursor ion. This problem has been solved by introducing sequential fragmentation. In ion traps, the neutral loss precursor ion can be further analyzed by MS/MS/MS (MS3) Citation[62,75]. In the neutral loss-dependent MS3 mode, when a neutral loss of phosphoric acid (-98 Da) is detected, MS3 fragmentation of the neutral loss precursor ion is triggered. This method has further evolved as multistage activation Citation[76]. In this mode, ion species resulting from neutral losses by CID are subjected to MS/MS analysis (pseudo-MS3) without detecting the neutral loss ions. Thus, multistage activation significantly reduces analysis time and enhances the efficiency of phosphopeptide identification. However, it has recently been reported that transfer of the phosphate residue occurs in the gas phase during CID-MS/MS using ion trap, suggesting that CID-MS3 of neutral loss ions may not be used for unambiguous phosphorylation site localization Citation[77]. More recent studies from two groups have compared the site assignments of phosphopeptides by CID spectra with those from electron transfer dissociation (ETD) Citation[78] spectra where the phosphate group retains during analysis, and both studies conclude that the gas-phase phosphate transfer does not affect the reliability of phosphoproteomic data Citation[79,80].
Alternative peptide-dissociation methods, termed ETD and electron-capture dissociation (ECD) Citation[81], cleave the backbone N-Cα bond, generating c- and z-ions and preserve post-translational modifications that are labile upon CID, such as phosphorylation and glycosylation Citation[78,81–86]. ECD has been equipped with Fourier transform ion cyclotron resonance, whereas more recently developed ETD comes equipped on LTQ-Orbitrap as well as other MS instruments, such as ion trap from Bruker Daltonics, Q-TOF (Waters) and FT-ICR. Although there are few studies demonstrating the impact of using ETD or ECD on phosphoproteomics, Sweet et al. demonstrated that the combination of ECD and CID allowed confident identification and localization of the phosphorylation sites in a large-scale phosphoproteomics experiment Citation[87]. An optimal strategy is to combine CID of doubly charged peptides with ETD for the more highly charged peptides Citation[88]. Swaney et al. performed a phosphoproteomics analysis of human embryonic stem cells using both CID and ETD with a data-dependent decision tree algorithm to select the fragmentation method based on the charge state and mass-to-charge ratio of the precursor ions, and determined 11,925 phosphopeptides in total Citation[89,90]. They argue that ETD can identify a larger number of unique phosphopeptides than CID. Thus, both ETD and ECD have a great potential in the global analysis of phosphorylation, especially for multiply charged and multiply phosphorylated peptides.
Assignment of phosphorylation sites
Although phosphopeptides can be identified by LC-MS/MS analysis, the identified phosphorylation site is sometimes ambiguous. When an identified phosphopeptide contains consecutive serine/threonine/tyrosine residues, the MS/MS fragments generated by the cleavage of both N- and C-terminals of the identified phosphorylation site must be assigned in the MS/MS spectrum to define the position of phosphorylation precisely. However, a standard database search assigns phosphorylation sites without inspecting the MS/MS assignations around their sites, and thus manual inspection of each spectrum is often required for unambiguous determination of the phosphorylation sites. In large-scale proteomics experiments involving hundreds or thousands of phosphorylation sites, this is an extremely tedious task. Thus, algorithms have been developed to provide probability scores for each of the potential phosphorylation sites, which help in the confident assignation of those sites Citation[75,91]. However, the use of these algorithms is limited to the peptides fragmented by CID. Although CID is the most efficient method for phosphopeptide identification, ECD or ETD is superior for localization of phosphorylation sites due to retention of phosphate groups from the peptides. Thus, the combination of ECD/ETD with CID enhanced the number of the identified phosphopeptides, as well as confidence of the site localization. Cooper et al. developed the algorithm termed Site Localization of Modification that allows analysis of data obtained from CID and ETD/ECD fragmentation methods Citation[92].
Quantification methods
There are many quantification methods in LC-MS/MS analysis, as summarized in . Which method should be selected depends on the accuracy required, the sample source (from cultured cells or tissues) and the number of samples to be compared. The easiest way is a label-free method based on the spectral counts of identified peptides. An abundant peptide is represented by a large LC peak eluted for a long time and has more chance of being analyzed by MS/MS. Thus, the number of observed spectra assigned to a particular peptide is a semiquantitative measure of the abundance of the peptide. Although the accuracy of quantification using spectral counts is not high, it is convenient for analyzing large quantitative differences between samples. Rikova et al. performed profiling of tyrosine phosphorylation in 41 cell lines and 150 clinical samples of non-small-cell lung carcinoma (NSCLC) Citation[73]. They compared the tyrosine phosphorylation status of cell lines and clinical samples using spectral counts of the identified phosphopeptides. Normalization was carried out by an internal control, a phosphopeptide containing GSK3β-pY279, which is ubiquitously identified in different cell lines or tissues. As a result, clinical samples of NSCLC were classified into five groups according to the activated tyrosine kinases. They also focused on the highly phosphorylated proteins in particular cell lines and identified known and novel tyrosine kinases not previously implicated as target molecules for NSCLC. Recently, the authors performed comparative phosphoproteomics among distinct tumor cell lines in the presence or absence of nocodazole, which blocks cells in mitosis Citation[57]. Changes of phosphorylation upon nocodazole treatment were investigated by spectral counts using a low-resolution MS instrument, LTQ, and this analysis revealed common features of phosphorylation by nocodazole in distinct cell lines. Quantification by spectral counts has been further developed to account for the different physicochemical properties of peptides, such as protein size, sequence properties and ionizability Citation[93,94], or to include normalization of run-to-run variations Citation[95].
Another label-free method measures the intensity of MS chromatograms. A number of methods have been developed to quantify peptides/proteins from peak heights in shotgun proteomics using an internal control Citation[96–98]. Using high-resolution MS instruments, a peptide ion can be analyzed accurately in the low parts per million mass unit range, and it facilitates the peptide signal mapping across a few or multiple LC-MS measurements, using their mass to charge and retention time dimension. Thus, this method depends on the mass resolution, the mass precision and the consistency of the retention time to match the same peptides among different LC-MS analyses. It is essential to use a high-resolution MS, as well as a sensitive and reproducible nano-LC where the retention time of a particular peptide in crude extract behaves exactly the same. To help this quantification method, there are various matching software products that are commercially and publicly available, such as SpecArray Citation[99], MsInspect Citation[100], MSight Citation[101], TOPP Citation[102], PEPPeR Citation[103], SuperHirn Citation[104], MaxQuant Citation[105], QuanLynx™ (Waters), SIEVE™ (Thermo Scientific), Elucidator® (Rosetta Biosoftware) and Expressionist® (Genedata) Citation[106]. Ahn et al. performed label-free profiling of B-Raf–MEK–ERK signaling in human melanoma cells Citation[107]. Without enrichment of phosphopeptides, their profiling was carried out in negative ionization mode using a triple quadrupole linear ion trap instrument. The -79 Da (PO3¯) precursor ion scanning enabled quantitative comparison between samples by measuring -79 Da signal intensity. Of 90 phosphorylation sites identified by sensitivity to the MEK inhibitor, multisite phosphorylation of a previously uncharacterized protein was further investigated, and its ERK-dependent phosphorylation was shown to be involved in melanoma cell invasion.
Relative quantification based on differential stable isotope labeling is frequently used for quantitative phosphoproteomic analyses by MS. Although many techniques have been developed, only a few methods have been used in multiple laboratories. These include isotope-coded affinity tags Citation[108], stable isotope labeling by amino acids in cell culture (SILAC) Citation[109] and the recently introduced chemical labeling by tandem mass tags, such as isobaric tag for relative and absolute quantitation (iTRAQ) Citation[110] and tandem mass tags (TMT) Citation[111]. SILAC and iTRAQ/TMT are currently the most frequently used techniques in quantitative MS-based phosphoproteomics. In SILAC, cell cultures to be compared are differentially labeled with amino acids containing stable isotopes, usually 13C6-Lys and/or 13C6-Arg, and normal amino acids. Lysates from differentially labeled cells are then mixed, digested with protease and analyzed by LC-MS/MS. As a result, differentially labeled peptides (light and heavy) with the same amino acid sequence are detected in the MS spectrum, and the relative abundance of the peptides derived from different samples can be compared by calculating their ratio. Mann intensively analyzed phosphorylation changes caused by stimulation and cell cycle progression using SILAC Citation[112].
For example, the yeast α-factor pheromone response pathway was analyzed. Phosphopeptides were enriched by a combination of SCX chromatography and IMAC, and more than 700 unique phosphorylation sites were identified Citation[63]. This unbiased phosphoproteomic approach identified many pheromone-regulated phosphorylation sites on RNA-processing and RNA transport proteins, suggesting that the pheromone pathway has a previously unappreciated role in regulating RNA metabolism. They also applied the SILAC-based method to study phosphorylation changes in EGF-stimulated HeLa cells. After enrichment of phosphopeptides with SCX and TiO2, temporal profiles of 6600 unique phosphorylation sites on 2244 proteins were determined, including many known members of the EGF receptor signaling pathway Citation[64]. More recently, the cell cycle profiles of 20,443 phosphorylation sites in 6027 proteins have been determined and the site-specific stoichiometry of more than 5000 sites has been achieved by combining the results from corresponding non-phosphorylated peptides Citation[67]. Although SILAC has mostly been limited to analyzing samples from cell culture, it has recently been extended to in vivo experiments by comparing tissue samples with cell lines and calculating the ratio of ratios between tissue samples Citation[113]. Furthermore, mice were completely labeled with a diet containing stable isotope-labeled amino acid (SILAC mice), and differentially regulated proteins in knockout mice were successfully identified Citation[114].
Isobaric tagging for relative and absolute quantitation/tandem mass tags is a recently developed protein quantification method that uses isobaric amine-specific tandem mass tags and quantification in MS/MS instead of MS spectra Citation[110,111]. In MS spectra, the differentially labeled peptides possess the same mass by using the balance region in the tag and are represented in a combined single peak . However, each tag generates a unique reporter ion, and the intensities of the reporter ions in the MS/MS spectra are compared for protein quantification. iTRAQ can comparatively analyze four or eight different conditions in one experiment, whereas TMT can compare six conditions. These chemical labeling methods are suitable for the phosphoproteomic analysis of tissue and clinical samples Citation[115]. White et al. performed phosphoproteomics using iTRAQ and obtained temporal changes of hundreds of tyrosine phosphorylation sites after EGF and insulin treatment Citation[116]. Other groups also reported the identification and quantification of 700–1600 phosphopeptides using iTRAQ Citation[117,118]. However, there are still limited reports of quantitative phosphoproteomics using iTRAQ. The main reason for this is that MS using ion traps, including LTQ-Orbitrap, which is widely used in large-scale proteomics studies, cannot detect the reporter ions of iTRAQ or TMT by conventional CID fragmentation in the MS/MS spectra. The studies successfully identifying and quantifying peptides were mainly performed by using MS instruments such as ESI-Q-TOF and MALDI-TOF/TOF. For quantification by iTRAQ/TMT using LTQ-Orbitrap, other fragmentation methods, such as higher-energy C-trap dissociation (HCD) or pulsed q-dissociation, must be used. In fact, Nilsson et al. succeeded in detecting quantitative changes in the IL-6 signaling pathway in glioblastoma stem cells by using TMT and HCD Citation[119]. Although HCD provides good fragmentation of the reporter ions, the efficiency of protein identification is generally poor compared with CID. Dayon et al. have developed a method for detecting reporter ions of iTRAQ by HCD and identifying proteins by CID Citation[120]. The efficiency of protein identification was significantly enhanced by this method compared with HCD alone.
Prediction of the responsible kinases
Although the current LC-MS/MS-based phosphoproteomics has enabled the identification and quantification of thousands of phosphopeptides, the kinases responsible for the majority of the identified phosphorylation sites have been uncharacterized, and thus it is difficult to obtain information on the activation status of the kinases and signaling pathways from the dataset. Therefore, it is particularly important to map kinase–substrate relationships in the phosphoproteomics dataset. In recent years, several databases that collate proteomically identified and/or biochemically verified phosphorylation sites have been generated, such as Phospho.ELM Citation[201], PhosphoSitePlus®Citation[202] and Phosida Citation[121,203]. Thus, the responsible kinases may be predicted using these databases. On the other hand, consensus amino acid sequences for phosphorylation by various kinases have been intensively analyzed by in vitro phosphorylation assays using a combinatorial peptide library. Based on this information, several kinase prediction tools for a given substrate have been developed, which include ScanSite Citation[204] and NetPhos Citation[205], based on matrix motifs and neural networks, respectively. Using these databases, the large amount of phosphoproteomic data can be applied to in silico predictions of phosphorylation sites and their corresponding kinases Citation[13]. Pawson et al. have also shown that the kinase–substrate relationship can be inferred by bioinformatic mining of linear sequence motifs in combination with other large-scale datasets Citation[122].
Validation of findings from quantitative phosphoproteomics analysis
The proteomically identified phosphorylation changes have to be validated by other methods. Phospho-specific antibodies are useful to detect targeted phosphorylation sites and visualize their intracellular distribution Citation[28,123]. So far, commercially available phosphospecific antibodies have been limited, and generation of these antibodies is costly and time-consuming, and sometimes results in failure. However, the number of phosphorylation sites to be verified are often in the hundreds. Therefore, the majority of phosphoproteomic data have not been validated or utilized effectively for functional analysis of phosphorylation-mediated cell signaling.
Recently, phosphate-affinity polyacrylamide gel electrophoresis has been developed to detect stoichiometric protein phosphorylation Citation[124]. The phosphate-affinity site is a polyacrylamide-bound dinuclear Mn2+ complex (Mn2+-Phos-tag) that can enhance mobility shifts of phosphorylated forms of many proteins. Phosphorylation levels of cellular proteins of interest can be assessed by subsequent Western blotting Citation[125]. This Phos-tag Western blotting would be useful to evaluate the obtained phosphoproteomic data when antibodies are available.
As an alternative to the data-dependent operation of MS, an operation mode termed selected reaction monitoring or multiple reaction monitoring, which continuously monitors a selected precursor to fragment ion transitions, has emerged as a highly reproducible and sensitive method for quantifying targeted peptides Citation[126–128]. Although full-scan MS/MS spectra are not acquired in this mode, which is often operated on a hybrid triple quadruple/linear ion trap instrument, the method enables the quantification of hundreds or thousands of targeted peptides with an approximately tenfold increase in sensitivity over pre-existing methods, such as neutral loss scanning or precursor ion scanning. White et al. applied this to quantify temporal profiles of 222 tyrosine-phosphorylated peptides across seven time points following EGF treatment Citation[127]. With this approach, 88% of the targeted signaling molecules were reproducibly quantified; a greatly improved reproducibility compared with conventional data-dependent analysis of 34%. Other studies also used selected reaction monitoring/multiple reaction monitoring for validation of the quantitative changes of a specific phosphorylation Citation[129–132].
Expert commentary
Comparative studies have revealed that different proteomic strategies are complementary to each other. For example, different phosphopeptide enrichment methods show distinct and partially overlapping preferences in phosphopeptide recovery Citation[133]. Furthermore, phosphoproteomic profiling of the ERK pathway using 2D-DIGE Citation[28], label-free precursor ion scanning Citation[107] and SILAC Citation[134] identified surprisingly different subsets of ERK targets. Thus, a combination of various phosphoproteomic strategies, such as LC-MS/MS, 2DE and protein chips, can increase the reliability and comprehensiveness of the data obtained. The unique advantages and drawbacks of different strategies are summarized in Box 1.
Despite the vast amount of quantitative phosphoproteomic data generated in recent studies, validation of these data has been quite limited. Furthermore, most of these studies revealed minimal mechanistic insight into the functional role of the kinase-regulated phosphorylation sites. Further advances in bioinformatics and computational biology that can integrate genome, transcriptome, proteome, metabolome, interactome and phenome data will extract useful information about functional phosphorylation. Detailed biochemical and cell biological analyses of selected phosphorylation sites and their responsible kinases are clearly important for elucidating the regulatory networks of cellular functions.
Five-year view
Recent dramatic advances in quantitative phosphoproteomics using LC-MS/MS have provided huge amounts of information about signal-dependent phosphorylation events Citation[135]. Further advances in MS instrumentation and other related analytical tools will provide much more information. In particular, absolute quantification of phosphopeptides and determination of phosphorylation stoichiometry will progress in the future. Such LC-MS/MS-based phosphoproteomic analysis can be complemented by 2DE-based analysis, which has been strengthened by recent technologies including 2D-DIGE, phosphoprotein-specific staining and anti-phosphomotif antibodies. Thus, databases that collect the obtained phosphoproteomic data will expand further, and in silico analysis may accurately predict kinase–substrate relationships in specific cell signaling. Of course, biochemical validation and cell biological examination are required to elucidate new molecular mechanisms in the kinase-mediated signaling pathways. In addition, collected phosphoproteomic data can be used for systems biology to understand spatiotemporal regulation of cell signaling at the network level.
Box 1. Comparative summary of the main advantages and limitations of quantitative phosphoproteomics based on the respective technologies.
2D-DIGE
Advantages
• Easy determination of phosphorylation stoichiometry
• Validation by matching with 2D Western blot
• Simple and accurate quantification
• Widely adaptable
Limitations
• Low throughput
• Relatively small number of identified proteins
• No information about phosphorylation sites
SILAC
Advantages
• High throughput
• Large number of identified peptides and phosphorylation sites
• Accurate quantification
Limitations
• Generally limited to cell culture
• Unintended metabolic interconversion of isotopic amino acids
• Difficulty in determining phosphorylation stoichiometry
iTRAQ/TMT
Advantages
• High throughput
• Large number of identified peptides and phosphorylation sites
• Widely adaptable
Limitations
• Possible errors during the prefractionation process
• Difficulty in determining phosphorylation stoichiometry
Key issues
• The large-scale identification and quantification of phosphoproteins and their phosphorylation sites under different biological conditions are essential to fully understand complex signaling networks.
• Classical 2DE and multiplexing 2D-DIGE remain powerful technologies for phosphoproteomics by combining them with prefractionation and other methods.
• Gel-free liquid chromatography-tandem mass spectrometry analysis has become a robust and high-throughput method for quantifying numerous phosphopeptides with continuous improvement of various tools.
• Prefractionation of proteins or peptides to reduce sample complexity is important for both 2DE- and liquid chromatography-tandem mass spectrometry-based phosphoproteomics to globally detect low-abundance phosphorylation events.
• Bioinformatic analysis using several databases may predict responsible kinases for the identified phosphorylation sites.
• The obtained phosphoproteomic data should be validated by phospho-specific antibodies, Phos-tag Western blotting and selected reaction monitoring/multiple reaction monitoring, among others.
• Further biochemical and cell biological analysis of the identified phosphorylation events can unravel novel mechanisms in protein kinase-mediated cell signaling.
Financial & competing interests disclosure
This work was supported in part by a Grant-in-Aid for Scientific Research (20570177) from the Ministry of Education, Culture, Sports, Science and Technology of Japan and by a grant from the Nagase Science and Technology Foundation to Hidetaka Kosako. The authors have no other relevant affiliations or financial involvement with any organization or entity with a financial interest in or financial conflict with the subject matter or materials discussed in the manuscript apart from those disclosed.
No writing assistance was utilized in the production of this manuscript.
Notes
iTRAQ: Isobaric tag for relative and absolute quantitation; SILAC: Stable isotope labeling by amino acids in cell culture; TMT: Tandem mass tag.
Related Research Data
References
- Hunter T. Signaling – 2000 and beyond. Cell100(1), 113–127 (2000).
- Ubersax JA, Ferrell JE. Mechanisms of specificity in protein phosphorylation. Nat. Rev. Mol. Cell Biol.8(7), 530–541 (2007).
- Manning G, Whyte DB, Martinez R, Hunter T, Sudarsanam S. The protein kinase complement of the human genome. Science298(5600), 1912–1934 (2002).
- Hanahan D, Weinberg RA. The hallmarks of cancer. Cell100(1), 57–70 (2000).
- Gatzka M, Walsh CM. Apoptotic signal transduction and T cell tolerance. Autoimmunity40(6), 442–452 (2007).
- Taniguchi CM, Emanuelli B, Kahn CR. Critical nodes in signaling pathways: insights into insulin action. Nat. Rev. Mol. Cell Biol.7(2), 85–96 (2006).
- Sirard JC, Vignal C, Dessein R, Chamaillard M. Nod-like receptors: cytosolic watchdogs for immunity against pathogens. PLoS Pathog.3(12), e152 (2007).
- Morandell S, Stasyk T, Grosstessner-Hain K et al. Phosphoproteomics strategies for the functional analysis of signal transduction. Proteomics6(14), 4047–4056 (2006).
- de la Fuente van Bentem S, Mentzen WI, de la Fuente A, Hirt H. Towards functional phosphoproteomics by mapping differential phosphorylation events in signaling networks. Proteomics8(21), 4453–4465 (2008).
- White FM. Quantitative phosphoproteomic analysis of signaling network dynamics. Curr. Opin. Biotechnol.19(4), 404–409 (2008).
- Hattori S, Iida N, Kosako H. Identification of protein kinase substrates by proteomic approaches. Exp. Rev. Proteomics5(3), 497–505 (2008).
- Thingholm TE, Jensen ON, Larsen MR. Analytical strategies for phosphoproteomics. Proteomics9(6), 1451–1468 (2009).
- Macek B, Mann M, Olsen JV. Global and site-specific quantitative phosphoproteomics: principles and applications. Annu. Rev. Pharmacol. Toxicol.49, 199–221 (2009).
- Cohen P, Knebel A. KESTREL: a powerful method for identifying the physiological substrates of protein kinases. Biochem. J.393(Pt 1), 1–6 (2006).
- Blethrow JD, Glavy JS, Morgan DO, Shokat KM. Covalent capture of kinase-specific phosphopeptides reveals Cdk1-cyclin B substrates. Proc. Natl Acad. Sci. USA105(5), 1442–1447 (2008).
- Fukunaga R, Hunter T. Identification of MAPK substrates by expression screening with solid-phase phosphorylation. Methods Mol. Biol.250, 211–236 (2004).
- Mok J, Im H, Snyder M. Global identification of protein kinase substrates by protein microarray analysis. Nat. Protoc.4(12), 1820–1827 (2009).
- Görg A, Weiss W, Dunn MJ. Current two-dimensional electrophoresis technology for proteomics. Proteomics4(12), 3665–3685 (2004).
- Oh P, Li Y, Yu J et al. Subtractive proteomic mapping of the endothelial surface in lung and solid tumours for tissue-specific therapy. Nature429(6992), 629–635 (2004).
- Stasyk T, Dubrovska A, Lomnytska M et al. Phosphoproteome profiling of transforming growth factor (TGF)-β signaling: abrogation of TGFβ1-dependent phosphorylation of transcription factor-II-I (TFII-I) enhances cooperation of TFII-I and Smad3 in transcription. Mol. Biol. Cell16(10), 4765–4780 (2005).
- Agrawal GK, Thelen JJ. Large scale identification and quantitative profiling of phosphoproteins expressed during seed filling in oilseed rape. Mol. Cell. Proteomics5(11), 2044–2059 (2006).
- Uuml;nlü M, Morgan ME, Minden JS. Difference gel electrophoresis: a single gel method for detecting changes in protein extracts. Electrophoresis18(11), 2071–2077 (1997).
- Viswanathan S, Ünlü M, Minden JS. Two-dimensional difference gel electrophoresis. Nat. Protoc.1(3), 1351–1358 (2006).
- Marouga R, David S, Hawkins E. The development of the DIGE system: 2D fluorescence difference gel analysis technology. Anal. Bioanal. Chem.382(3), 669–678 (2005).
- Lilley KS, Friedman DB. All about DIGE: quantification technology for differential-display 2D-gel proteomics. Exp. Rev. Proteomics1(4), 401–409 (2004).
- Kondo T, Hirohashi S. Application of highly sensitive fluorescent dyes (CyDye DIGE Fluor saturation dyes) to laser microdissection and two-dimensional difference gel electrophoresis (2D-DIGE) for cancer proteomics. Nat. Protoc.1(6), 2940–2956 (2006).
- Stasyk T, Morandell S, Bakry R et al. Quantitative detection of phosphoproteins by combination of two-dimensional difference gel electrophoresis and phosphospecific fluorescent staining. Electrophoresis26(14), 2850–2854 (2005).
- Kosako H, Yamaguchi N, Aranami C et al. Phosphoproteomics reveals new ERK MAP kinase targets and links ERK to nucleoporin-mediated nuclear transport. Nat. Struct. Mol. Biol.16(10), 1026–1035 (2009).
- Collins MO, Yu L, Coba MP et al. Proteomic analysis of in vivo phosphorylated synaptic proteins. J. Biol. Chem.280(7), 5972–5982 (2005).
- Dubrovska A, Souchelnytskyi S. Efficient enrichment of intact phosphorylated proteins by modified immobilized metal-affinity chromatography. Proteomics5(18), 4678–4683 (2005).
- Machida M, Kosako H, Shirakabe K et al. Purification of phosphoproteins by immobilized metal affinity chromatography and its application to phosphoproteome analysis. FEBS J.274(6), 1576–1587 (2007).
- Ueda K, Kosako H, Fukui Y, Hattori S. Proteomic identification of Bcl2-associated athanogene 2 as a novel MAPK-activated protein kinase 2 substrate. J. Biol. Chem.279(40), 41815–41821 (2004).
- Hong Z, Zhang QY, Liu J et al. Phosphoproteome study reveals Hsp27 as a novel signaling molecule involved in GDNF-induced neurite outgrowth. J. Proteome Res.8(6), 2768–2787 (2009).
- Morales MA, Watanabe R, Dacher M et al. Phosphoproteome dynamics reveal heat-shock protein complexes specific to the Leishmania donovani infectious stage. Proc. Natl Acad. Sci. USA107(18), 8381–8386 (2010).
- Stasyk T, Schiefermeier N, Skvortsov S et al. Identification of endosomal epidermal growth factor receptor signaling targets by functional organelle proteomics. Mol. Cell. Proteomics6(5), 908–922 (2007).
- Tang W, Deng Z, Oses-Prieto JA et al. Proteomics studies of brassinosteroid signal transduction using prefractionation and two-dimensional DIGE. Mol. Cell. Proteomics7(4), 728–738 (2008).
- Tang W, Kim TW, Oses-Prieto JA et al. BSKs mediate signal transduction from the receptor kinase BRI1 in Arabidopsis. Science321(5888), 557–560 (2008).
- Lewis TS, Shapiro PS, Ahn NG. Signal transduction through MAP kinase cascades. Adv. Cancer Res.74, 49–139 (1998).
- Pearson G, Robinson F, Beers Gibson T, et al. Mitogen-activated protein (MAP) kinase pathways: regulation and physiological functions. Endocr. Rev.22(2), 153–183 (2001).
- Yoon S, Seger R. The extracellular signal-regulated kinase: multiple substrates regulate diverse cellular functions. Growth Factors24(1), 21–44 (2006).
- Eblen ST, Kumar NV, Shah K et al. Identification of novel ERK2 substrates through use of an engineered kinase and ATP analogs. J. Biol. Chem.278(17), 14926–14935 (2003).
- Allen JJ, Li M, Brinkworth CS et al. A semisynthetic epitope for kinase substrates. Nat. Methods4(6), 511–516 (2007).
- Popescu SC, Popescu GV, Bachan S et al. MAPK target networks in Arabidopsis thaliana revealed using functional protein microarrays. Genes Dev.23(1), 80–92 (2009).
- Lewis TS, Hunt JB, Aveline LD et al. Identification of novel MAP kinase pathway signaling targets by functional proteomics and mass spectrometry. Mol. Cell6(6), 1343–1354 (2000).
- Roberts EC,Hammond K, Traish AM, Resing KA, Ahn NG. Identification of G2/M targets for the MAP kinase pathway by functional proteomics. Proteomics6(16), 4541–4553 (2006).
- Kosako H, Imamoto N. Phosphorylation of nucleoporins: signal transduction-mediated regulation of their interaction with nuclear transport receptors. Nucleus1(4), 309–313 (2010).
- Witze ES, Old WM, Resing KA, Ahn NG. Mapping protein post-translational modifications with mass spectrometry. Nat. Methods4(10), 798–806 (2007).
- Andersson L, Porath J. Isolation of phosphoproteins by immobilized metal (Fe3+) affinity chromatography. Anal. Biochem.154(1), 250–254 (1986).
- Nuwaysir LM, Stults JT. Electrospray ionization mass spectrometry of phosphopeptides isolated by on-line immobilized metal-ion affinity chromatography. J. Am. Soc. Mass Spectrom.4(8), 662–667 (1993).
- Xhou W, Merrick BA, Khaledi MG, Tomer KB. Detection and sequencing of phosphopeptides affinity bound to immobilized metal ion beads by matrix-assisted laser desorption/ionization mass spectrometry. J. Am. Soc. Mass Spectrom.11(4), 273–282 (2000).
- Muszynska G, Dobrowolska G, Medin A, Ekman P, Porath JO. Model studies on iron(III) ion affinity chromatography. II. Interaction of immobilized iron(III) ions with phosphorylated amino acids, peptides and proteins. J. Chromatogr.604(1), 19–28 (1992).
- Posewitz MC, Tempst P. Immobilized gallium(III) affinity chromatography of phosphopeptides. Anal. Chem.71(14), 2883–2892 (1999).
- Ficarro SB, McCleland ML, Stukenberg PT et al. Phosphoproteome analysis by mass spectrometry and its application to Saccharomyces cerevisiae. Nat. Biotechnol.20(3), 301–305 (2002).
- Chi YH, Haller K, Ward MD, Semmes OJ, Li Y, Jeang KT. Requirements for protein phosphorylation and the kinase activity of polo-like kinase 1 (Plk1) for the kinetochore function of mitotic arrest deficiency protein 1 (Mad1). J. Biol. Chem.283(51), 35834–35844 (2008).
- Lyons TR, Thorburn J, Ryan PW, Thorburn A, Anderson SM, Kassenbrock CK. Regulation of the pro-apoptotic scaffolding protein POSH by Akt. J. Biol. Chem.282(30), 21987–21997 (2007).
- Kirkland PA, Gil MA, Karadzic IM, Maupin-Furlow JA. Genetic and proteomic analyses of a proteasome-activating nucleotidase A mutant of the haloarchaeon Haloferax volcanii. J. Bacteriol.190(1), 193–205 (2008).
- Nagano K, Shinkawa T, Mutoh H et al. Phosphoproteomic analysis of distinct tumor cell lines in response to nocodazole treatment. Proteomics9(10), 2861–2874 (2009).
- Pinkse MW, Uitto PM, Hilhorst MJ, Ooms B, Heck AJ. Selective isolation at the femtomole level of phosphopeptides from proteolytic digests using 2D-NanoLC-ESI-MS/MS and titanium oxide precolumns. Anal. Chem.76(14), 3935–3943 (2006).
- Larsen MR, Thingholm TE, Jensen ON, Roepstorff P, Jorgensen TJ. Highly selective enrichment of phosphorylated peptides from peptide mixtures using titanium dioxide microcolumns. Mol. Cell. Proteomics4(7), 873–886 (2005).
- Kweon HK, Håkansson K. Selective zirconium dioxide-based enrichment of phosphorylated peptides for mass spectrometric analysis. Anal. Chem.78(6), 1743–1749 (2006).
- Sugiyama N, Masuda T, Shinoda K, Nakamura A, Tomita M, Ishihama Y. Phosphopeptide enrichment by aliphatic hydroxy acid-modified metal oxide chromatography for nano-LC-MS/MS in proteomics applications. Mol. Cell. Proteomics6(6), 1103–1109 (2007).
- Beausoleil SA, Jedrychowski M, Schwartz D et al. Large-scale characterization of HeLa cell nuclear phosphoproteins. Proc. Natl Acad. Sci. USA101(33), 12130–12135 (2004).
- Gruhler A, Olsen JV, Mohammed S et al. Quantitative phosphoproteomics applied to the yeast pheromone signaling pathway. Mol. Cell. Proteomics4(3), 310–327 (2005).
- Olsen JV, Blagoev B, Gnad F et al. Global, in vivo, and site-specific phosphorylation dynamics in signaling networks. Cell127(3), 635–648 (2006).
- Villén J, Beausoleil SA, Gerber SA, Gygi SP. Large-scale phosphorylation analysis of mouse liver. Proc. Natl Acad. Sci. USA104(50), 1488–1493 (2007).
- Dephoure N, Zhou C, Villén J et al. A quantitative atlas of mitotic phosphorylation. Proc. Natl Acad. Sci. USA105(31), 10762–10767 (2008).
- Olsen JV, Vermeulen M, Santamaria A et al. Quantitative phosphoproteomics reveals widespread full phosphorylation site occupancy during mitosis. Sci. Signal.3(104), ra3 (2010).
- McNulty DE, Annan RS. Hydrophilic interaction chromatography reduces the complexity of the phosphoproteome and improves global phosphopeptide isolation and detection. Mol. Cell. Proteomics7(5), 971–980 (2008).
- Pandey A, Podtelejnikov AV, Blagoev B, Bustelo XR, Mann M, Lodish HF. Analysis of receptor signaling pathways by mass spectrometry: identification of vav-2 as a substrate of the epidermal and platelet-derived growth factor receptors. Proc. Natl Acad. Sci. USA97(1), 179–184 (2000).
- Nagano K, Itagaki C, Izumi T et al. Rb plays a role in survival of Abl-dependent human tumor cells as a downstream effector of Abl tyrosine kinase. Oncogene25(4), 493–502 (2006).
- Matsumoto M, Oyamada K, Takahashi H, Sato T, Hatakeyama S, Nakayama KI. Large-scale proteomic analysis of tyrosine-phosphorylation induced by T-cell receptor or B-cell receptor activation reveals new signaling pathways. Proteomics9(13), 3549–3563 (2009).
- Rush J, Moritz A, Lee KA et al. Immunoaffinity profiling of tyrosine phosphorylation in cancer cells. Nat. Biotechnol.23(1), 94–101 (2005).
- Rikova K, Guo A, Zeng Q et al. Global survey of phosphotyrosine signaling identifies oncogenic kinases in lung cancer. Cell131(6), 1190–1203 (2007).
- Matsuoka S, Ballif BA, Smogorzewska A et al. ATM and ATR substrate analysis reveals extensive protein networks responsive to DNA damage. Science316(5828), 1160–1166 (2007).
- Olsen JV, Mann M. Improved peptide identification in proteomics by two consecutive stages of mass spectrometric fragmentation. Proc. Natl Acad. Sci. USA101(37), 13417–13422 (2004).
- Schroeder MJ, Shabanowitz J, Schwartz JC, Hunt DF, Coon JJ. A neutral loss activation method for improved phosphopeptide sequence analysis by quadrupole ion trap mass spectrometry. Anal. Chem.76(13), 3590–3598 (2004).
- Palumbo AM, Reid GE. Evaluation of gas-phase rearrangement and competing fragmentation reactions on protein phosphorylation site assignment using collision induced dissociation-MS/MS and MS3. Anal. Chem.80(24), 9735–9747 (2008).
- Syka JE, Coon JJ, Schroeder MJ, Shabanowitz J, Hunt DF. Peptide and protein sequence analysis by electron transfer dissociation mass spectrometry. Proc. Natl Acad. Sci. USA101(26), 9528–9533 (2004).
- Aguiar M, Haas W, Beausoleil SA, Rush J, Gygi SP. Gas-phase rearrangements do not affect site localization reliability in phosphoproteomics data sets. J. Proteome Res.9(6), 3103–3107 (2010).
- Mischerikow N, Altelaar AF, Navarro JD, Mohammed S, Heck A. Comparative assessment of site assignments in CID and ETD spectra of phosphopeptides discloses limited relocation of phosphate groups. Mol. Cell. Proteomics9(10), 2140–2148 (2010).
- Zubarev RA, Horn DM, Fridriksson EK et al. Electron capture dissociation for structural characterization of multiply charged protein cations. Anal. Chem.72(3), 563–573 (2000).
- Stensballe A, Jensen ON, Olsen JV, Haselmann KF, Zubarev RA. Electron capture dissociation of singly and multiply phosphorylated peptides. Rapid Commun. Mass Spectrom.14(19), 1793–1800 (2000).
- Chi A, Huttenhower C, Geer LY et al. Analysis of phosphorylation sites on proteins from Saccharomyces cerevisiae by electron transfer dissociation (ETD) mass spectrometry. Proc. Natl Acad. Sci. USA104(7), 2193–2198 (2007).
- Håkansson K, Cooper HJ, Emmett MR, Costello CE, Marshall AG, Nilsson CL. Electron capture dissociation and infrared multiphoton dissociation MS/MS of an N-glycosylated tryptic peptic to yield complementary sequence information. Anal. Chem.73(18), 4530–4536 (2001).
- Mirgorodskaya E, Roepstorff P, Zubarev RA. Localization of O-glycosylation sites in peptides by electron capture dissociation in a Fourier transform mass spectrometer. Anal. Chem.71(20), 4431–4436 (1999).
- Udeshi ND, Shabanowitz J, Hunt DF, Rose KL. Analysis of proteins and peptides on a chromatographic timescale by electron-transfer dissociation MS. FEBS J.274(24), 6269–6276 (2007).
- Sweet SM, Bailey CM, Cunningham DL, Heath JK, Cooper HJ. Large scale localization of protein phosphorylation by use of electron capture dissociation mass spectrometry. Mol. Cell. Proteomics8(5), 904–912 (2009).
- Good DM, Wirtala M, McAlister GC, Coon JJ. Performance characteristics of electron transfer dissociation mass spectrometry. Mol. Cell. Proteomics6(11), 1942–1951 (2007).
- Swaney DL, McAlister GC, Coon JJ. Decision tree-driven tandem mass spectrometry for shotgun proteomics. Nat. Methods5(11), 959–964 (2008).
- Swaney DL, Wenger CD, Thomson JA, Coon JJ. Human embryonic stem cell phosphoproteome revealed by electron transfer dissociation tandem mass spectrometry. Proc. Natl Acad. Sci. USA106(4), 995–1000 (2009).
- Beausoleil SA, Villén J, Gerber SA, Rush J, Gygi SP. A probability-based approach for high-throughput protein phosphorylation analysis and site localization. Nat. Biotechnol.24(10), 1285–1292 (2006).
- Bailey CM, Sweet SM, Cunningham DL, Zeller M, Heath JK, Cooper HJ. SLoMo: automated site localization of modifications from ETD/ECD mass spectra. J. Proteome Res.8(4), 1965–1971 (2009).
- Lu P, Vogel C, Wang R, Yao X, Marcotte EM. Absolute protein expression profiling estimates the relative contributions of transcriptional and translational regulation. Nat. Biotechnol.25(1), 117–124 (2007).
- Vogel C, Marcotte EM. Calculating absolute and relative protein abundance from mass spectrometry-based protein expression data. Nat. Protoc.3(9), 1444–1451 (2008).
- Griffin NM, Yu J, Long F et al. Label-free, normalized quantification of complex mass spectrometry data for proteomic analysis. Nat. Biotechnol.28(1), 83–89 (2010).
- Silva JC, Gorenstein MV, Li GZ, Vissers JP, Geromanos SJ. Absolute quantification of proteins by LCMSE: a virtue of parallel MS acquisition. Mol. Cell. Proteomics5(1), 144–156 (2006).
- Oda Y, Huang K, Cross FR, Cowburn D, Chait BT. Accurate quantitation of protein expression and site-specific phosphorylation. Proc. Natl Acad. Sci. USA96(12), 6591–6596 (1999).
- Ong SE, Mann M. Mass spectrometry-based proteomics turns quantitative. Nat. Chem. Biol.1(5), 252–262 (2005).
- Li XJ, Yi EC, Kemp CJ, Zhang H, Aebersold R. A software suite for the generation and comparison of peptide arrays from sets of data collected by liquid chromatography-mass spectrometry. Mol. Cell. Proteomics4(9), 1328–1340 (2005).
- Bellew M, Coram M, Fitzgibbon M et al. A suite of algorithms for the comprehensive analysis of complex protein mixtures using high-resolution LC-MS. Bioinformatics22(15), 1902–1909 (2006).
- Palagi PM, Walther D, Quadroni M et al. MSight: an image analysis software for liquid chromatography-mass spectrometry. Proteomics5(9), 2381–2384 (2005).
- Kohlbacher O, Reinert K, Gröpl C et al. TOPP – the OpenMS proteomics pipeline. Bioinformatics23(2), e191–e197 (2007).
- Jaffe JD, Mani DR, Leptos KC, Church GM, Gillette MA, Carr SA. PEPPeR, a platform for experimental proteomic pattern recognition. Mol. Cell. Proteomics5(10), 1927–1941 (2006).
- Mueller LN, Rinner O, Schmidt A et al. SuperHirn – a novel tool for high resolution LC-MS-based peptide/protein profiling. Proteomics7(19), 3470–3480 (2007).
- Cox J, Mann M. MaxQuant enables high peptide identification rates, individualized p.p.b.-range mass accuracies and proteome-wide protein quantification. Nat. Biotechnol.26(12), 1367–1372 (2008).
- Mueller LN, Brusniak MY, Mani DR, Aebersold R. An assessment of software solutions for the analysis of mass spectrometry based quantitative proteomics data. J. Proteome Res.7(1), 51–61 (2008).
- Old WM, Shabb JB, Houel S et al. Functional proteomics identifies targets of phosphorylation by B-Raf signaling in melanoma. Mol. Cell34(1), 115–131 (2009).
- Gygi SP, Rist B, Gerber SA, Turecek F, Gelb MH, Aebersold R. Quantitative analysis of complex protein mixtures using isotope-coded affinity tags. Nat. Biotechnol.17(10), 994–999 (1999).
- Ong SE, Blagoev B, Kratchmarova I et al. Stable isotope labeling by amino acids in cell culture, SILAC, as a simple and accurate approach to expression proteomics. Mol. Cell. Proteomics1(5), 376–386 (2002).
- Ross PL, Huang YN, Marchese JN et al. Multiplexed protein quantitation in Saccharomyces cerevisiae using amine-reactive isobaric tagging reagents. Mol. Cell. Proteomics3(12), 1154–1169 (2004).
- Thompson A, Schäfer J, Kuhn K et al. Tandem mass tags: a novel quantification strategy for comparative analysis of complex protein mixtures by MS/MS. Anal. Chem.75(8), 1895–1904 (2003).
- Mann M. Functional and quantitative proteomics using SILAC. Nat. Rev. Mol. Cell Biol.7(12), 952–958 (2006).
- Ishihama Y, Sato T, Tabata T et al. Quantitative mouse brain proteomics using culture-derived isotope tags as internal standards. Nat. Biotechnol.23(5), 617–621 (2005).
- Krüger M, Moser M, Ussar S et al. SILAC mouse for quantitative proteomics uncovers kindlin-3 as an essential factor for red blood cell function. Cell134(2), 353–364 (2008).
- Trinidad JC, Thalhammer A, Specht CG et al. Quantitative analysis of synaptic phosphorylation and protein expression. Mol. Cell. Proteomics7(4), 684–696 (2008).
- Zhang Y, Wolf-Yadlin A, Ross PL et al. Time-resolved mass spectrometry of tyrosine phosphorylation sites in the epidermal growth factor receptor signaling network reveals dynamic modules. Mol. Cell. Proteomics4(9), 1240–1250 (2005).
- Wang Z, Gucek M, Hart GW. Cross-talk between GlcNAcylation and phosphorylation: site-specific phosphorylation dynamics in response to globally elevated O-GlcNAc. Proc. Natl Acad. Sci. USA105(37), 13793–13798 (2008).
- Nabetani T, Kim YJ, Watanabe M, Ohashi Y, Kamiguchi H, Hirabayashi Y. Improved method of phosphopeptides enrichment using biphasic phosphate-binding tag/C18 tip for versatile analysis of phosphorylation dynamics. Proteomics9(24), 5525–5533 (2009).
- Nilsson CL, Dillon R, Devakumar A et al. Quantitative phosphoproteomic analysis of the STAT3/IL-6/HIF1α signaling network: an initial study in GSC11 glioblastoma stem cells. J. Proteome Res.9(1), 430–443 (2010).
- Dayon L, Pasquarello C, Hoogland C, Sanchez JC, Scherl A. Combining low- and high-energy tandem mass spectra for optimized peptide quantification with isobaric tags. J. Proteomics73(4), 769–777 (2010).
- Gnad F, Ren S, Cox J et al. PHOSIDA (phosphorylation site database): management, structural and evolutionary investigation, and prediction of phosphosites. Genome Biol.8(11), R250 (2007).
- Linding R, Jensen LJ, Ostheimer GJ et al. Systematic discovery of in vivo phosphorylation networks. Cell129(7), 1415–1426 (2007).
- Han MY, Kosako H, Watanabe T, Hattori S. Extracellular signal-regulated kinase/mitogen-activated protein kinase regulates actin organization and cell motility by phosphorylating the actin cross-linking protein EPLIN. Mol. Cell. Biol.27(23), 8190–8204 (2007).
- Kinoshita-Kikuta E, Aoki Y, Kinoshita E, Koike T. Label-free kinase profiling using phosphate affinity polyacrylamide gel electrophoresis. Mol. Cell. Proteomics6(2), 356–366 (2007).
- Kosako H. Phos-tag Western blotting for detecting stoichiometric protein phosphorylation in cells. Nat. Protoc. DOI: 10.1038/nprot.2009.170 (2009) (Epub ahead of print).
- Cox DM, Zhong F, Du M, Duchoslav E, Sakuma T, McDermott JC. Multiple reaction monitoring as a method for identifying protein posttranslational modifications. J. Biomol. Tech.16(2), 83–90 (2005).
- Wolf-Yadlin A, Hautaniemi S, Lauffenburger DA, White FM. Multiple reaction monitoring for robust quantitative proteomic analysis of cellular signaling networks. Proc. Natl Acad. Sci. USA104(14), 5860–5865 (2007).
- Unwin RD, Griffiths JR, Whetton AD. A sensitive mass spectrometric method for hypothesis-driven detection of peptide post-translational modifications: multiple reaction monitoring-initiated detection and sequencing (MIDAS). Nat. Protoc.4(6), 870–877 (2009).
- Tong J, Taylor P, Peterman SM, Prakash A, Moran MF. Epidermal growth factor receptor phosphorylation sites Ser991 and Tyr998 are implicated in the regulation of receptor endocytosis and phosphorylations at Ser1039 and Thr1041. Mol. Cell. Proteomics8(9), 2131–2144 (2009).
- Johnson RP, El-Yazbi AF, Hughes MF et al. Identification and functional characterization of protein kinase A-catalyzed phosphorylation of potassium channel Kv1.2 at serine 449. J. Biol. Chem.284(24), 16562–16574 (2009).
- Ciccimaro E, Hanks SK, Yu KH, Blair IA. Absolute quantification of phosphorylation on the kinase activation loop of cellular focal adhesion kinase by stable isotope dilution liquid chromatography/mass spectrometry. Anal. Chem.81(9), 3304–3313 (2009).
- Traweger A, Wiggin G, Taylor L, Tate SA, Metalnikov P, Pawson T. Protein phosphatase 1 regulates the phosphorylation state of the polarity scaffold Par-3. Proc. Natl Acad. Sci. USA105(30), 10402–10407 (2008).
- Bodenmiller B, Mueller LN, Mueller M, Domon B, Aebersold R. Reproducible isolation of distinct, overlapping segments of the phosphoproteome. Nat. Methods4(3), 231–237 (2007).
- Pan C, Olsen JV, Daub H, Mann M. Global effects of kinase inhibitors on signaling networks revealed by quantitative phosphoproteomics. Mol. Cell. Proteomics8(12), 2796–2808 (2009).
- Choudhary C, Mann M. Decoding signalling networks by mass spectrometry-based proteomics. Nat. Rev. Mol. Cell Biol.11(6), 427–439 (2010).
Websites
- Phospho.ELM: a database of S/T/Y phosphorylation sites http://phospho.elm.eu.org
- PhosphoSitePlus www.phosphosite.org
- Phosida: posttranslational modification database www.phosida.com
- ScanSite http://scansite.mit.edu
- NetPhos 2.0 server www.cbs.dtu.dk/services/NetPhos