Abstract
A major ambition of proteomics is the provision of assays that can diagnose disease and monitor therapies. These assays are required to be sensitive and specific for individual proteins, and in most cases to quantify more than one protein in the same sample. The two main technologies currently used for proteomics assays are based on mass spectrometry and panels of affinity molecules such as antibodies. In the first part of this review the most sensitive existing assays based on these technologies are described and compared with the gold standard of ELISA. Analytical sensitivity is defined and related to the limit of detection, and analytical specificity is defined and shown to depend on molecular proofreading steps, similar to those applied in living systems whenever there is a need for high fidelity. It is shown that at present neither mass spectrometry nor panels of affinity molecules offer the necessary combination of sensitivity and specificity required for multiplexed assays. In the second part of this review the growing numbers of assays that use additional proofreading steps to combine sensitivity with specificity are described. These include assays based on proximity ligation and slow off-rate modified aptamers. Finally the review considers what improvements might be possible in the near future, and concludes that further development of proteomics assays incorporating advanced proofreading steps are most likely to provide the necessary combination of sensitivity and specificity, without incurring high development costs.
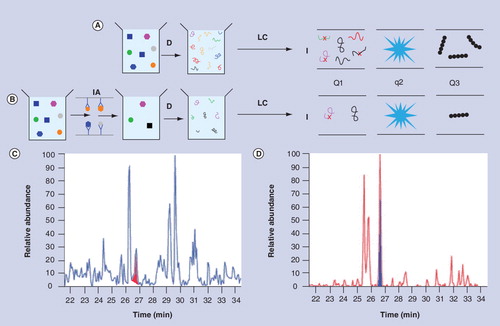
(A) Multiple reaction monitoring analysis of whole plasma. (B) Multiple reaction monitoring analysis of whole plasma with immuno-affinity depletion of abundant proteins. (C) Ion-current plot without IA depletion with peak corresponding to gelsolin shaded in red. (D) Ion-current plot with IA depletion of 20 abundant proteins with peak corresponding to gelsolin shaded in blue.
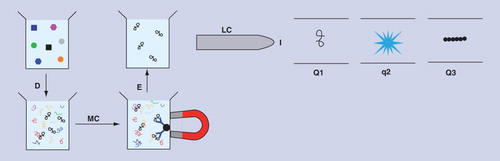
D: Enzymatic digestion of sample; I: Ionization of peptides; IA: Immuno-affinity; LC: Liquid chromatography; Q1: Analyzer 1; q2: Collision cell; Q3: Analyzer 2.
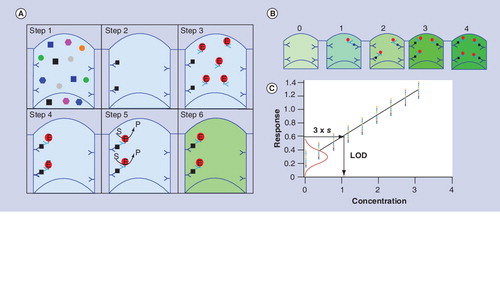
(A) Key steps in a sandwich ELISA (see text for explanation). (B) The amount of enzyme product is proportional to the amount of bound target substance, which in turn is proportional to the amount of target substance in the original sample. (C) A calibration graph can be constructed based on the response (the amount of detectable product) of a series of calibrator solutions containing known concentrations of the target substance. The red Gaussian curve is based on the standard deviation (s) of the zero calibrator. The LOD can be determined by horizontal projection of a line at 3 × s of the zero calibrator until it intersects the response line, followed by vertical projection of the intersection point down onto the x-axis. In this example the LOD is 1.16.
E: Enzyme label; LOD: Limit of detection; P: Product of enzyme-catalyzed reaction; S: Enzyme substrate.
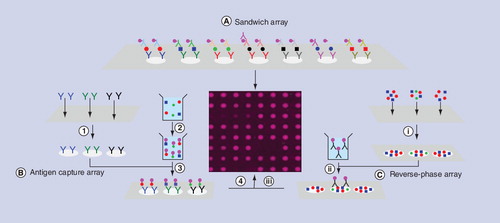
(A) Completed sandwich immunoassay array; the workflow is similar to ELISA, but the label must produce a signal that does not diffuse away from its location in the grid. (B) Main steps in the development of an antigen capture array. (1) Print array of antibodies on planar substrate; (2) label molecules in sample; (3) incubate labeled sample with array; (4) acquire image of completed array. (C) Main steps in the development of a reverse-phase array. (i) Print samples on planar substrate; (ii) incubate labeled antibodies for specific target substance with array; (iii) acquire image of completed array.
LOD: Limit of detection.
LOD: Limit of detection.
Data taken from Citation[75].
![Figure 5. Limits of detection reported for sandwich immunoassays (ELISA and time-resolved fluorescence).LOD: Limit of detection.Data taken from Citation[75].](/cms/asset/4300d174-3a78-4ebe-a293-93b3713ecaa3/ieru_a_11216690_f0005_b.jpg)
The inset equations show how the error fraction at each step would be calculated if there was only one cross-reacting substance.
Each red asterisk corresponds to one proof reading step.
![Figure 6. The four stages in a sandwich immunoassay seen as proofreading steps in which the error fraction (ratio of the intended target molecule [red circles] to cross-reacting substance [black squares]) is successively attenuated.The inset equations show how the error fraction at each step would be calculated if there was only one cross-reacting substance.Each red asterisk corresponds to one proof reading step.](/cms/asset/a5311412-2000-4716-9f7e-dd5613215271/ieru_a_11216690_f0006_b.jpg)
D: Enzymatic digestion of sample; E: Dissociation of peptides from antibodies; I: Ionization of peptides; LC: Liquid chromatography; MC: Magnetic capture of peptides bound to antibodies; Q1: Analyzer 1; q2: Collision cell; Q3: Analyzer 2.
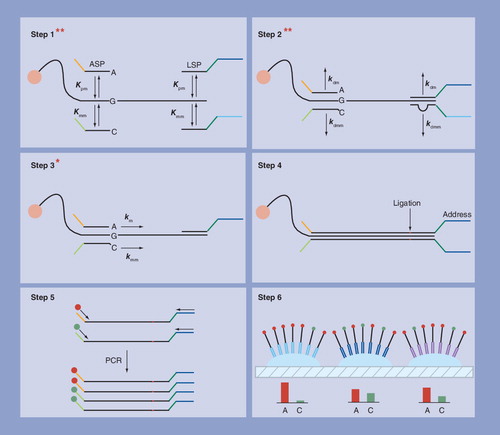
Step 1: competitive hybridization of ASPs and LSPs to genomic target sequence attached to a magnetic bead – two proofreading steps. Step 2: stringent washing to preferentially dissociate incorrectly hybridized probes – two proofreading steps. Step 3: extension of ASP with matched 3′-terminal base – one proofreading step. Step 4: ligation of extended ASP to LSP. Step 5: PCR of ligated probes with fluorescent primers. Step 6: hybridization of PCR products to an array of probes in a fiber optic plate.
ASP: Allele-specific probe; LSP: Locus-specific probe.
Steps 1–4 are similar to a sandwich immunoassay except that the number of proofreading steps is increased by using two detector antibodies. The detector antibodies are labeled with oligonucleotides that are only linked together in Step 5 if they are located in close proximity. In Step 6 oligonucleotides that have been linked together are detected by real time PCR.
![Figure 9. Proximity ligation immunoassay described in Citation[57] with the location and number of the main proofreading steps indicated by inset red asterisks.Steps 1–4 are similar to a sandwich immunoassay except that the number of proofreading steps is increased by using two detector antibodies. The detector antibodies are labeled with oligonucleotides that are only linked together in Step 5 if they are located in close proximity. In Step 6 oligonucleotides that have been linked together are detected by real time PCR.](/cms/asset/f35f5536-91c7-4a3c-8a48-ed23da0132c8/ieru_a_11216690_f0009_b.jpg)
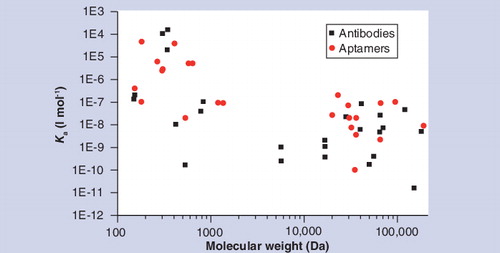
The affinities of DNA aptamers are comparable with antibodies when the target substance has a low molecular weight, but, in general, affinities for higher molecular weight substances are inferior to antibodies.
Proteomics is the large-scale study of proteins in health and disease. For the purpose of study an organism’s proteins are often divided into proteomes based on different tissues or cells. The proteins in these proteomes are then studied in experiments that range from discovery proteomics that aims to identify large unbiased sets of proteins, to assays that aim to quantify preselected panels of proteins. From discovery proteomics to assays there is a trend from higher content (large numbers of proteins identified) and low sensitivity, to lower content and higher sensitivity. This article is about the higher sensitivity end of this trend. The plasma proteome is the main target for the proteomics assays described in this review because of its accessibility, and because proteins shed into it by other proteomes are presumed to be diagnostic of health in other parts of the body, but the complexity that this leads to presents great challenges. Plasma probably contains most human proteins as well as proteins from other sources such as bacteria, viruses and fungi Citation[1,2]. Most of this protein (99% by mass) is in the form of 22 high abundance proteins that are present at concentrations of up to 10 mM (50 mg ml-1) in the case of serum albumin, but other proteins, including some that frequently need to be measured, are present at much lower concentrations. The range of concentrations most often cited is the ten order of magnitude range from serum albumin to IL-6 (one of the least abundant proteins currently targeted in diagnostic assays that is present at a concentration of ~100 fM in healthy individuals), but many proteins that would probably be diagnostic of early stage disease are likely to be present at even lower concentrations. The basic number of approximately 22,000 nonredundant proteins (gene products) is expanded by the existence of numerous variants that may have significant molecular similarity but different functions due to post-translational modifications. Most proteins function within biochemical networks and pathways, often as components of multimolecular complexes. Therefore, the activity of a one protein depends not only on its own concentration, but also on the concentrations of other proteins that interact with or inhibit it. A well-documented example is cytokines Citation[3,4]. This family of small messenger proteins participates in a diversity of biochemical processes such as cell growth, cell differentiation, tissue repair and remodeling, and regulation of the immune response. They often exert their effects in concert with other cytokines and therefore information about a single cytokine is unlikely to reveal much about a patient’s state of health. Thus, proteomics assays must be able to quantify multiple proteins that may be present in samples at low concentrations, without interference from other proteins that may be present at much higher concentrations. Assays that succeed in this aim are said to be sensitive and specific, where sensitivity is a measure of how well an assay succeeds in detecting low concentrations of target proteins, and specific is a measure of how well it succeeds in discriminating between target proteins and other proteins that are present in the sample (these definitions of sensitivity and specificity should not be confused with diagnostic sensitivity and specificity) Citation[5]. The concentrations of some proteins may vary by as much as four orders of magnitude on stimulation and therefore another important characteristic of any assay is dynamic range, which is a measure of the concentration range over which a target protein can be accurately quantified. The two main technologies used to assay proteomes at present are mass spectrometry (MS) and multiplexed immunoassays. This review compares the advantages and disadvantages of assays based on these technologies, and examines to what extent they are able to provide the required combination of sensitivity and specificity.
MS proteomics
Many versions of MS have been used for proteomics Citation[6–8], but most involve digestion of proteins into peptides followed by fractionation using HPLC, gas chromatography or capillary electrophoresis. The fractionated peptides are then fed into the mass spectrometer which has three main components: the ionization source, the analyzer and the detector. Peptides are ionized and extracted into the analyzer, where they are separated according to their mass/charge (m/z) ratio and detected. This is followed by off-line identification of the original proteins by comparison with a database of peptides. The simplest untargeted versions of MS can identify hundreds of proteins on a time scale of approximately 1 h, but many proteins are undetectable because their presence is obscured by more abundant proteins. Thus, a major trend in MS has been the development of techniques that increase sensitivity by decreasing the background signal due to other proteins. Some techniques decrease the background by subtracting interfering molecules from the sample while allowing targeted proteins or peptides to flow on towards the detector Citation[9]. Examples of subtractive techniques are HPLC, gel electrophoresis and immuno-affinity depletion. The effect of subtraction can be seen by considering a specific example. The MRM (multiple reaction monitoring, also known as selective reaction monitoring) version of MS is carried out in a tandem mass spectrometer composed of two analyzers separated by a collision cell as shown in . Signature ions derived from up to 100 digested targeted proteins are selected in the first analyzer and fragmented in the collision cell. The fragments are separated in the second analyzer before detection and results are presented in the form of a total ion-current plot as shown in . shows the workflow for MRM with an additional subtraction step in the form of an immuno-affinity column that binds 20 abundant proteins in blood plasma; the corresponding ion-current plot is shown in . Comparison of shows that the peak corresponding to a targeted protein (gelsolin) is relatively larger and more distinct because the additional subtraction step has decreased the background signal. MRM with immuno-affinity subtraction of abundant proteins has a dynamic range of approximately four orders of magnitude and sensitivities of around 10 ng ml-1 (equivalent to 200 pM for a protein with a molecular weight [MW] of 50 kDa), which is not sensitive enough to detect many low abundance proteins. All subtraction techniques dilute the sample and may also subtract target molecules nonspecifically, and therefore sensitivity is not necessarily increased by applying more than one subtraction technique. Recently, however, low picomolar concentrations of prostate-specific antigen were detected in 15 µl of serum with a workflow that applied reversed-phase HPLC at high pH, followed by reversed-phase HPLC at low pH and MRM Citation[10]. A disadvantage of this strategy (known as PRISM) is that even at low multiplexing levels only 50 samples can be assayed per week. Low sample throughput is a common feature of MS-based proteomics assays; in general, the number of samples that can be assayed in a given time decreases as the sensitivity increases. An alternative to subtraction techniques is to decrease the background by extracting target molecules from the sample Citation[11]. Extractive methods range from those that extract whole classes of protein such as lectin affinity chromatography, to antibody-based methods that extract targeted proteins or peptides. In general, extractive techniques have higher sensitivities than subtractive techniques because they concentrate target molecules instead of diluting them, but at their most sensitive they are in direct competition with proteomics assays based on affinity molecules.
ELISA: the gold standard for protein detection
Affinity molecules bind to target substances that have complementary shapes and chemistries. Up until now antibodies have been the most widely used affinity molecules in proteomics. The equilibrium between antibody-binding sites and corresponding target sites can be expressed as:
Where [B] and [T] are the molarities of unoccupied antibody binding sites and unbound target sites, and [B:T] is the molarity of occupied binding sites. In Equation 1 ka and kd are the association and dissociation rate constants. The ratio of the association and dissociation rate constants is known as the equilibrium constant or affinity constant (Ka) of the antibody.
High-affinity antibodies either bind faster to the target substance (high ka) or remain bound to the target substance for longer (low kd), or have both of these properties. Proteomics assays based on antibodies (immunoassays) can be divided into two formats depending on whether the result is determined by measuring occupied or unoccupied binding sites Citation[12]. The former are called reagent-excess immunoassays and the latter reagent-limited immunoassays. Reagent-limited immunoassays are generally used to detect substances that are too small to accommodate more than one antibody-binding site. Competitive immunoassays are examples of reagent-limited immunoassays. Reagent-excess immunoassays are usually carried out with two antibodies that bind to distinct binding sites (epitopes) on the same target substance. Sandwich immunoassays are examples of reagent-excess immunoassays. Both formats can be carried out with an enzyme as the label, but when people refer to ELISA as the gold standard for sensitivity in proteomics assays they are talking about reagent-excess sandwich immunoassays. ELISA stands for enzyme-linked immunosorbent assay, but sandwich immunoassays with other labels such as lanthanide chelates Citation[13], acridinium esters Citation[14] and ruthenium chelates Citation[15] have similar sensitivities. These one-target-substance immunoassays are often carried out in 96- or 384-well multiwell plates. shows the main steps in a simple ELISA. In Step 1 the sample is incubated with capture antibodies immobilized in the well of the plate. In Step 2 the sample is removed and the well is washed. In Step 3 detector antibodies with an enzyme label are added to the well and a second incubation is carried out. In Step 4 unbound detector antibodies are removed and the well is washed. In Step 5 a substrate is added and a third incubation is carried out in which the enzyme catalyzes the conversion of the substrate to a detectable product as shown in Step 6. The amount of product is proportional to the amount of target substance in the original sample as shown in . Typically an ELISA takes from 1 to 2 h to complete and has a dynamic range of three orders of magnitude. Comparison between and illustrates the key difference between subtractive and extractive methods: in subtractive methods substances that are not the target substance are extracted from the sample while the target substances flow on towards the detector, but in extractive methods the target substance is extracted and the rest of the sample is discarded.
The sensitivities of antibody microarrays compared with ELISA
The word multiplexed has acquired a variety of meanings, but in this paper unless otherwise explained it means the detection of more than one target substance in the same undivided volume of sample. In the early days of multiplexed immunoassays it was widely believed that highly multiplexed (high content) assays would be developed by scaling up existing methods for single molecules. The most common way to multiplex immunoassays is to confine antibodies for different target substances to known locations in a rectilinear grid of micrometer-sized spots known as a microarray Citation[16–19]. The first antibody microarrays appeared at about the same time as DNA microarrays. Since then there has been significant progress in the development of DNA microarrays accompanied by considerable commercial success. Commercial DNA microarrays are now available for mutation analysis, expression analysis and SNP detection with annual sales amounting to several hundred million US dollars. Technological progress in the development of antibody microarrays has been more limited. The development of multiplexed sandwich immunoassays has been retarded by the cost of developing matched pairs of antibodies for distinct epitopes on the same target substance, which increases exponentially as the content of an assay increases. The cost of developing antibodies for single epitopes is much lower and therefore the majority of multiplexed immunoassays are based on one antibody per target substance. The two main formats for these single antibody immunoassays are antigen capture arrays , in which the sample is labeled and interrogated with arrays of antibodies, and reverse-phase arrays , in which arrays of immobilized peptides, antigens, proteins, cells or tissue samples are interrogated with labeled antibodies. In most cases multiplexed immunoassays are carried out on planar substrates, but they can also be carried out with suspension arrays of encoded particles Citation[20,21].
The analytical sensitivity of an assay is a measure of its ability to discriminate between different concentrations of the same substance, but often this definition is interpreted more narrowly to mean discrimination between a sample that does and does not contain the substance. This narrower interpretation is often referred to as the limit of detection (LOD) of an assay. More formally the LOD is defined is the concentration at which the target substance has a probability α of not being detected (negative result) Citation[22]. The most widely chosen value for α is 0.015, which corresponds to three-times the standard deviation (s) of the zero calibrator (a sample from which the target substance is known to be absent). If α has value of 0.015 the LOD can be determined graphically by horizontal projection of a point on the y-axis at m + 3 × s (where m is the mean response) of the zero calibrator until it intersects the best-fit dose–response line, followed by projection of the intersection point down onto the x-axis as shown in . The reliability of an LOD depends on the number of measurements that it is based on, and therefore the number of replicates (n) used to determine it should also be reported; a minimum of n = 6 is acceptable for the widely used confidence interval of 95%. In a rigorously developed sandwich immunoassay, the magnitude of s depends primarily on the amount of nonspecific binding and errors that accumulate as the assay is carried out. If the label is assumed to have infinite specific activity, and assumptions are made about the amount of nonspecific binding and the error, it is possible to estimate the LOD of reagent-excess immunoassays using Equation 3:
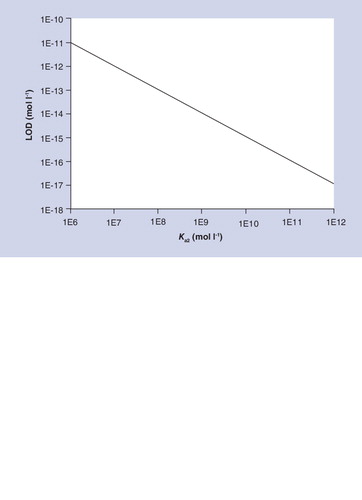
Where nonspecific background signal (NSB) is the amount of nonspecific binding as a fraction of the total concentration of labeled detector antibody, CV is the relative error (s/m) associated with the zero calibrator, and Ka2 is the equilibrium constant of the detector antibody or its equivalent Citation[23]. Notice how the NSB is a key determinant of sensitivity here as in MS. shows how the sensitivity of sandwich immunoassays depend on Ka2 if NSB and CV are assumed to have values of 0.001 and 0.01. Fractional nonspecific binding of 0.001 and a relative error of 0.01 are at the lower end of what can be achieved in practice, and good analytical grade monoclonal antibodies for proteins have Ka values that cluster around 1 × 10¹⁰. Therefore predicts that the sensitivities of sandwich immunoassays will cluster around a concentration of 1 × 10-15 mol/l. Much effort has been devoted to developing sandwich immunoassays for the hormone TSH because of its clinical importance. A review of commercially sourced immunoassays for TSH found sensitivities in the range 0.005–0.1 mIU/l Citation[24]. If human TSH is assumed to have an activity of 5 IU per mg and a MW of 28 kDa this corresponds to sensitivities in the range 35–714 × 10-15 mol/l. A broader survey of reported LODs for sandwich immunoassays shows that they cluster around a modal concentration of 50 × 10-15 mol/l, as shown in . These estimates of sensitivity apply to reagent-excess assays in which occupied binding sites are measured such as sandwich immunoassays. Affinity methods in which unoccupied binding sites are measured (such as competitive immunoassays) are less sensitive because they involve the detection of a small signal in the presence of a large background. Theoretical models have shown that the sensitivities of this type of assay can be estimated by multiplying the reciprocal of the affinity constant (Kd) by the relative error (i.e., CV × Kd) Citation[25]. Thus, the LOD of a competitive immunoassay with antibodies of Kd = 1 × 10⁻¹⁰ and CV = 0.01, would be 1 × 10-12 mol/l. In practice competitive immunoassays are mainly used to detect low MW molecules for which antibodies generally have Ka values that are lower than 1 × 10¹⁰ and therefore sensitivities are correspondingly lower.
It is often claimed that the LODs of antibody capture microarray immunoassays have sensitivities (comparable with ELISA) in the pM–fM range Citation[26–30], but there are no statistically robust results that support this claim. In one of the better studies antigen capture arrays were prepared by spotting single-chain antibody-binding sites for eight complement proteins onto black polymer microarray slides Citation[31]. The arrays were incubated with serum and plasma samples labeled with biotin and then with fluorescent streptavidin. Responses were determined by subtracting the local fluorescence from each spot to compensate for local variations in the background signal, and an internal control was used to normalize responses across different arrays. The two highest and lowest responses of each protein were excluded and LODs were based on the remaining four replicates (n = 4). LODs of the eight complement proteins (based on 2 × s of the zero calibrator) were in the range 0.35–530 pM (average LOD for eight target cytokines = 107 pM), which is more than three orders of magnitude less sensitive than ELISA, but more sensitive than MRM versions of MS. Equation 3 shows that a key determinant of sensitivity is the size of the background signal. In sandwich immunoassays the background signal is mainly due to nonspecifically bound label that depends on the concentration of labeled antibodies used (Step 3 of ). In antigen capture immunoassays all molecules in the sample are labeled and therefore all of them potentially contribute to nonspecific binding. Thus, NSB in Equation 3 is inevitably much higher for antigen capture immunoassays, and it is not surprising that they are less sensitive than ELISA and other well-designed sandwich immunoassays. Reverse-phase immunoassays are potentially more sensitive than antigen capture immunoassays because NSB depends on the concentration of labeled antibodies rather than all labeled molecules in the sample.
Molecular proofreading steps: the source of specificity
The analytical specificity of an antibody is a measure of how effectively it discriminates between a designated target substance and other substances that are present in the sample. Other substances that bind to the antibody are known as cross-reactants. Specificity depends on the relative concentrations of cross-reacting substances as well as affinity. High concentrations of a cross-reactant can distort the results obtained with an antibody for a low abundance target substance even though Ka for the target is much higher than the affinity constant (Kac) for the cross-reactant. Lack of specificity continues to be one of the main barriers preventing the development of multiplexed immunoassays. The individual steps in an immunoassay can be seen as a series of molecular proofreading steps that lead to a stepwise decrease in the error fraction (ratio of cross-reactant to target substance). The error fractions (f) at each step in a two-site immunoassay are shown in . The inset equations for f shown in are based on the following assumptions: equilibrium is attained in Steps 1 and 3; the durations of Steps 2 and 4 are t seconds; the concentration of the antibodies in Step 1 is less than (0.05/Ka); the concentrations of the target substance and cross-reacting substance in Step 1 are the same, and less than (0.001/Ka). The overall error fraction (ft) for the immunoassay is:
shows the values of f and ft at each step in the immunoassay if Ka = 1010, Kac = 108, kd = 10-5 s-1, kdc = 10-3s-1 and t = 300 s. Based on these values, the cumulative error fraction ft after four steps is two orders of magnitude less than ft after two steps. Calculations of this type show why two-step antigen capture immunoassays are less specific than four-step sandwich immunoassays.
In spite of their lower sensitivities and specificities, antigen capture immunoassays composed of hundreds of antibodies are widely used in research. A common application is biomarker discovery, which involves comparing results from healthy (control) and diseased (case) samples with arrays of antibodies Citation[32–36]. Typically, these arrays are prepared with commercially sourced antibodies for named target substances. Loch et al. used antigen capture arrays composed of 320 whole monoclonal and polyclonal antibodies to compare serum samples from ovarian cancer cases and controls Citation[36]. Some target substances were interrogated with more than one antibody. For example, the protein CA125 (a known biomarker of ovarian cancer) was interrogated with eight different antibodies that gave probability scores (p-values for the same cohort size) for not discriminating between cancer patients and controls ranging from 0.003 to 0.171 and false discovery rates (FDRs) from 0.214 to 0.433 (i.e., for every 100 assays the number of false positives varies between 21 and 43 depending on the choice of antibody). These wide variations show that results obtained with antigen capture arrays may depend as much on the choice of antibody as any real difference between the case and control. The use of antigen capture arrays is based on the assumption that antibodies are specific for a single target substance, but over a decade ago, it was found that only 20% of 115 arrayed antibodies yielded quantitatively correct results for their target substances Citation[37]. More recently, when the specificities of 11 commercially sourced antibodies were investigated with a reverse-phase array of yeast proteins it was found that five antibodies were specific for their target, five crossreacted with multiple antigens and one bound to more than 1000 different antigens Citation[38]. In another study in which six commercially sourced antibodies were interrogated with reverse-phase arrays of recombinant proteins, it was found that two antibodies were specific but four showed strong cross-reactivity with up to 12 other proteins Citation[39]. These results suggest that many individual antibodies are not specific enough to identify their designated target substance, and helps to explain why so few biomarker studies have been translated into clinical tests.
MS & affinity molecules combined: a solution to the sensitivity/specificity problem
One-way to increase the specificity of proteomics assays is to combine antigen capture with MS. This combination, known as stable isotope standards with capture by antipeptide antibodies (SISCAPA), was used by Whiteaker et al. to detect nine proteins in plasma as shown in Citation[40]. The sample (10 µl of plasma for each protein detected) was digested with trypsin and then one peptide from each target protein was captured with antibodies and magnetic beads. Peptides were chosen because they were unique to the target protein and performed well in MS, but not because they were good targets for antibodies. Peptides eluted from the antibodies were fractioned by LC and detected by MS using the MRM approach. Fifteen proteins were targeted at the outset, but six were later abandoned because of low (<7%) recoveries at the antibody capture stage. Specificities in the remaining assays were high because MS is used as a high fidelity proofreading step as well as for detection. Assays had a dynamic range of three to four orders of magnitude and the mean LOD (m + 3 × s) was 88 pM, which is similar to antigen capture immunoassays, but two to three orders of magnitude less than ELISA. LODs were lowered to 3 pM by extracting peptides from a larger volume (1 ml) of sample, but in many situations such large volumes of sample would not be available. Although LODs are comparable with antigen capture immunoassays, multiplexed versions of the latter have less complicated workflows and faster throughputs, and require much smaller sample volumes. Comparison of SISCAPA with ELISA suggested inaccuracies due to irreproducible recovery of peptides at the antigen capture stage, but this would probably be improved by a less complicated workflow. Combining the sensitivity of antibody capture and the specificity of MS might sound like a solution to the sensitivity/specificity problem, but an assay is only as good as its weakest link, and the weak link in SISCAPA is the sensitivity of MS. Progress in this area therefore will depend on improvements in the sensitivity of MS, but the three to four orders of magnitude gap that must be bridged to compete with the multiplexed assays based on affinity molecules that are described below is unlikely to be crossed in the near future.
The systematic generation of more affinity molecules
A common reason for using antigen capture immunoassays instead of sandwich immunoassays is that matched pairs of antibodies for different epitopes of the same target substance are not available. The need for a wider range of less expensive affinity reagents is the subject of several large development programs. The Human Protein Atlas Project has developed a gene-centered pipeline for the systematic generation and validation of affinity-purified polyclonal antibodies Citation[41,101]. The starting point for this pipeline is the identification in silico of 80–100 amino acid epitope tags that have low homology with other proteins. These tags are expressed as recombinant protein fragments and used to raise antibodies in rabbits. Antibodies are purified by affinity chromatography using the same epitope tag as the ligand and validated with reverse-phase microarrays of peptides. An antibody is regarded as validated if the majority of its binding is towards an antigen from the correct target. The aim is to produce at least two validated antibodies against nonoverlapping epitopes on the same protein. At the time of writing over 34,000 antibodies have been validated and new antibodies are being added at the rate of 492 per month, but these numbers are based on a very weak form of validation. In more exacting western blot validation only 531 out of 22,000 antibodies tested bound to a single band at the expected MW Citation[42]. Some additional bands may have been due to variants or complexes of the same protein, but this has not been demonstrated. All antibodies published in the Human Protein Atlas are commercially available, but to date none have been translated into validated diagnostic tests. Affinity Proteome is focused on the use of high-throughput in vitro selection methods as a means of increasing the range of available affinity reagents Citation[43,102]. Only a small part of a full-length antibody is involved in binding to the target molecule. This part can be expressed in vitro as a peptide associated with the DNA that codes for it, by methods such as phage and ribosomal display. Recombinant antibodies can then be identified by subjecting combinatorial libraries of peptides to iterative cycles of affinity capture and amplification of the DNA that codes for them. The process is faster (weeks compared with months) than methods used to produce antibodies in animals, and less expensive because it can be carried out in small volumes of solution that require less infrastructure. It is also possible to produce recombinant antibodies for targets that would be toxic to an animal host or fail to produce a response because of similarities to an animal’s own antigens. In vitro methods can also include conditions that improve discrimination for small alterations to a target molecule such as post-translational modifications, or curtail cross-reactivity for probable competitors Citation[44,45]. In some cases in vitro selection has been used to increase the Ka values of recombinant antibodies beyond the approximately 1010 ceiling imposed in vivo Citation[46,47], but increasing the affinity does not necessarily increase the specificity. Most recombinant antibodies have affinities that are comparable with antibodies produced in animals.
Genotyping assays that are specific because they include more proofreading steps
Lack of specificity is not confined to assays based on antibodies. Its effect on nucleic acid assays is most apparent in the detection of single nucleotide polymorphisms (SNPs) where it is necessary to discriminate between sequences that only differ by a single base Citation[48]. The well-defined chemistry of nucleic acids has permitted this problem to be overcome by hybridization of target sequences to arrays of immobilized oligonucleotide probes under stringent conditions, but each SNP must be interrogated with multiple probes in order to discriminate between perfectly matched and mismatched hybridizations. Each SNP identified by an Affymetrix genotyping array, for example, is interrogated with 40 different probes Citation[49]. One block of four probes consists of the probe that is a perfect match for the SNP and three probes that are identical to the perfect match except for a different base at the locus of the SNP; these bases are positioned in the middle of the probe sequence. Two more blocks of eight probes have all four of these bases shifted ±one and ±four bases from the middle of the sequence. A fourth block of 20 probes consists of antisense versions of the other 20 probes. SNPs are identified by subtracting the response of cross-reacting probes from the more intense signal produced by the perfect match. The chemistry of proteins is more diverse than nucleic acids and therefore the equivalent of a genotyping array cannot be produced with antibodies, but SNPs can also be detected by performing a series of proofreading steps instead of interrogating them with multiple probes. In the golden gate assay Citation[50], genomic DNA is activated with biotin and attached to streptavidin magnetic beads. In Step 1 of the assay the beads are incubated with allele-specific probes (ASPs) that hybridize to the genomic target sequence with their 3′-terminal base matched to the location of the SNP, and locus-specific probes (LSPs) that hybridize upstream of the ASPs as shown in . In Step 2 stringent washing of the beads dissociates incorrectly hybridized probes, and in Step 3 ASPs are extended by a polymerase enzyme that is highly sensitive to mismatches at the locus of the SNP. In Step 4 extended ASPs are linked to LSPs with a DNA ligase and in Step 5 linked probes are amplified using universal PCR sites in the ASPs and LSPs. In Step 6 PCR products are hybridized to an array of oligonucleotides complementary to address sequences in the LSPs. The first three steps of the assay contain five proofreading steps. The cumulative attenuation of the error fraction in these proofreading steps allows SNPs to be identified without using large numbers of probes. The first four proofreading steps are comparable with the proofreading steps in sandwich immunoassays as shown in , but there is no equivalent of the fifth proofreading primer-extension step. These proofreading steps resemble the steps in kinetic proofreading schemes that confer high specificity on many biological reactions Citation[51]. In these schemes the overall error fraction is progressively attenuated by widening the gap between the free-energy change of the desired outcome and that of nonspecific side reactions. The observation that biological systems resort to such schemes whenever there is a requirement for high specificity suggests that the specificity of proteomics assays based on affinity molecules could also be enhanced by increasing the number and/or stringency of proofreading steps.
Improving the specificity of affinity proteomics by adding more proofreading steps
One-way to add additional proofreading steps to immunoassays is to combine them with one of the fractionation techniques that are used with MS Citation[52]. Wu et al. used size-exclusion chromatography to resolve a biotin-labeled cell lysate into 20 fractions from 10 to 670 kDa. Each fraction was incubated with 300 antibodies conjugated to encoded microbeads, and then antigens bound to washed beads were labeled with fluorescent streptavidin and detected by flow cytometry. The authors say that some proteins were detectable in samples that contained only a few thousand cells, but in the absence of an LOD it is not possible to compare the sensitivity with other methods. Specificity would certainly be increased provided that cross-reacting substances are not eluted in the same fraction as the target substance, but sensitivity would probably decrease as the number of fractions increased due to dilution of the sample. The most well known example of additional proofreading steps in immunoassays is proximity ligation Citation[53,54]. In proximity ligation immunoassays (PLAs) antibodies are conjugated to an oligonucleotide proximity probe that consists of a unique identifier sequence proximal to the antibody and a common ligation sequence. When a molecule is sandwiched between two antibodies, the probes are brought into close proximity where hybridization to a connector oligonucleotide is thermodynamically favored. In one multiplexed version the antibody-binding reactions are carried out in solution, but overnight incubation at low temperature is used to promote the most thermodynamically favored hybridizations. The probes are then joined by enzymatic ligation to form a reporter sequence, which is amplified and detected by qPCR. This has allowed sensitive multiplexed sandwich immunoassays for 24 proteins to be carried out without the need for extensive antibody selection and optimization Citation[55]. The main disadvantage of this separation-free version of PLA is that the concentrations of proximity probes must be low in order to avoid nonspecific ligations and therefore assays have a short dynamic range Citation[56]. This limitation can be overcome by using separation and washing steps as shown in , which allow additional proofreading steps to be carried out Citation[57]. The mean LOD (m + 2 × s) of this version of PLA is 10 fM, which is comparable with ELISA at its best, and the dynamic range of five to six orders of magnitude is better. In the example shown in specificity is further enhanced by using two detector antibodies. There is also an in situ version of PLA for individual proteins and protein–protein complexes in cells and tissues, where ligation leads to the formation of a circular template that is detected by localized rolling circle amplification Citation[58].
The first report of PLA was partly based on two DNA aptamers that bind to different epitopes of thrombin Citation[59]. Aptamers are single-stranded nucleic acids that have recognition properties comparable with antibodies because they can fold into complex 3D shapes that specifically bind to a broad spectrum of target entities Citation[60,61]. They are obtained by screening combinatorial libraries of 1012–1016 oligonucleotides for motifs that bind to a chosen target molecule. The screening process, known as systematic evolution of ligands by exponential enrichment (SELEX), consists of repeated cycles of in vitro selection and PCR amplification. In the selection step, single-stranded oligonucleotides compete for epitopes on the target substance, and in the amplification step the pool of oligonucleotides is enriched with sequences that bind. The enriched pool is then fed into the next cycle of selection and amplification. Typically, five to 20 cycles are carried out and then aptamers in the remaining pool are identified by cloning and sequencing. In spite of their many advantages, aptamers have not been widely used in proteomics assays because in general they have lower affinities (and hence lower sensitivities) than antibodies, as shown in . Another problem is that for most proteins all aptamers that have been identified bind to the same epitope and therefore the additional proofreading steps that are possible in sandwich assays are not accessible Citation[62]. One advantage of proofreading models such as the one shown in is that they reveal which steps are most amenable to improvement. The simulated values in suggest that dissociation steps (Steps 2 and 4) are less effective than binding steps (Steps 1 and 4) at attenuating the error fraction. Recently Gold et al. have introduced a new class of aptamers known as slow off-rate modified aptamers (SOMAmers) that are selected for their slow dissociation rates (low kd values) from the target molecules Citation[63,64]. This allows the washing step in an affinity assay to be carried out under more stringent conditions that lead to preferential dissociation of nonspecifically bound aptamers. This compensates for the additional proofreading steps that would be provided by a second aptamer. Multiplexed assays based on SOMAmers with a mean LOD of 300 fM (m + 3.2 × s) and a dynamic range seven orders of magnitude have been used to identify biomarkers for various medical conditions including lung cancer and chronic kidney disease Citation[63,65].
Current status of proteomics assays & future directions
As the title of this article suggests, there is a need for proteomics assays that combine sensitivity and specificity. Assays based on MS and antigen capture (SISCAPA) are highly specific, but they are not sensitive enough to detect most low abundance proteins. Sandwich immunoassays are sensitive enough to detect many of these proteins, but multiplexed assays are confined to high-value target substances due to the high cost of identifying matched pairs of antibodies that are specific enough for use in these assays. One solution to the sensitivity/specificity problem would be to increase the sensitivity of SISCAPA, but the sensitivity gap is large, and even if it could be bridged it is hard to see how MS-based assays could ever be deployed in venues other than well-resourced laboratories. As the aims of proteomics assays shift from discovery to health and wellness the need for inexpensive proteomics assays that can be deployed in resource-limited venues will increase Citation[66]. The other solution to the sensitivity/specificity problem would be to find ways of increasing the specificity of multiplexed affinity-based assays without incurring high development costs. Multiplexed assays based on antibodies can be deployed in resource-limited venues Citation[67,68], but for most target substances the antibodies required to make these work are not available. Several programs are expanding the range of available affinity reagents, but most of the cost incurred when developing multiplexed immunoassays stems from selecting antibodies that do not cross-react rather than the generation of antibodies per se. Thus, an expanded range of affinity reagents will only lead to progress in proteomics if less expensive ways of incorporating them into multiplexed assays can be developed. PLA is an important advance in this direction because it lowers the cost of incorporating antibodies into multiplexed assays, but it requires matched pairs or even matched triplets of antibodies Citation[57]. PLA was originally demonstrated with aptamers Citation[59], but further work with these affinity reagents was precluded because only one authenticated matched pair of aptamers (for thrombin) has so far been discovered Citation[62]. This is unfortunate because the combination of PLA with aptamers is easier to implement than with antibodies and has much higher proofreading potential. DNA aptamers belong to a group of molecules that are less expensive alternatives to antibodies. These alternatives include peptide aptamers isolated by phage and ribosomal display technologies Citation[69], but DNA aptamers stand out as the simplest and most economic to produce. One reason why Gold et al. have succeeded in developing the highly multiplexed assays described above is that their SOMAmers have amino acid-like functional groups Citation[63,70]. This chemistry was developed by Eaton et al. Citation[71], and forms part of an approach that is advancing in the direction of hybrid molecules that resemble peptides that are compatible with enzymatic amplification Citation[72]. One suggestion of why only one matched pair of aptamers has been discovered is that matched pairs are generally precluded by the low chemical diversity of PCR-amplifiable nucleotides compared with antibody-binding sites based on amino acids Citation[71,73]. The introduction of more diverse nucleotide chemistries that are compatible with PCR opens up new design-space that should make it easier to identify matched pairs of aptamers for proteins other than thrombin. These would be compatible with multiplexed protein assays incorporating advanced proofreading steps based on the tools of molecular biology Citation[74]. Multiplexed proteomics based on peptide-like nucleic acid aptamers and more proofreading steps would be very different to the prevailing consensus, but it is hoped that by highlighting the problems embedded in existing proteomics assays that this review will provide the impetus for further advances in this direction.
Expert commentary & five-year view
There is a need for sensitive and specific proteomics assays that is not being met by MS or traditional microarrays of antibodies. MS is not sensitive enough and traditional antibody microarrays are either not specific enough or not cost-effective to develop. The gap between the desired sensitivities of proteomics assays and the actual sensitivities of assays based on MS is so wide that it is unlikely to be bridged in the next 5 years, but the specificities of assays based on affinity molecules can be improved by better proofreading without incurring high development costs. Two developments in particular have demonstrated the advantages of improved proofreading: antibodies with proximity ligation, and SOMAmers. Each approach has its own particular advantages. During the next 5 years it is anticipated that proteomics assays that combine these advantages will begin to emerge.
Table 1. Error fractions (f) and cumulative error fractions (ft) at each step in a simple sandwich immunoassay based on Ka = 1010, Kac = 108, kd = 10-5 s, kdc = 10-3 s-1 and t = 300 s.
Key issues
• Proteomics assays must be sensitive and specific enough to quantify multiple proteins in the presence of other proteins that may be present at much higher concentrations.
• Proteomics assays based on mass spectrometry are not sensitive enough.
• Proteomics assays based on antibody capture are neither specific enough nor sensitive enough.
• The development cost of multiplexed sandwich immunoassays is too high for most applications.
• Proteomics assays that combine affinity molecules and mass spectrometry are not sensitive enough.
• The source of high specificity in living systems and genomics assays is molecular proofreading.
• Proteomics assays based on affinity molecules that include additional proofreading steps have the best combination of sensitivity and specificity, and the most potential for future development.
Financial & competing interests disclosure
Financial support for this work was provided by the UK Biotechnology and Biological Sciences Research Council (BBSRC) Grant Number BB/1013245/1. The author has no other relevant affiliations or financial involvement with any organization or entity with a financial interest in or financial conflict with the subject matter or materials discussed in the manuscript apart from those disclosed.
No writing assistance was utilized in the production of this manuscript.
References
- Anderson NL, Anderson NG. The human plasma proteome: history, character, and diagnostic prospects. Mol. Cell Proteomics 1(11), 845–867 (2002).
- Anderson NL, Polanski M, Pieper R et al. The human plasma proteome: a nonredundant list developed by combination of four separate sources. Mol. Cell Proteomics 3(4), 311–326 (2004).
- Sachdeva N, Asthana D. Cytokine quantitation: technologies and applications. Front Bio. Sci. 12, 4682–4695 (2007).
- Huang RP, Burkholder B, Jones VS et al. Cytokine antibody arrays in biomarker discovery and validation. Curr. Proteomics 9, 55–70 (2012).
- Saah AJ, Hoover DR. ‘Sensitivity’ and ‘specificity’ reconsidered: the meaning of these terms in analytical and diagnostic settings. Ann. Intern. Med. 126(1), 91–94 (1997).
- Pan S, Aebersold R, Chen R et al. Mass spectrometry based targeted protein quantification: methods and applications. J. Proteome Res. 8, 787–797 (2009).
- Mallick P, Kuster B. Proteomics: a pragmatic perspective. Nat. Biotechnol. 28, 695–709 (2010).
- Angel TE, Aryal UK, Hengel SM et al. Mass spectrometry-based proteomics: existing capabilities and future directions. Chem. Soc. Revs. 41, 39123928 (2012).
- Issaq HJ. The role of separation science in proteomics research. Electrophoresis 22, 3629–3638 (2001).
- Shi T, Fillmoreb TL, Sun X et al. Antibody-free, targeted mass-spectrometric approach for quantification of proteins at low picogram per milliliter levels in human plasma/serum. Proc. Natl Acad. Sci. USA 109, 15395–15400 (2012).
- Fang X, Zhang WW. Affinity separation and enrichment methods in proteomic analysis. J. Proteomics 71(3), 284–303 (2008).
- Ekins R. The future development of immunoassays. In: Radioimmunoassay and Related Procedures in Medicine (Volume 1). International Atomic Energy Agency, Vienna, Austria, 241–268 (1977).
- Hagan AK, Zuchner T. Lanthanide-based time-resolved luminescence immunoassays. Anal. Bioanal. Chem. 400, 2847–2864 (2011).
- Natrajan A, Sharpe D, Costello J et al. Enhanced immunoassay sensitivity using chemiluminescent acridinium esters with increased light output. Anal. Biochem. 406, 204–213 (2010).
- Sánchez-Carbayo M, Mauri M, Alfayate R, Miralles C, Soria F. Analytical and clinical evaluation of TSH and thyroid hormones by electrochemiluminescent immunoassays. Clin. Biochem. 32(6), 395–403 (1999).
- MacBeath G. Protein microarrays and proteomics. Nat. Genet. 32(Suppl.), 526–532 (2002).
- Angenendt P. Progress in protein and antibody microarray technology. Drug Discov. Today 10(7), 503–511 (2005).
- Kingsmore SF. Multiplexed protein measurement: technologies and applications of protein and antibody arrays. Nat. Rev. Drug Discov. 5(4), 310–320 (2006).
- Chandra H, Reddy PJ, Srivastava S. Protein microarrays and novel detection platforms. Expert Rev. Proteomic 8, 61–79 (2011).
- Wilson R, Cossins AR, Spiller DG. Encoded microcarriers for high-throughput multiplexed detection. Angew. Chemie Int. Edit. 45, 6104–6117 (2006).
- Krishhan W, Khan IH, Luciw PA. Multiplexed microbead immunoassays by flow cytometry for molecular profiling: basic concepts and proteomics applications. Crit. Rev. Biotechnol. 29, 29–43 (2009).
- Huber W. Basic calculations about the limit of detection and its optimal determination. Accredit. Qual. Assur. 8, 213–217 (2003).
- Jackson TM, Ekins RP. Theoretical limitations on immunoassay sensitivity. Current practice and potential advantages of fluorescent Eu3+ chelates as non-radioisotopic tracers. J. Immunol. Methods 87(1), 13–20 (1986).
- McConway MG, Chapman RS, Beastall GH et al. How sensitive are immunoassays for thyrotropin. Clin. Chem. 35, 289–291 (1989).
- Ekins RP. Immunoassay design and optimization. In: Principles and Practice of Immunoassay. Price CP, Newman DJ (Eds). Macmillan, London, UK, 175–207 (1997).
- Wingren C, Borrebaeck CA. Antibody microarray analysis of directly labelled complex proteomes. Curr. Opin. Biotechnol. 19(1), 55–61 (2008).
- Borrebaeck CA, Wingren C. Design of high-density antibody microarrays for disease proteomics: key technological issues. J. Proteomics 72(6), 928–935 (2009).
- Borrebaeck CA, Wingren C. High-throughput proteomics using antibody microarrays: an update. Expert Rev. Mol. Diagn. 7(5), 673–686 (2007).
- Kusnezow W, Syagailo YV, Goychuk I et al. Antibody microarrays: the crucial impact of mass transport on assay kinetics and sensitivity. Expert Rev. Mol. Diagn. 6, 111–124 (2006).
- Wingren C, Ingvarsson J, Dexlin L, Szul D, Borrebaeck CA. Design of recombinant antibody microarrays for complex proteome analysis: choice of sample labeling-tag and solid support. Proteomics 7(17), 3055–3065 (2007).
- Ingvarsson J, Larsson A, Sjöholm AG et al. Design of recombinant antibody microarrays for serum protein profiling: targeting of complement proteins. J. Proteome Res. 6(9), 3527–3536 (2007).
- Gao WM, Kuick R, Orchekowski RP et al. Distinctive serum protein profiles involving abundant proteins in lung cancer patients based upon antibody microarray analysis. BMC Cancer 5, 110 (2005).
- Orchekowski R, Hamelinck D, Li L et al. Antibody microarray profiling reveals individual and combined serum proteins associated with pancreatic cancer. Cancer Res. 65(23), 11193–11202 (2005).
- Sanchez-Carbayo M, Socci ND, Lozano JJ, Haab BB, Cordon-Cardo C. Profiling bladder cancer using targeted antibody arrays. Am. J. Pathol. 168(1), 93–103 (2006).
- Shafer MW, Mangold L, Partin AW, Haab BB. Antibody array profiling reveals serum TSP-1 as a marker to distinguish benign from malignant prostatic disease. Prostate 67(3), 255–267 (2007).
- Loch CM, Ramirez AB, Liu Y et al. Use of high density antibody arrays to validate and discover cancer serum biomarkers. Mol. Oncol. 1(3), 313–320 (2007).
- Haab BB, Dunham MJ, Brown PO. Protein microarrays for highly parallel detection and quantitation of specific proteins and antibodies in complex solutions. Genome Biol. 2(2), RESEARCH0004 (2001).
- Michaud GA, Salcius M, Zhou F et al. Analyzing antibody specificity with whole proteome microarrays. Nat. Biotechnol. 21(12), 1509–1512 (2003).
- Kijanka G, Ipcho S, Baars S et al. Rapid characterization of binding specificity and cross-reactivity of antibodies using recombinant human protein arrays. J. Immunol. Methods 340(2), 132–137 (2009).
- Whiteaker JR, Zhao L, Anderson L, Paulovich AG. An automated and multiplexed method for high throughput peptide immunoaffinity enrichment and multiple reaction monitoring mass spectrometry-based quantification of protein biomarkers. Mol. Cell Proteomics 9(1), 184–196 (2010).
- Pontén F, Schwenk JM, Asplund A, Edqvist PH. The Human Protein Atlas as a proteomic resource for biomarker discovery. J. Intern. Med. 270(5), 428–446 (2011).
- Schwenk JM, Igel U, Neiman M et al. Toward next generation plasma profiling via heat-induced epitope retrieval and array-based assays. Mol. Cell Proteomics 9(11), 2497–2507 (2010).
- Dübel S, Stoevesandt O, Taussig MJ, Hust M. Generating recombinant antibodies to the complete human proteome. Trends Biotechnol. 28(7), 333–339 (2010).
- Bradbury AR, Sidhu S, Dübel S, McCafferty J. Beyond natural antibodies: the power of in vitro display technologies. Nat. Biotechnol. 29(3), 245–254 (2011).
- Levin AM, Weiss GA. Optimizing the affinity and specificity of proteins with molecular display. Mol. Biosyst. 2(1), 49–57 (2006).
- Altshuler EP, Serebryanaya DV, Katrukha AG. Generation of recombinant antibodies and means for increasing their affinity. Biochemistry Mosc. 75(13), 1584–1605 (2010).
- Markus V, Janne L, Urpo L. Directed antibody-engineering techniques and their applications in food immunoassays. Trac. Trend Anal. Chem. 30, 219–226 (2011).
- Ragoussis J. Genotyping technologies for genetic research. Annu. Rev. Genomics Hum. Genet. 10, 117–133 (2009).
- LaFratta CN, Walt DR. Very high density sensing arrays. Chem. Rev. 108(2), 614–637 (2008).
- Shen R, Fan JB, Campbell D et al. High-throughput SNP genotyping on universal bead arrays. Mutat. Res. 573(1–2), 70–82 (2005).
- Hopfield JJ. Kinetic proofreading: a new mechanism for reducing errors in biosynthetic processes requiring high specificity. Proc. Natl Acad. Sci. USA 71(10), 4135–4139 (1974).
- Wu WW, Slastad H, Carillo DD et al. Antibody array analysis with label-based detection and resolution of protein size. Mol. Cell. Proteomics 8, 245–257 (2009).
- Weibrecht I, Leuchowius KJ, Clausson CM et al. Proximity ligation assays: a recent addition to the proteomics toolbox. Expert Rev. Proteomics 7(3), 401–409 (2010).
- Landegren U, Vänelid J, Hammond M et al. Opportunities for sensitive plasma proteome analysis. Anal. Chem. 84(4), 1824–1830 (2012).
- Lundberg M, Thorsen SB, Assarsson E et al. Multiplexed homogeneous proximity ligation assays for high-throughput protein biomarker research in serological material. Mol. Cell. Proteomics 10, 004978 (2011).
- Kim J, Hu J, Sollie RS, Easley CJ. Improvement of sensitivity and dynamic range in proximity ligation assays by asymmetric connector hybridization. Anal. Chem. 82(16), 6976–6982 (2010).
- Darmanis S, Nong RY, Hammond M et al. Sensitive plasma protein analysis by microparticle-based proximity ligation assays. Mol. Cell Proteomics 9(2), 327–335 (2010).
- Söderberg O, Leuchowius KJ, Gullberg M et al. Characterizing proteins and their interactions in cells and tissues using the in situ proximity ligation assay. Methods 45(3), 227–232 (2008).
- Fredriksson S, Gullberg M, Jarvius J et al. Protein detection using proximity-dependent DNA ligation assays. Nat. Biotechnol. 20(5), 473–477 (2002).
- Stoltenburg R, Reinemann C, Strehlitz B. SELEX – a (r)evolutionary method to generate high-affinity nucleic acid ligands. Biomol. Eng. 24(4), 381–403 (2007).
- Song KM, Lee S, Ban C. Aptamers and their biological applications. Sensors (Basel) 12(1), 612–631 (2012).
- Wilson R, Cossins A, Nicolau DV, Missailidis S. The selection of DNA aptamers for two different epitopes of thrombin was not due to different partitioning methods. Nucleic Acid Ther. 23(1), 88–92 (2013).
- Gold L, Ayers D, Bertino J et al. Aptamer-based multiplexed proteomic technology for biomarker discovery. PLoS ONE 5(12), e15004 (2010).
- Wilson R. High-content aptamer-based proteomics. J. Proteomics 74(10), 1852–1854 (2011).
- Mehan MR, Ayers D, Thirstrup D et al. Protein signature of lung cancer tissues. PLoS ONE 7(4), e35157 (2012).
- Editors Profile. Lee Hood. Nat. Biotechnol. 29, 191 (2011).
- Fan R, Vermesh O, Srivastava A et al. Integrated barcode chips for rapid, multiplexed analysis of proteins in microliter quantities of blood. Nat. Biotechnol. 26(12), 1373–1378 (2008).
- Gervais L, de Rooij N, Delamarche E. Microfluidic chips for point-of-care immunodiagnostics. Adv. Mater. Weinheim 23(24), H151–H176 (2011).
- Ruigrok VJ, Levisson M, Eppink MH, Smidt H, van der Oost J. Alternative affinity tools: more attractive than antibodies? Biochem. J. 436(1), 1–13 (2011).
- Gold L, Walker JJ, Wilcox SK, Williams S. Advances in human proteomics at high scale with the SOMAscan proteomics platform. N. Biotechnol. 29(5), 543–549 (2012).
- Vaught JD, Bock C, Carter J et al. Expanding the chemistry of DNA for in vitro selection. J. Am. Chem. Soc. 132(12), 4141–4151 (2010).
- Pinheiro VB, Holliger P. The XNA world: progress towards replication and evolution of synthetic genetic polymers. Curr. Opin. Chem. Biol. 16(3–4), 245–252 (2012).
- Eaton BE. The joys of in vitro selection: chemically dressing oligonucleotides to satiate protein targets. Curr. Opin. Chem. Biol. 1(1), 10–16 (1997).
- Nong RY, Gu J, Darmanis S, Kamali-Moghaddam M, Landegren U. DNA-assisted protein detection technologies. Expert Rev. Proteomics 9(1), 21–32 (2012).
- Müller UR. Protein detection using biobarcodes. Mol. Biosyst. 2(10), 470–476 (2006).
Websites
- The Human Protein Atlas Project. www.proteinatlas.org/about/project
- Affinity Proteome. www.proteomebinders.org/apframestarthome.html