Abstract
Gene-expression profiling has been successfully applied in various diagnostic applications, but its full capacity is yet to be realized. Samples are generally prepared from a mixture of different cells that are present in unknown proportions. Cells are, in many aspects, unique in their characteristics and this heterogeneity confounds the expression profile. The development of new and robust techniques to measure gene expression in single cells opens new avenues in molecular medicine. Today, gene-expression profiles of individual cells can be measured with high precision and accuracy, identifying different cell types as well as revealing heterogeneity among cells of the same kind. Here, we review practical aspects of single-cell gene-expression profiling using reverse transcription quantitative real-time PCR and its potential use in diagnostics.
Relative expression of fusion transcript FUSDDIT3 in 88 single myxoid/round cell liposarcoma cells (A). Distribution of FUSDDIT3 in linear (B) and log10(C) scales.
Data taken from [Ståhlberg A et al., Unpublished Data].
![Figure 2. Single-cell gene-expression data.Relative expression of fusion transcript FUSDDIT3 in 88 single myxoid/round cell liposarcoma cells (A). Distribution of FUSDDIT3 in linear (B) and log10(C) scales.Data taken from [Ståhlberg A et al., Unpublished Data].](/cms/asset/4315f7fe-c9b2-49c5-bcc7-bfa5566f5519/iero_a_11214423_f0002_b.jpg)
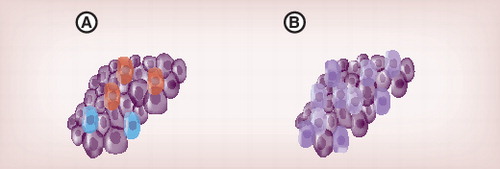
Single-cell analysis allows identification and characterization of different cell types (A) and studies of heterogeneity within respective cell types (B).
Single-cell gene-expression profiling
Gene expression-based diagnostics are normally performed on large amount of RNA extracted from tissue, blood or cell suspensions. Carefully optimized assays for gene-expression profiling are generally robust and rarely fail when large quantities of transcripts are available. However, there is also a strong need to analyze small biopsies, and a small number of transcripts is technically more challenging to handle and difficult to quantify accurately. Minimal invasive sample collection minimizes patient trauma and is more suitable for repetitive sampling. Single-cell diagnostics offers a means to identify and characterize different cell types in samples and to also reveal heterogeneity between cells of the same type. Furthermore, high-throughput single-cell analysis allows identification of rare cells that are of diagnostic importance, such as cancer stem cells and circulating tumor cells. In this article, we discuss aspects of single-cell gene-expression profiling using reverse transcription quantitative real-time PCR (RT-qPCR) and its potential use in diagnostic applications, in particular for tumor diagnostics.
Cells are individual and unique units that can work both independently and together in tissues and organs. Organisms, organs and cells respond to stimuli by activating and silencing specific genes. Furthermore, individual cells, even cells generated from the same genetic clone, respond with distinct gene-expression profiles to identical stimuli Citation[1,2]. Single-cell heterogeneity has been recognized since the 1950s Citation[3]. However, technical limitations related to analyzing few molecules were first overcome in the last decade Citation[1,4–6]. Different approaches have been used to quantify the number of specific transcripts in single cells: qPCR Citation[6–8], microarrays Citation[9,10], the MS2 system Citation[11,12], in situ padlock probes followed by rolling-circle amplification Citation[13], next-generation sequencing Citation[14] and FISH Citation[5,15,16]. The MS2 system requires cloning, but offers the means to monitor the transcript levels over time in live cells Citation[11,12]. All other methods, except FISH, require a cDNA synthesis step followed by preamplification. FISH allows transcripts to be quantified directly. One drawback of FISH is that only a few genes can be analyzed at the same time, owing to spectral overlap of classical fluorophores. The use of multiple fluorophores arranged in barcodes can solve the multiplex problem Citation[17,18]. Next-generation sequencing, compared with microarrays and qPCR, allows unknown RNA molecules to be identified and quantified. Here, we focus on the use of RT-qPCR to measure gene expression in single cells. RT-qPCR is commonly used to analyze from one up to 100 different transcripts, and preamplification can be avoided if only a few genes are analyzed. RT-qPCR is characterized by large dynamic range, excellent reproducibility and sufficient sensitivity to detect a single transcript Citation[6–8,19,20]. High-throughput systems, such as the BioMark™ (Fluidigm) and the OpenArray® (Applied Biosystems) platforms, are preferred if many different transcripts and samples are to be analyzed. These systems can, in parallel, measure 96 samples each for 96 genes and 48 samples each for 64 genes, respectively.
Technical aspects of single-cell gene-expression profiling using RT-qPCR
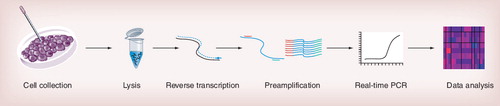
Single-cell gene-expression profiling based on RT-qPCR includes several sequential experimental steps . To achieve reproducible and reliable single-cell gene-expression data, each experimental step must be carefully optimized and validated to minimize transcript losses.
The initial cell collection is the experimental step that is most different compared with protocols based on traditional samples. Single cells can be collected by three main methods: microaspiration Citation[6,8,20–22], flow cytometry Citation[7,19,23] and laser capture microdissection Citation[24,25]. Many variants and protocols have been developed for various applications. One factor to consider when collecting individual cells is bias caused by the collection process. Flow cytometry and sometimes microaspiration require cells to be dissociated into single-cells before collection, which may affect the gene-expression profile measured. Microdissection followed by laser capture can be applied directly on tissues. Hence, the origin and morphology of the cells collected are known. This typically requires tissue fixation. Collection of fixed cells will not be affected by the collection method itself, but cell fixation will result in unwanted RNA losses and degradation, and generally require additional extraction steps. By contrast, flow cytometry and microaspiration are most often applied to collect living cells.
Classical samples with high numbers of cells must be extracted to generate pure RNA without inhibitors for successful measurements. In single-cell analysis, because of RNA losses, standard extraction protocols are not suitable. Instead, purification-free protocols have been developed. Several lysis options are available, including CelluLyser (TATAA Biocenter), Real-time Ready Cell Lysis (Roche Diagnostics), Single Cell-to-CT™ (Life Technologies) and noncommercial lysis buffers Citation[20]. Efficient lysis should disrupt cell membranes, make RNA accessible for reverse transcriptase, maintain RNA integrity and be compatible with RT, preamplification and qPCR. Our unpublished data indicate that different cell types require somewhat different lysis condition for efficient lysis [Ståhlberg A et al., Unpublished Data]. For example, primary pancreatic β-cells were most efficiently lyzed using guanidine thiocyanate, while primary astrocytes could be equally efficiently lysed with water.
Quantitative real-time PCR should, when possible, be performed and reported according to the Minimum Information for Publication of Quantitative Real-Time PCR Experiments guidelines Citation[26]. In single-cell studies, it is important to have high RT efficiency, converting as many target transcripts as possible to cDNA. RT is sequence dependent and the efficiency depends on RNA secondary and tertiary structures, reverse transcriptase, priming strategy and additives Citation[27,28]. qPCR assays optimized for single-cell analysis must have high sensitivity and maintain target specificity for up to 50 cycless of amplification without generating any nonspecific PCR products, such as primer dimers. Gene expression measurements on single-cell level that yield no signal/readout cannot be considered experimental failures. The lack of a specific PCR product reflects that the number of transcripts in that particular cell is between zero and the level of detection of the assay. The level of detection of optimized qPCR assays are often only a few cDNA molecules in a confined system, but the level of detection at RNA level is usually not known. To determine the level of detection of RT-qPCR assays, the corresponding full-length mRNA molecules should be generated and quantified by another method, allowing evaluation of RT-qPCR specificity and sensitivity Citation[28]. Unless this is performed, claims cannot be made stating that a specific transcript is not expressed at all in defined cells based on negative RT-qPCR measurements.
Analyses of many genes require preamplification. The number of different transcripts that can be measured without preamplification depends on absolute transcript levels and the number of cells analyzed. Expression of more genes can be measured if the total number of cells analyzed is high. Ten genes expressed at high or intermediate levels measured in some 100 individual cells have been shown to be sufficient to identify cell subpopulations without the need of preamplification Citation[19]. In general, preamplification should be used restrictively, since it is an additional experimental step that contributes confounding noise and may introduce bias to generated data. Preamplification can be either specific or global using either linear Citation[29] or exponential Citation[30] amplification. The most common strategy for single-cell RT-qPCR is to amplify cDNA by multiplex PCR using specific primers that are identical to those used in the qPCR assays, but at substantially lower concentrations. The preamplification PCR step is performed in a limited number of cycles to avoid competition for reagents among parallel reactions. However, the amplification efficiency is usually lower during preamplification compared with the downstream qPCR. For further information on preamplication methods, see Citation[31–34].
Gene expression in eukaryotic cells is in part a stochastic process and transcription occurs in bursts, which result in transcript variability between individual cells, even of the same kind Citation[35,36]. Consequently, no gene can be used as reference to normalize expression in single cells, which is common for samples generated from large number of cells. The intuitive way to present expression data measured on single cells are per cell . Possible limitations of normalizing per unit are that variations in lysis efficiency, RNA degradation and RT yield are not considered. The use of an RNA molecule with an unique sequence that do not exist in the species studied, that is, alien RNA spike, added to the lysis buffer can partially account for these effects Citation[20]. However, an exogenous RNA spike may not behave as endogenous RNA, since the latter is RNA that is initially affected by the local environment within the cell before cell lysis is completed. It is better to inject the RNA spike into the cell in known quantity, but this is technically challenging. If many genes are analyzed, a global normalization strategy, similar to microarray normalization, could possibly be applied. Another option is to normalize with transcripts containing repetitive sequences, such as expressed Alu repeats. The drawback of measuring Alu repeats is that such assays are very sensitive to contamination Citation[37]. The increasing number of single-cell gene-expression profiling studies, will provide further insights into advantages and limitations of different normalization strategies.
Another aspect to consider when dealing with single-cell data is that the distributions of transcripts are heavily skewed . Most distributions show lognormal features Citation[5–7,19]. The median cell is best represented by the geometric mean if transcripts are lognormally distributed. Single-cell data can be analyzed with several different approaches to reveal important information regarding transcripts and their expression pattern among cells. Binary data analysis, for example, if a specific transcript is expressed or not in a given cell, can be used to evaluate if biomarkers are uniquely expressed or not. Characteristics of different cell populations are typically described by basic statistical parameters, such as the number of cells expressing respective transcript, mean, standard deviation and distribution parameters such as skewness and kurtosis. Visualization of data, including heat maps (both for binary and numerical data) and distributions of transcripts, is usually very informative to understand cell heterogeneity and gene-expression patterns. Correlation studies can be applied to single-cell data to reveal gene networks that cannot be identified at cell population level Citation[19]. Furthermore, hierarchical clustering, principal component analysis and Kohonen self-organizing maps have been successfully applied to group genes and cells to known cell types, but also to identify previously unknown subpopulations Citation[9,19,22].
Diagnostic applications using single-cell analysis
Single-cell analysis is not yet common in diagnostics. Although, one important application is the use in preimplantation genetic diagnosis (PGD) at genomic level. PGD was already described in 1990 for X-chromosome linked diseases Citation[38]. Male and female embryos were distinguished using of a Y-chromosome specific PCR and only female embryos were transferred. PGD falls mainly into two categories: low- and high-risk PGD. The high-risk group refers to individuals that may have genetic diseases, while the low-risk group refers to individuals for which embryos are screened for chromosome aneuploides. The latter is used to select suitable embryos, thus increasing the in vitro fertilization pregnancy rate Citation[39,40].
The main problem of establishing robust tumor diagnostics based on analyzing classical samples generated from large number of cells using gene-expression profiling is tumor diversity. Tumors are unique in cell composition and they contain a mix of tumor cells, all with differences in growth, migration and survival capacity. Suitable biomarkers have often been difficult to identify and verify, since many transcripts are expressed at highly variable levels in different cell subpopulations. The capability to select and analyze individual cells has therefore a great potential in tumor diagnostics. Genomic analysis can be used to characterize and follow clonal subpopulations of tumor cells characterized by different genomic aberrations. Analyses of primary tumors, circulating tumor cells and tumor cells at metastatic sites allow tumor progression to be monitored before and after treatment Citation[41]. Single-cell gene-expression profiling can also be used to identify and characterize different cell types within a tumor when cells carry identical genomes, including nontumor cells . It can also be used to study cell heterogeneity among seemingly identical tumor cells . Single-cell analysis can be used to identify and count key cells even if they are rare, such as cancer stem cells and circulating tumor cells, with deterministic value in diagnostic and prognostic applications. In addition, gene-expression profiling can be used to measure biomarkers and correlate their expression to defined cell types and cell subpopulations at the single-cell level. These measurements will eliminate confounding data of noninformative cells that affect the gene-expression profiles of classical tumor samples.
Immunostaining relates protein expression to cell morphology and tissue histology, respectively, and is readily performed with single-cell resolution. This correlation is lost when gene-expression profiling is performed on classical samples. The main limitation of immunostaining is that only a few proteins can be analyzed in each cell, while in principle, the complete transcriptome can be assessed in single-cells. Single-cell gene-expression profiling opens new avenues to analyze individual cells in complex samples. In addition to transcript measurements, information regarding protein expression, cell morphology and histology can often be collected for the same analyzed cells. Microdissection followed by laser capture allows proteins and transcripts to be analyzed in the same biological sample. If rare tumor cells, like cancer stem cells and circulating tumor cells, are studied, fluorescence-activated cell sorting may be used to enrich specific cell populations. One restriction of using fluorescence-activated cell sorting and other similar cell enrichment systems is that they require markers that are exclusively expressed in or at the surface of the cell of interest. Isolation of various hematopoietic subpopulations has been successful, using combination of different surface markers. However, most other cell subtypes can presently not be isolated, since we are lacking the knowledge of specific surface markers. Intracellular markers can be used for cell enrichment if the cells are fixed, but surface markers are preferred, since fixation causes RNA loss and increases the risk of cross contamination of transcripts between individual cells. Identification and validation of surface markers and biomarkers for diagnostic and prognostic purpose is an iterative process. The predictive power of the biomarker analysis will increase if we can enrich for informative tumor cells, since we currently cannot analyze all cells in a tumor at single-cell level. However, to identify and validate useful markers for cell collection we need to correlate their expression to potential biomarkers. By improving the specificity of the cell collection and enriching for more representative cells, the biomarker analyses for diagnostic and prognostic purposes will be refined for each round of evaluation. Specific tumor surface markers can also serve as biomarkers, especially when cancer stem cells and circulating tumor cells are counted and studied. If a cell representative for the whole tumor existed, one cell would still not be sufficient to perform reliable molecular diagnosis and prognosis, since there is substantial heterogeneity among cells, even tumor cells, generated from the same clone. Large numbers of individual tumor cells must therefore be analyzed, both to reveal cell heterogeneity and to identify rare subpopulation of cells, such as cancer stem cells, that may be critical for the treatment of the tumor. The predictive power of the test improves with increasing numbers of cells analyzed.
Another research field where single-cell gene-expression profiling is expected to be important is regenerative medicine. Induced pluripotent stem cells and embryonic stem cells are self-renewing pluripotent stem cells with the unique capacity to generate any cell type in the body. This capability is the basis for considering pluripotent stem cells as an unlimited source of cells for replacement therapies and for the treatment of a wide range of diseases, including diabetes mellitus and Alzheimer’s and Parkinson’s diseases. However, stem cells must be completely differentiated to target cell types. Terminally differentiated cells then need to be isolated and characterized before their full potential in the clinic can be applied. Here, single-cell analysis can serve as an important tool for cell characterization. Several reports have indicated high heterogeneity among undifferentiated and differentiated stem cells at single-cell level using RT-qPCR Citation[22,23,42].
Expert commentary
Today, several methods are available for reliable single-cell gene-expression measurements, all having their advantages and limitations. RT-qPCR is probably the simplest experimental system to work with, since most molecular biologists are familiar with RT-qPCR and have access to the equipment needed. The system is flexible: it is easy to change target transcripts and cells to analyze, and all available instrument platforms and detection chemistries can be applied. Owing to the small number of transcripts per cell, each experimental step needs careful optimization. Good laboratory practice is also essential for reliable single-cell experiments, in particular avoiding contamination. Sample preparation and cell collection are the main bottlenecks for RT-qPCR and most other single-cell techniques. No matter what the cell collection method applied, is users should be aware of the potential biases the technique introduces to the measured transcript profile. RT-qPCR data analysis is in comparison to data generated by the majority of other single cell methods relatively easy to perform. However, single-cell data cannot be analyzed by the same means as cell population data, for example, normalization with reference genes is not possible. In summary, single-cell gene-expression profiling using RT-qPCR can be an affordable and soon to be standard technology in many laboratories.
Five-year view
Single-cell gene-expression profiling offers scientists a new tool to screen and study clinical samples with improved resolution. Today, RT-qPCR is becoming a standardized method that is used routinely, but its application in single-cell studies is not yet well established. Today, several methods to collect small size biopsies and rare subpopulations exists, but further improvments to minimize biopsy size and maximize the number of cells that can be analyzed are needed. It will be important to minimize the number of cells that are lost in sample preparation, such as uncontrolled cell lysis in cell dissociation. Optimally, all cells in the biopsies should be analyzed if needed. Fast development of simplified and standardized single-cell collection techniques that are fully compatible to single-cell gene-expression profiling is expected. In the next few years, we will hopefully have access to fully integrated systems for cell collection and RT-qPCR. We also expect the development of improved tools to analyze large single-cell data sets. In addition to transcripts, information regarding genomes, proteins, metabolites and cell morphology will be measured at single-cell level, potentially in the same individual cell. Single-cell analysis will be used to study the compensation of cell types in samples and for refined biomarker analysis in well defined cell types and cell subpopulations. Furthermore, single-cell gene-expression profiling is expected to be used to detect and analyze rare subpopulations of cells, such as cancer stem cells and circulating tumor cells. Ultimately, single-cell analysis will become a valuable tool in various diagnostic and prognostic applications.
Key issues
• One of the main limitations of classical gene-expression profiling in diagnostics is that measurements are performed on a mixture of cells in unknown proportions.
• Single-cell gene-expression profiling allows identification and characterization of different cell types and cell subtypes. Furthermore, phenotypic heterogeneity can be studied within the same cell type.
• Reliable single-cell gene-expression profiling requires a carefully optimized workflow to minimize RNA losses.
• Cell collection and data analysis are current bottlenecks in reverse transcription quantitative real-time PCR-based single-cell gene-expression profiling.
• Single-cell analysis opens up new possibilities for precise tumor diagnostics. Detection of rare tumor cells and new biomarkers correlated to specific tumor cell subpopulations are expected to result in refined diagnostic applications.
Financial & competing interests disclosure
The authors’ work on single cells was supported by grants from Assar Gabrielssons Research Foundation, Goljes Memory, LUA/ALF Västra Götaland, Johan Jansson Foundation for Cancer Research, Swedish Cancer Society, Swedish Children’s Cancer Society, Swedish Society for Medical Research, Wilhelm and Martina Lundgren Foundation for Scientific Research and grants GAČR P303/10/1338 and GAČR 301/09/1752 from the granting agency of the Czech Republic. Anders Ståhlberg and Mikael Kubista both declare stock ownership in TATAA Biocenter AB and have a patent received (including royalties) for CelluLyser and Real-time Ready Cell. The authors have no other relevant affiliations or financial involvement with any organization or entity with a financial interest in or financial conflict with the subject matter or materials discussed in the manuscript apart from those disclosed.
No writing assistance was utilized in the production of this manuscript.
References
- Elowitz MB, Levine AJ, Siggia ED, Swain PS. Stochastic gene expression in a single cell. Science297(5584), 1183–1186 (2002).
- Kaufmann BB, van Oudenaarden A. Stochastic gene expression: from single molecules to the proteome. Curr. Opin. Genet. Dev.17(2), 107–112 (2007).
- Novick A, Weiner M. Enzyme induction as an all-or-none phenomenon. Proc. Natl Acad. Sci. USA43(7), 553–566 (1957).
- Blake WJ, Kaern M, Cantor CR, Collins JJ. Noise in eukaryotic gene expression. Nature422(6932), 633–637 (2003).
- Raj A, Peskin CS, Tranchina D, Vargas DY, Tyagi S. Stochastic mRNA synthesis in mammalian cells. PLoS Biol.4(10), e309 (2006).
- Bengtsson M, Ståhlberg A, Rorsman P, Kubista M. Gene expression profiling in single cells from the pancreatic islets of Langerhans reveals lognormal distribution of mRNA levels. Genome Res.15(10), 1388–1392 (2005).
- Warren L, Bryder D, Weissman IL, Quake SR. Transcription factor profiling in individual hematopoietic progenitors by digital RT-PCR. Proc. Natl Acad. Sci. USA103(47), 17807–17812 (2006).
- Liss B, Franz O, Sewing S, Bruns R, Neuhoff H, Roeper J. Tuning pacemaker frequency of individual dopaminergic neurons by Kv4.3L and KChip3.1 transcription. EMBO J.20(20), 5715–5724 (2001).
- Sul JY, Wu CW, Zeng F et al. Transcriptome transfer produces a predictable cellular phenotype. Proc. Natl Acad. Sci. USA106(18), 7624–7629 (2009).
- Tietjen I, Rihel JM, Cao Y, Koentges G, Zakhary L, Dulac C. Single-cell transcriptional analysis of neuronal progenitors. Neuron38(2), 161–175 (2003).
- Golding I, Paulsson J, Zawilski SM, Cox EC. Real-time kinetics of gene activity in individual bacteria. Cell123(6), 1025–1036 (2005).
- Chubb JR, Trcek T, Shenoy SM, Singer RH. Transcriptional pulsing of a developmental gene. Curr. Biol.16(10), 1018–1025 (2006).
- Larsson C, Grundberg I, Söderberg O, Nilsson M. In situ detection and genotyping of individual mRNA molecules. Nat. Methods7(5), 395–397 (2010).
- Tang F, Barbacioru C, Wang Y et al. mRNA-Seq whole-transcriptome analysis of a single cell. Nat. Methods6(5), 377–382 (2009).
- Femino AM, Fay FS, Fogarty K, Singer RH. Visualization of single RNA transcripts in situ. Science280(5363), 585–590 (1998).
- Levsky JM, Shenoy SM, Pezo RC, Singer RH. Single-cell gene expression profiling. Science297(5582), 836–840 (2002).
- Gao Y, Stanford WL, Chan WC. Quantum-dot-encoded microbeads for multiplexed genetic detection of non-amplified DNA samples. Small7(1), 137–146 (2011).
- Geiss GK, Bumgarner RE, Birditt B et al. Direct multiplexed measurement of gene expression with color-coded probe pairs. Nat. Biotechnol.26(3), 317–325 (2008).
- Ståhlberg A, Andersson D, Aurelius J et al. Defining cell populations with single-cell gene expression profiling: correlations and identification of astrocyte subpopulations. Nucleic Acids Res.39(4), e24 (2011).
- Bengtsson M, Hemberg M, Rorsman P, Ståhlberg A. Quantification of mRNA in single cells and modelling of RT-qPCR induced noise. BMC Mol. Biol.9, 63 (2008).
- Ginsberg SD, Elarova I, Ruben M et al. Single-cell gene expression analysis: implications for neurodegenerative and neuropsychiatric disorders. Neurochem. Res.29(6), 1053–1064 (2004).
- Guo G, Huss M, Tong GQ et al. Resolution of cell fate decisions revealed by single-cell gene expression analysis from zygote to blastocyst. Dev. Cell18(4), 675–685 (2010).
- Hough SR, Laslett AL, Grimmond SB, Kolle G, Pera MF. A continuum of cell states spans pluripotency and lineage commitment in human embryonic stem cells. PLoS One4(11), e7708 (2009).
- Kamme F, Salunga R, Yu J et al. Single-cell microarray analysis in hippocampus CA1: demonstration and validation of cellular heterogeneity. J. Neurosci.23(9), 3607–3615 (2003).
- Gründemann J, Schlaudraff F, Haeckel O, Liss B. Elevated α-synuclein mRNA levels in individual UV-laser-microdissected dopaminergic substantia nigra neurons in idiopathic Parkinson’s disease. Nucleic Acids Res.36(7), e38 (2008).
- Bustin SA, Benes V, Garson JA et al. The MIQE guidelines: minimum information for publication of quantitative real-time PCR experiments. Clin. Chem.55(4), 611–622 (2009).
- Ståhlberg A, Håkansson J, Xian X, Semb H, Kubista M. Properties of the reverse transcription reaction in mRNA quantification. Clin. Chem.50(3), 509–515 (2004).
- Ståhlberg A, Kubista M, Pfaffl M. Comparison of reverse transcriptases in gene expression analysis. Clin. Chem.50(9), 1678–1680 (2004).
- Eberwine J, Yeh H, Miyashiro K et al. Analysis of gene expression in single live neurons. Proc. Natl Acad. Sci. USA89(7), 3010–3014 (1992).
- Brady G, Barbara M, Iscove NN. Representative in vitro cDNA amplification from individual hemopoitic cell and colonies. Methods Mol. Cell. Biol.2, 17–25 (1990).
- Dafforn A, Chen P, Deng G et al. Linear mRNA amplification from as little as 5 ng total RNA for global gene expression analysis. Biotechniques37(5), 854–857 (2004).
- Wang E, Miller LD, Ohnmacht GA, Liu ET, Marincola FM. High-fidelity mRNA amplification for gene profiling. Nat. Biotechnol.18(4), 457–459 (2000).
- Iscove NN, Barbara M, Gu M, Gibson M, Modi C, Winegarden N. Representation is faithfully preserved in global cDNA amplified exponentially from sub-picogram quantities of mRNA. Nat. Biotechnol.20(9), 940–943 (2002).
- Gonzalez-Roca E, Garcia-Albéniz X, Rodriguez-Mulero S, Gomis RR, Kornacker K, Auer H. Accurate expression profiling of very small cell populations. PLoS One5(12), e14418 (2010).
- Larson DR, Singer RH, Zenklusen D. A single molecule view of gene expression. Trends Cell Biol.19(11), 630–637 (2009).
- Raj A, van Oudenaarden A. Nature, nurture, or chance: stochastic gene expression and its consequences. Cell135(2), 216–226 (2008).
- Vermeulen J, De Preter K, Lefever S et al. Measurable impact of RNA quality on gene expression results from quantitative PCR. Nucleic Acids Res.39(9), e63 (2011).
- Handyside AH, Kontogianni EH, Hardy K, Winston RM. Pregnancies from biopsied human preimplantation embryos sexed by Y-specific DNA amplification. Nature344(6268), 768–770 (1990).
- Thornhill AR, deDie-Smulders CE, Geraedts JP et al. ESHRE PGD Consortium ‘Best practice guidelines for clinical preimplantation genetic diagnosis (PGD) and preimplantation genetic screening (PGS)’. Hum. Reprod.20(1), 35–48 (2005).
- Sermon K, Van Steirteghem A, Liebaers I. Preimplantation genetic diagnosis. Lancet363(9421), 1633–1641 (2004).
- Navin N, Kendall J, Troge J et al. Tumour evolution inferred by single-cell sequencing. Nature472(7341), 90–94 (2011).
- Ståhlberg A, Bengtsson M, Hemberg M, Semb H. Quantitative transcription factor analysis of undifferentiated single human embryonic stem cells. Clin. Chem.55(12), 2162–2170 (2009).