Abstract
The Pharmaceutical Management Agency in New Zealand, PHARMAC, was established in 1993 at a time when growth in pharmaceutical expenditure was very high and arguably unsustainable. PHARMAC was charged with finding new and effective ways to manage expenditure growth, while also obtaining the best health outcomes for the New Zealand population. In order to help achieve this goal, PHARMAC has used Programme Budgeting Marginal Analysis. The use of Programme Budgeting Marginal Analysis, together with a capped budget and tools to generate savings, has significantly contributed to PHARMAC achieving its objective. However, there are implications of using Programme Budgeting Marginal Analysis with a capped budget. In particular, a different approach is required when undertaking and using cost–utility analysis (focused strongly on relative cost–effectiveness), and the opportunity cost of poor decisions is magnified significantly. As the demand on pharmaceutical expenditure continues to rise, the opportunity cost of not having a capped budget and tools for controlling pharmaceutical subsidies will only increase.
ACP: African, Caribbean and Pacific countries.
Pharmaceutical funding and assessment organizations worldwide all share a common goal – seeking to improve health outcomes through providing access to beneficial pharmaceuticals. It is widely acknowledged that unrestricted access to all pharmaceuticals would result in uncontrolled and unsustainable expenditure. However, health-funding organizations differ in one fundamental issue – how we are striving to achieve an acceptable balance between the mostly conflicting goals of access to treatment and cost. There is no clear consensus of a perfect approach to resolve this conflict, and different approaches all have their strengths and weaknesses.
We would like to share the approach that has been used in New Zealand during the past 12 years. The approach has been neither revolutionary nor universally popular, but it has been effective, and its effectiveness mainly comes down to one fundamental concept – a capped budget.
Operating within a capped budget is a legislative requirement of New Zealand’s Pharmaceutical Management Agency, PHARMAC, the government agency that decides which medicines will be subsidized. PHARMAC’s legislative objective is “to secure for eligible people in need of pharmaceuticals, the best health outcomes that are reasonably achievable from pharmaceutical treatment and from within the funding provided”.
PHARMAC was established in 1993 at a time when growth in pharmaceutical expenditure had been very high (between 10 and 20% per year), with the risk of further ongoing cost escalation. The rate of increase in pharmaceutical expenditure was faster than the growth in the overall health budget and expenditure on pharmaceuticals was crowding out expenditure in other areas Citation[1]. PHARMAC was charged with finding new and effective ways to manage expenditure growth while also obtaining the best health outcomes. In order to help achieve this goal, PHARMAC has used Programme Budgeting and Marginal Analysis (PBMA).
This article describes why PHARMAC uses PBMA to manage pharmaceutical funding, key mechanisms associated with PBMA, implications of having a capped budget and using PBMA, and the overall impact on pharmaceutical expenditure.
Rationale for PBMA
Programme Budgeting Marginal Analysis at PHARMAC involves two fundamental steps:
• Estimating the budget impact of a proposal;
• Undertaking marginal analysis (typically cost–utility analysis [CUA]) and funding the combination of interventions that provide the most health gains until the budget is exhausted.
The key benefit of this approach is that it requires explicit consideration of opportunity cost. When having to make choices within limited resources, certain opportunities will be taken up while others must be forgone, with the overall aim of maximizing health gains (or minimizing the forgone benefits).
An alternative method, used by many organizations to indicate if a pharmaceutical is good value for money, is a funding threshold, typically a cost per quality-adjusted life-year (QALY) threshold. If the cost per QALY is below the threshold, the pharmaceutical is considered to be a worthwhile investment Citation[2–8]. However, there are fundamental problems with such thresholds, which mean that the pharmaceuticals funded do not necessarily provide the greatest health gains Citation[4].
First, as interventions are considered in isolation from other potential investments, the opportunity cost of the investment is not considered explicitly Citation[3]. Decision-makers are faced with imperfect information and, hence, are unable to maximize health outcomes.
Second, the use of a cost per QALY threshold to manage pharmaceutical funding is unlikely to result in eliciting the best possible pharmaceutical prices. If it is known that a pharmaceutical will be funded if the cost per QALY is below a certain threshold, the incentive for companies to price more competitively is reduced (if not lost altogether) Citation[4,9]. In addition, any option of price negotiation is essentially eliminated if ‘value for money’ has been proven at the proposed price. If a lower price could be negotiated, additional pharmaceuticals (achieving increased health gains) could be funded with the same amount of resources.
Third, the threshold approach gives no consideration to affordability. Hypothetically, for the extent that pharmaceuticals need to meet the threshold, unlimited funding must be available Citation[4]. Whether a particular intervention represents value for money needs to be determined by what must be forgone in order to afford it Citation[3,4]. In an era of increasing demand on pharmaceutical expenditure, and with a myriad of demands on government expenditure (both in health and other areas), this is unlikely to be sustainable.
Therefore, even though CUA is based on the fundamental economic concepts of resource scarcity and opportunity cost, these concepts are often ignored in the application of CUA. In particular, no consideration is given to opportunity cost Citation[10]. This is likely to encourage higher pharmaceutical prices and, thereby, risks unsustainable increases in pharmaceutical expenditure. These limitations of a threshold approach seem to deserve wider recognition and debate.
Effectiveness of PBMA at PHARMAC
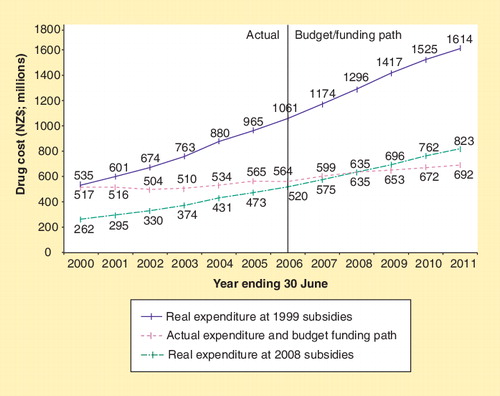
The use of PBMA, along with the tools and strategies PHARMAC uses to generate savings, seems to have been very effective in improving the value for money of pharmaceuticals funded, and controlling the growth in overall expenditure. Since the establishment of PHARMAC, there has been a significant reduction in pharmaceutical expenditure growth; down from 10–20% per year in the 1980s and early 1990s, to less than 3% per year for the last 5 years. At the same time, more than 180 new chemical entities have been funded and access widened to a number of pharmaceuticals. illustrates the impact PHARMAC has had on pharmaceutical expenditure.
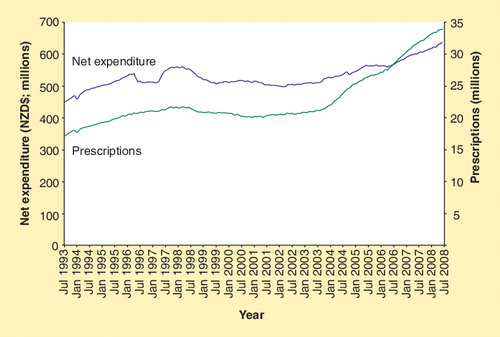
For the year ending 30 June 2008, expenditure on subsidized community pharmaceuticals was estimated to be NZ$635.35 million; NZ$0.65 million within the budget of NZ$636 million (representing 5.7% of the total health budget). This spending resulted in 33.92 million prescriptions written for medicines for at least 2.9 million individual New Zealanders (a 7.4% increase in the number of prescriptions compared with the previous financial year). Of all the pharmaceuticals on the Pharmaceutical Schedule, 87% are fully subsidized by the government; therefore, in most cases, the only cost to the individual is a NZ$3 prescription charge. illustrates how the number of prescriptions is increasing at a faster rate than the growth in expenditure. PHARMAC also assesses the health gains obtained through its investments and measures outcomes in QALYs. In 2007/2008, it is estimated that 1350 QALYs would be gained from the funding of six new pharmaceutical treatments.
Importance of a capped budget
For PBMA to be fully effective, the budget must be binding. It needs to be clear that there is a limit to the amount of money available for investment in pharmaceuticals in order to ensure that funding trade-offs are made and to be able to effectively negotiate prices and encourage price competition.
A capped budget can also assist long-term sustainability in pharmaceutical expenditure. Through undertaking expenditure forecasts and regularly monitoring expenditure, the decision-maker is provided with information on how much they can afford to spend.
Overall, a capped budget forces a very careful approach to decision-making, as the cost of making poor decisions can be significant if it means that other (potentially more cost-effective) pharmaceuticals cannot be funded (and, hence, health gains are forgone). As an example, in 2003, PHARMAC decided not to fund COX-2 inhibitors. This decision meant that at least 18 other pharmaceuticals were able to be funded or have access extended, resulting in the equivalent of 437 ‘statistical lives’ being saved per year, 4231 QALYs gained in the first year alone, and nominal savings for hospitals Citation[12].
Assessing value through the use of marginal analysis
Owing to the difficulties associated with disinvesting in pharmaceuticals, PHARMAC views a decision to fund a pharmaceutical as akin to an investment decision. As with any major investment decision, we must be confident that the investment will provide the claimed benefits. The Pharmacology and Therapeutics Advisory Committee (PTAC), a group of expert practicing clinicians, has the role of advising PHARMAC on pharmacological and therapeutic consequences of funding options.
If the pharmaceutical is more effective and more costly than currently funded alternatives, a CUA will be undertaken. PHARMAC has undertaken CUAs to inform pharmaceutical funding decisions since 1996. This is a key analytical tool in PHARMAC’s management of drug subsidies. However, investment decisions are made according to the full range of decision criteria (Box 1), and cost–effectiveness by itself does not determine the outcome.
The methods PHARMAC uses in CUA are outlined in PHARMAC’s Prescription for Pharmacoeconomic Analysis, updated in 2007 Citation[13]. As outlined in the Prescription for Pharmacoeconomic Analysis, PHARMAC uses CUA to compare the cost per QALY of a pharmaceutical with other pharmaceuticals that could be funded instead. In other words, it is the relative (rather than absolute) cost–effectiveness of a pharmaceutical that is important. In this relative assessment context, it is critical that each analysis is undertaken based on the same methodology, so that comparisons are valid and the results meaningful for decision-making. To assist with consistency, PHARMAC undertakes most of its analyses ‘in-house’.
An implication of using information on relative cost–effectiveness is the requirement to undertake rapid CUAs – detailed analyses are very rarely considered to be necessary. While further analysis may improve the academic rigor of the assessment (e.g., undertaking Monte-Carlo simulation, probabilistic sensitivity analysis and Bayesian analysis), we have found that increased levels of complexity often do not further inform the funding decision or impact the relative cost–effectiveness of the pharmaceutical. Undertaking detailed CUAs when not strictly needed also ties-up resources, thereby impinging on the ability to undertake other analyses or fund work generally. In addition, at PHARMAC, the CUA result is not critical to the setting of a subsidy, so perfecting the CUA is seldom necessary. What is most important is that the CUA is ‘good enough’ to inform PHARMAC of where the pharmaceutical should be placed on the priority list. Depending on the specific circumstances at any time, PHARMAC undertakes four levels of analysis: rapid, preliminary, indicative and detailed. These levels of analysis are described in Box 2.
The time required to undertake these analyses ranges from 2 days to 6 months. If a rapid CUA indicates there is very large uncertainty in the cost per QALY result (to the extent that the relative placement of the pharmaceutical is uncertain), further analysis will be undertaken. The level of analysis largely depends on the ability to prioritize the pharmaceutical with sufficient certainty. In 2007/2008, PHARMAC’s four health economists undertook 63 CUAs on funding proposals.
Once full information on a proposal is available (including PTAC priority and cost–effectiveness), this information is compiled and considered by PHARMAC. This is similar to a QALY league table but with additional information according to PHARMAC’s nine decision criteria. All pharmaceuticals awaiting funding are prioritized against other expenditure options (either listing of new pharmaceuticals or expanding access to existing pharmaceuticals), with the overall aim of identifying those proposals that would maximize health outcomes if funded.
Tools & strategies to generate savings
PHARMAC encourages price competition through the use of competitive processes, such as tendering for supply. Transactions are completed on a willing-buyer–willing-seller basis. The tools and strategies that can be used to generate savings, further outlined below, are no different, conceptually, to what would be observed in most other markets.
Controlled access to subsidies
If pharmaceutical suppliers want to have their products subsidized, they must negotiate with PHARMAC over the price and other conditions of listing. This encourages suppliers to compete with each other through offering funding proposals, acting strategically, developing innovative commercial solutions to issues and enhancing their prospects of listing by providing proposals that compare favorably with PHARMAC’s Decision Criteria.
Reference pricing
Reference pricing is where PHARMAC pays the same subsidy to products that have the same or similar therapeutic effect. Reference pricing is normally provided where there is a fully funded product. If companies price their drugs above the level of subsidy, the patient must pay the difference. In our experience, patients generally switch to the pharmaceutical with the least out-of-pocket expense. This market leverage means that reference pricing can be effective in stimulating price competition amidst efforts by suppliers to gain (or retain) market share Citation[1]. In addition, a wider suite of funded products for any supplier may give rise to negotiating options that lead to other, wider benefits.
Targeting criteria
Targeting criteria are an effective mechanism for targeting funding to those patients who are likely to benefit the most (i.e., the most cost-effective subgroup to treat). Additionally, targeting criteria can ensure that patients first try cheaper drugs (which are, in some cases, equally effective) before switching to higher-priced pharmaceuticals. A further advantage of targeting criteria is that they provide commercial opportunities – to have a pharmaceutical derestricted, a pharmaceutical company may be prepared to offer a further price reduction Citation[1].
Expenditure caps & rebates
Expenditure caps are an effective risk-sharing mechanism, and they are particularly useful when there is significant uncertainty and potential risk regarding the likely uptake of the pharmaceutical. With expenditure caps, if the annual expenditure exceeds the agreed cap, the balance (or a portion of it) is refunded. This can be an important mechanism in assisting expenditure management within budget, by reducing or eliminating forecasting uncertainty over what the budget impact may be.
Contracts with pharmaceutical companies may also include a rebate on the cost of the pharmaceutical. This is an effective way to obtain lower prices than might otherwise occur. Confidential rebates are favored in some circumstances to obscure pricing arrangements from other payers and to avoid possible arbitrage from exporting product to other higher-priced markets. To indicate magnitude, in the year ending June 2006, we reported rebates of NZ$132 million, approximately 17% of gross expenditure.
Tendering
Tenders can result in pharmaceutical suppliers gaining the sole subsidized supply of a pharmaceutical (i.e., only one brand of pharmaceutical is fully subsidized on the Pharmaceutical Schedule) or limited subsidized supply (usually for a 3-year period). By offering sole supply, competitive pricing is strongly incentivized, with the benefit of lower supplier costs (e.g., less business analysis, sales and marketing). In addition, tendering can also be used to secure supply of some low-volume products. The first multiproduct tender for off-patent pharmaceuticals was held in 1997, with tenders run every year since.
An important compliment to the tender process is the management of stock disruptions. PHARMAC have attempted to reduce this risk by requiring tender suppliers to notify PHARMAC whenever stock holdings fall below 2 months worth of stock. In this event, PHARMAC is usually able to source stock from an alternative supplier. Note, however, that in the context of over 400 tender contracts, out-of-stock situations are not common.
Tenders have been very effective in lowering the price of generic pharmaceuticals and have been associated with savings to the pharmaceutical budget of NZ$20–30 million per 3-year tender. Nearly a third of the individual chemicals on the Pharmaceutical Schedule are sourced through the tender. Examples of pharmaceuticals PHARMAC has tendered include fluconazole 200-mg capsule (93.4% price reduction), doxycycline 100-mg tablet (82% price reduction), buspirone 10-mg tablet (90.8% price reduction) and pindolol 15-mg tablet (80.9% price reduction).
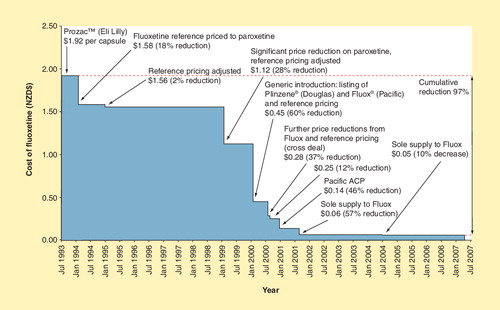
An example of the combined effects of tendering and reference pricing is included in . PHARMAC funded fluoxetine in 1993 at a price of $1.92 per 20-mg capsule. In 1994, fluoxetine was reference priced to paroxetine, reducing the price to NZ$1.58 per capsule (18% price reduction). In 1999, PHARMAC negotiated a significant price reduction on paroxetine, hence the reference pricing of fluoxetine was adjusted to NZ$1.12 per capsule (28% price reduction). Generic fluoxetine was available in New Zealand in 2000, leading to a 60% price reduction (NZ$0.45 per capsule). Further price reductions occurred from 2000 to 2004, including Pacific Pharmaceuticals being awarded sole supply of fluoxetine. In 2004, the price of fluoxetine was NZ$0.05 per capsule – a cumulative reduction in price of 97% since 1993 . This is not an unusual situation.
Alternative commercial proposals
When PHARMAC consults with pharmaceutical suppliers on the proposed tender product lists, pharmaceutical suppliers are invited to submit alternative commercial proposals to protect their products from tendering. This process generates substantial savings, as suppliers are often willing to offer significant price reductions, both on products about to be tendered and other products in their portfolio, in order to avoid tendering.
Requests for proposals
Requests for proposals are often used to generate competition between suppliers for subsidy of certain pharmaceuticals, when tendering is not appropriate. An example of this would be offering preferable access criteria to a pharmaceutical company for a period of time, which, for instance, occurred with TNF modulators for arthritis.
Multiproduct agreements
Multiproduct agreements are used for many different purposes and can result in significant savings. An example is imatinib mesylate (Glivec®). In 2001, PHARMAC received a submission to fund imatinib mesylate for patients with blast, accelerated and chronic phases of chronic myeloid leukemia. A CUA was undertaken that indicated that the cost per QALY was likely to be more than NZ$100,000. In addition, the budget impact of funding imatinib mesylate was estimated to be significant. PHARMAC, therefore, negotiated further with the company and came to an agreement involving a number of products that reduced the cost per QALY of the overall proposal to an acceptable level.
Expert commentary & five-year view
The use of PBMA, together with a capped budget and tools to generate savings, provides health-funding organizations with the means to maximize health outcomes through the funding of beneficial pharmaceuticals, while also containing pharmaceutical expenditure. PHARMAC has used this approach for the past 12 years and has been able to successively achieve its objective of securing the best health outcomes possible from the funding provided.
There are implications to having a capped budget and using PBMA. We are rarely able to undertake detailed CUA; as such, an approach would mean forgoing analyses when making other decisions or being unable to prioritize other pharmaceuticals for funding. In addition, detailed analyses are often not critical to make the necessary judgments regarding relative priorities. Although undertaking rapid cost–utility analyses may be considered by some purists as undesirable, it is actually not too different from many other organizations who are seeking to get the best value for money from expenditure. What is most important is to ensure that the benefits from the technology are sufficiently likely to be obtained (i.e., that the clinical evidence is sufficiently robust), that the budget impact is minimized and that the pharmaceuticals’ additional benefits justify its additional costs compared with other interventions that could be funded.
There is no doubt that having a capped budget significantly magnifies the opportunity cost of making a poor decision. The budget forces a very careful approach to ensure that every dollar is spent wisely. The use of CUA for relative assessment is critical to efficient budget allocation. With every new proposal, PHARMAC needs to consider a key question: what other pharmaceuticals could be funded from this money and how many additional QALYs would be gained from this funding decision compared with alternative options? Without a budget constraint, it is easy to lose sight of the one thing that makes it okay to say ‘no’ – the opportunity cost of saying ‘yes’.
As the demand on pharmaceutical expenditure continues to increase, and with wide-ranging demands on government expenditure and tight economic conditions in many countries, the opportunity cost of not having a capped budget and tools for controlling and influencing pharmaceutical prices will only increase. Some form of rationing is inevitable. The approach of PBMA ensures that new pharmaceuticals can continue to become available in an affordable way. In addition, it increases the likelihood that those pharmaceuticals that are funded are relatively good value for money.
The use of PBMA, together with tools to generate savings, ensures that new pharmaceuticals can continue to become available in an affordable way.
Box 1. PHARMAC’s decision criteria.
• The health needs of all eligible people within New Zealand
• The particular needs of Maori and Pacific people
• The availability and suitability of existing medicines, therapeutic medical devices and related products and items
• The clinical benefits and risks of pharmaceuticals
• The cost–effectiveness of meeting health needs by funding pharmaceuticals, rather than by using other publicly funded health and disability support services
• The budgetary impact (in terms of the pharmaceutical budget and the government’s overall health budget) of any changes to the Pharmaceutical Schedule
• The direct cost to health-service users
• The government’s priorities for health funding, as set out in any objectives notified by the Crown to PHARMAC, in PHARMAC’s Funding Agreement or elsewhere
• Any other criteria that PHARMAC thinks are relevant. PHARMAC will carry out the necessary consultation whenever it intends to take any ‘other criteria’ into account
Box 2. Levels of PHARMAC cost–utility analysis.
Detailed
• Includes a detailed and systematic identification and synthesis of relative clinical effectiveness, prognosis, health-related quality of life and cost data. Evidence critically appraised using full GATE
• Costs and savings to other government organizations considered in the report in a qualitative manner
• Probabilistic sensitivity analysis undertaken
• Reviewed internally (clinical assumptions reviewed by the PTAC and externally
Indicative
• Interim assessment using some opportunistic data but more detailed than a preliminary analysis
• Evidence critically appraised using GATE Lite
• Reviewed internally and by PTAC
Preliminary
• Rapid assessment largely using opportunistic data; evidence critically appraised using GATE Lite
• Statistically nonsignificant events and costs only included if they are likely to change the results of analyses
• Reviewed internally
Rapid
• Very rapid assessment using opportunistic data
Key issues
• PHARMAC, the Pharmaceutical Management Agency in New Zealand, was established at time in New Zealand when growth in pharmaceutical expenditure was very high (between 10 and 20% per year). PHARMAC was charged with finding new and effective ways to manage expenditure growth while also obtaining the best health outcomes. To help do this, PHARMAC has used Programme Budgeting and Marginal Analysis (PBMA). The use of PBMA, together with a capped budget and tools to generate savings, has assisted in controlling expenditure growth (to ∼3% per year). At the same time, more than 180 new chemical entities have been funded.
• PBMA at PHARMAC involves two fundamental mechanisms: establishing the budget impact of a proposal, and undertaking marginal analysis (typically cost–utility analysis), and funding the combination of interventions that provide the maximum health gains until the budget is exhausted.
• For PBMA to be fully effective, the budget must be binding. It needs to be clear that there is a limit to the amount of money available for investment in pharmaceuticals in order to be able to effectively negotiate prices. A binding budget can also assist with long-term sustainability in pharmaceutical expenditure and encourages a very careful approach to all funding decisions.
• To avoid the need for disinvestment, tools and strategies can be used to generate savings so that beneficial pharmaceuticals can continue to be funded while also remaining within budget. These tools include controlled access to subsidies, reference pricing, introducing targeting criteria in order to target high-cost drugs to those patients who are likely to benefit the most (and hence the most cost-effective subgroup), using expenditure caps to encourage risk sharing, introducing pricing options such as confidential rebates and multiproduct agreements, and using tenders and alternative commercial proposals to allow pharmaceutical companies to gain sole supply of a pharmaceutical.
• With the use of PBMA, it is important that information is available on the cost–effectiveness of an intervention, to enable prioritization against other current investment options and ensure that the pharmaceuticals funded provide the maximum health gains. This requires a different approach to cost–utility analysis. Owing to the emphasis on relative cost–effectiveness, detailed cost–utility analyses often do not further inform (above rapid analyses) the funding decision or impact on the relative cost–effectiveness of the pharmaceutical. What is most important is that the cost–utility analysis is ‘good enough’ to inform a pharmaceutical’s placement on the priority list.
Acknowledgements
The author would like to acknowledge the significant contribution the following people made in the drafting of this article: Peter Alsop (Manager, Corporate and External Relations, PHARMAC), Scott Metcalfe (Chief Advisor Population Medicine, PHARMAC), Rico Schoeler (Manager, Analysis and Assessment, PHARMAC) and Steffan Crausaz (Manager, Funding and Procurement, PHARMAC).
Financial & competing interests disclosure
Rachel Grocott is an employee of PHARMAC. The author has no other relevant affiliations or financial involvement with any organization or entity with a financial interest in or financial conflict with the subject matter or materials discussed in the manuscript apart from those disclosed.
No writing assistance was utilized in the production of this manuscript.
Notes
GATE: Graphic Appraisal Tool for Epidemiology; PTAC: Pharmacology and Therapeutic Advisory Committee.
References
- Braae R, McNee W, Moore D. Managing pharmaceutical expenditure while increasing access. The Pharmaceutical Management Agency (PHARMAC) experience. Pharmacoeconomics16(6), 649–660 (1999).
- Claxton K, Briggs A, Buxton MJ et al. Value based pricing for NHS drugs: an opportunity not to be missed? BMJ336(7638), 251–254 (2008).
- Birch S, Gafni A. The ‘NICE’ approach to technology assessment: an economics perspective. Health Care Manag. Sci.7(1), 35–41 (2004).
- Detsky AS, Laupacis A. Relevance of cost–effectiveness analysis to clinicians and policy makers. JAMA298(2), 221–224 (2007).
- Birch S, Gafni A. Information created to evade reality (ICER): things we should not look to for answers. Pharmacoeconomics24(11), 1121–1131 (2006).
- Buxton MJ. Economic evaluation and decision making in the UK. Pharmacoeconomics24(11), 1133–1142 (2006).
- Godman B, Haycox A, Schwabe U, Joppi R, Garattini S. Having your cake and eating it: Office of Fair Trading proposal for funding new drugs to benefit patients and innovative companies. Pharmacoeconomics26(2), 91–98 (2008).
- Appleby J, Devlin N, Parkin D. NICE’s cost–effectiveness threshold. BMJ335(7616), 358–359 (2007).
- McCabe C, Claxton K, Culyer AJ. The NICE cost–effectiveness threshold: what it is and what that means. Pharmacoeconomics26(9), 733–744 (2008).
- Cohen J, Stolk E, Niezen M. The increasingly complex fourth hurdle for pharmaceuticals. Pharmacoeconomics25(9), 727–734 (2007).
- Brougham M, Metcalfe S, McNee W. Our advice? Get a budget! Healthc. Pap.3(1), 83–85; discussion 87–94 (2002).
- Grocott R, Metcalfe S. Going against the flow: the impact of PHARMAC not funding COX-2 inhibitors for chronic arthritis. NZ Med. J.118(1223), U1690 (2005).
- Grocott R, Schoeler R, Priest V et al.Prescription for Pharmacoeconomic Analysis – Methods for Cost–Utility Analysis. Version 2. Pharmaceutical Management Agency, PHARMAC, Wellington, New Zealand(2007).