Abstract
Glacier-climate relationships in the Canadian Rockies have been documented previously through mass-balance studies of individual glaciers and local meteorological parameters. In terms of regional significance, however, the relationship between the areal distribution of glaciers and regional climate is perhaps more important in evaluating large-scale responses to climate forcings. The purpose of the current study is to establish which climate variables are responsible for the observed distribution of glaciers. Using a 1:50,000 digitized coverage of glaciers in the Canadian Rockies, a 1-km resolution Digital Elevation Model (DEM) and climate normals from 88 stations throughout the study area, the authors examine the correlation between climate variables and the distribution of glacial ice in the Canadian Rockies. Through the construction of climatic lapse rates, sea-surface interpolation, and subsequent extrapolation based on the DEM, simple cell climatologies that reflect both the altitudinal and regional variations in temperature and precipitation are developed for the study area. Normalized Ice Coverage values prescribed for the study cells from the digitized coverage are then examined through a statistical framework which suggests that spring precipitation, annual temperatures, and winter precipitation are the strongest predictors of glacier distributions in the Canadian Rockies.
Introduction
Glacier mass-balance, defined as the balance between accumulation and ablation in a given glaciological year (CitationMeier and Tangborn, 1965), is a product of local temperature and precipitation conditions. While large mass-balance variations can occur on a yearly basis, the areal extent of glaciers is a product of their cumulative response to multiple past climatic changes (CitationPaterson, 1994). Previous glacier-climate studies conducted in the Canadian Rockies have investigated the relationship between a series of mass-balance measurements taken from a single glacier and local meteorological measurements (CitationYoung, 1981; CitationLetréguilly, 1988) or larger-scale synoptic conditions (CitationYarnal, 1984; CitationDemuth and Keller, 1997). More recently, researchers have examined global-scale climate phenomena and their relation to the mass-balance of western North American glaciers (CitationMcCabe and Fountain, 1995; CitationHodge et al., 1998; CitationBitz and Battisti, 1999; CitationMcCabe et al., 2000, CitationMoore and Demuth, 2001).
The distinguishing feature between our study and previous glacier-climate investigations is the focus on the areal distribution of glaciers in the Canadian Rockies and the climatic conditions associated with their distribution. Our goal is to understand the strength of long-term climate controls on the glacial “health” of an entire area of significant glaciohydrological interest, and from that to develop a methodology for investigating similar regions globally.
STUDY SETTING
The Canadian Rockies comprise several glaciated mountain ranges (cf. CitationOmmanney, 2001) with the Continental Divide centered on the border between British Columbia and Alberta. Our study area includes the glaciated Purcell and Selkirk ranges of the Columbia Mountains, found west of the Columbia Trench (), but it does not cover the Coast Ranges of British Columbia. or the Northern Canadian Rockies extending into the Yukon Territory. The study area, bounded by 49°–56°N and 113.5°–123°W, is discretized into model cells measuring 0.25° latitude by 0.5° longitude (28 by 38 km) for the analysis (cf. ).
Weather conditions in the study area are dominated by mid-latitude cyclones, which cross the region from west to east (CitationYarnal, 1984). While low-level flows are disrupted by the Coast Mountains of British Columbia, the mid-tropospheric lows associated with such disturbances usually continue eastward and bring significant amounts of precipitation to the Columbia Mountains and Rocky Mountains through orographic uplift (CitationHare and Hay, 1974) and through advective moisture transport (CitationBarry, 1992). Peaks along the Continental Divide reach upwards of 3500 m (), and the complex topography produces significant local and regional differences in climate through mesoscale frontal interactions. Windward slopes can receive prolonged precipitation when the lower sections of warm fronts are impeded, and orographic distortion of fronts can modify vertical motion fields, affecting cloud and precipitation patterns (CitationSawyer, 1956; CitationBarry, 1992). Generally, the “smoothed” topography of a mountain range is most closely related to precipitation maxima, but large valleys can set up their own wind systems which further alter precipitation distributions (CitationBarry, 1992).
Data Sources
CLIMATE NORMALS
Sixty-one permanent (year-round) and 27 seasonal (summer-only) climate stations in the Canadian Rockies () are used in the lapse rate analysis and cell climatologies. Station selection criteria is length of record (>20 yr) and location, with mid- to high-altitude stations given preference over geographical and climatological outliers. Monthly climate normals for each station for the period 1961–1990 were obtained from Environment Canada (1993, Citation2001).
Thirty-year climate normals filter out the cumulative effect of variations in annual and multiyear climatic events such as El Niño–Southern Oscillation (ENSO) or the Pacific-Decadal Oscillation (PDO). The 1961–1990 observation period captures both modes of the PDO, with a shift from a cold regime to a warm regime occurring around 1977 (CitationTrenberth and Hurrell, 1994), and similarly averages several ENSO cycles. This time interval also filters out year-to-year variations in climatic conditions which may give rise to extreme variations in annual mass balance measurements (CitationYoung, 1981).
DIGITAL ELEVATION MODEL (DEM)
This study used the Global Land One-kilometer Base Elevation (GLOBE) digital elevation model (DEM), a compilation of various DEMs and digitized cartographic sources produced at the National Geophysical Data Center with 30 arcsec (approximately 1 km) resolution (CitationGLOBE Task Team and others, 2001). The approximation of mesoclimate patterns (such as orographic precipitation), while theoretically possible at the 1-km scale, is limited only by the spatial and temporal resolution of the climate station data. While GLOBE has vertical errors of approximately 30 m (CitationHastings and Dunbar, 1999), model grid cells have an average topographic range of 1982 m, making this error negligible for our purposes.
GLACIER COVERAGE
As a prime objective of this study and for use in future research, glacier boundaries were digitized at the 1:50,000 scale using Natural Resources Canada and Surveys and Mapping Branch topographic maps, with publication dates ranging from 1969–1998. The most recent maps were used preferentially, yet for remote parts of the Canadian Rockies topographic maps have typically not been updated since the 1970s. Consequently, the constructed glacier inventory represents a mosaic rather than an actual snapshot of current glacial extents. Nevertheless, a 1:50,000-scale digital inventory of glaciers in the Canadian Rockies does not currently exist in either available literature or online resources (CitationDyurgerov, 2002).
Methods and Results
The approach taken in this study follows four main components. First, we analyze seasonal climatic lapse rates based on 1961–1990 climate normals of meteorological stations within the study area. Second, we use topographic characterization, spatial interpolation and the lapse rate regression equations to construct cell climatologies based on elevational attributes. Third, we use a detailed glacier inventory to investigate the spatial distribution of glacial ice, and assess the normalized ice coverage (NIC) of the model cells. The final component of this study involves statistical analysis of constructed cell climatologies and NIC through both single and multivariate regression, to establish which climate variables control the distribution of glaciers in the Canadian Rockies. Sensitivity testing was conducted to determine the suitability of the discriminant analysis.
LAPSE RATE ANALYSIS
A seasonal lapse rate analysis using 30-yr climate normals was conducted to establish regression equations for temperature and precipitation based on elevation. These equations were used to develop the cell climatologies used in the final analysis of ice coverage and climate variables.
Linear regression analysis is the most common method of estimating temperature lapse rates. The suitability of a linear relationship is uncertain, as it is necessary to extrapolate lapse rates based on low-elevation station data. A nonlinear fit might better approximate temperatures, due to the release of latent heat in cloud and precipitation formation (CitationPielke and Mehring, 1977), and katabatic winds and cold air drainage (CitationBolstad et al., 1998). However, data restraints in the current study necessitate a linear lapse rate model.
Monthly temperature lapse rates are examined through linear regressions of station altitude versus average monthly temperatures. Similarities in monthly lapse rate are used to guide the construction of seasonal bins, resulting in a longer winter (NDJF) and shorter fall (SO) than standard climatological bins. Using the new seasonal bins, seasonal normals are compiled, and lapse rates calculated through regressions of average seasonal temperature versus station altitude (). All seasons show highly significant (F < 0.05) correlations between temperature and elevation, with lapse rates ranging between 4.6 and 6.0°C km−1. The lowest r2 value occurs in NDJF, and is a likely product of low-level temperature inversions commonly experienced in the winter (CitationWalker, 1961).
The spatial and temporal variability inherent in precipitation has led many researchers to examine precipitation lapse rates in mountainous terrain (e.g., CitationMarcus and Ragle, 1970; CitationStorr and Ferguson, 1972; CitationHoughton, 1979; CitationOsborn; 1984; CitationDaly et al, 1994; CitationHay et al., 1998). Precipitation amounts increase in near-linear fashion, at least up to the highest point of measurement (CitationBarry, 1973; CitationYoung, 1976), yet some suggest this could be a finite increase due to the “drying out” of the rising air mass (CitationSaunders et al., 1997). Precipitation lapse rates are also be affected by storm type, direction of flow, and local topography. Frontal cyclones are responsible for the majority of precipitation in the colder seasons in the Canadian Rockies, while convective storms dominate the summer precipitation regime (CitationWalker, 1961; CitationReinelt, 1970). Orographic precipitation is best developed where flow is strong and perpendicular to the orientation of a mountain ridge of great length and height (CitationHoughton, 1979). The dominant direction of storm tracks in the study area is perpendicular to the spine of the Canadian Rockies (CitationWalker, 1961; CitationYarnal, 1984), suggesting that a strong altitude-precipitation relationship exists, at least on the western side of the Continental Divide. Strong orographic precipitation on the eastern slopes is also known to occur in spring as cold Arctic lows traveling westward encounter the Front Ranges of the Canadian Rockies (Raddatz, 1970; CitationReinelt, 1970).
Based on the differences in synoptic precipitation controls on western (windward) and eastern (leeward) slopes, we separate stations east from west by the Continental Divide, producing a West group experiencing predominantly upslope weather (n = 41), and an East group experiencing predominantly downslope weather (n = 47). Seasonal precipitation and snowfall lapse rates are then constructed for the West and East groups, following the seasonal guidelines established for temperature.
With the exception of summer precipitation in the East group, precipitation lapse rates were all statistically significant (F < 0.05), with r2 values ranging from 0.20 to 0.63. The western side of the Continental Divide receives more precipitation than the east, and typically exhibits a higher correlation with altitude, due to the stronger orographic precipitation controls on windward slopes.
TOPOGRAPHIC CHARACTERIZATION
Using a grid system of cells measuring 0.25° × 0.5° (approximately 28 × 38 km) individual cells are clipped from the GLOBE DEM, and elevation characteristics (mean, maximum, minimum, and standard deviation) are compiled for each cell. The 0.25° × 0.5° grid is also used to clip the glacier coverage digitized from 1:50,000 topographic maps (). The coverage provides the first detailed inventory of glaciers in the Canadian Rockies, with 3271 identified glaciers having a total area of 4298 km2. We then calculate the total glaciated area of each model cell and assign a normalized ice area (NIC) value for each cell. NIC is a standardized measure of percent glacial coverage in a cell, calculated by dividing ice area by cell area, and this step was introduced to eliminate the bias introduced by the differences in cell size. Ranging from less than 0.01% to nearly 36%, the NIC values are instructive in assessing the degree of glaciation in an area.
MODEL CELL CLIMATOLOGIES
With a suite of climate normals from stations that are variable in both spatial and altitudinal distribution, the construction of model cell climatologies involves both interpolation and extrapolation. The Canadian Rockies pose a significant challenge to climate interpolation, as conditions can vary greatly between adjacent mountain ranges (CitationWalker, 1961; CitationSaunders et al., 1997). To approximate these regional differences better, a sea-level climatology is constructed by regressing station climate data to a uniform plane of reference (sea level) using the calculated climatic lapse rates. Cells straddling the Continental Divide are defined as “Transitional,” and transitional precipitation and snow lapse rates are calculated using an average of the East and West regression equations.
We next interpolate the sea-level climate values over the 0.25° × 0.5° grid system. Output sea-level values are then extrapolated back up using cell elevation attributes and the climatic lapse rates, producing a model climatology for the Canadian Rockies that reflects both altitudinal and regional differences in climate. This method was successful for reconstruction of seasonal temperature patterns (, ) due to the high correlation between temperature and altitude (). The interpolated precipitation map () reflects the higher amounts of precipitation on the western side of the Continental Divide, and highlights an altitudinal increase in precipitation. It should be noted that both snow and precipitation values were used in the analysis, as the observational difficulties associated with snowfall measurement are well documented (e.g., CitationBarry, 1992). Precipitation encompasses both rain and snowfall, and extrapolations from lower-elevation stations should provide a more reliable estimate of high-elevation snowfall than those from snowfall alone.
demonstrates the influence of colder, continental air masses on the higher elevation eastern side of the divide (e.g., Lake Louise), while a warmer, maritime influence can be observed on the lower elevation western side of the divide (e.g., Revelstoke). illustrates a sample of observed monthly station values versus values calculated from original lapse rates and those from the interpolated sea-level climatology. Interpolated temperatures are more accurate than the original extrapolations, and precipitation and snowfall values reflect regional precipitation variations.
As the cell climatologies are derived from elevation characteristics of the cells themselves, topographical controls on climate (increased precipitation and decreased temperature with elevation) are embedded in the model. In addition to cell altitude, topography influences regional glacier distribution through its differentiating effect on the receipt of solar radiation. Our study scale includes many glaciers in each cell, and likewise averages subgrid slope and aspect distributions. Our focus, therefore, is on the variance in glacial distribution that is determined by climate gradients.
Glacier Distribution–Climate Analysis
METHODS
To isolate the climate variables responsible for the observed NIC values, a multistage statistical analysis is undertaken, the goal being a predictive multivariate equation for NIC. In stage 1, univariate regressions between individual climate variables and NIC values are performed. Nonsignificant variables (see ) are removed from subsequent analysis. A covariance matrix is then constructed in stage 2, to identify variables which are highly collinear (r2 > 0.8). Using the univariate regressions performed in stage 1, collinear variables which explain the least amount of variability in observed NIC values are removed from the analysis.
In stage 3, we perform several discriminant function analyses (DFA) with the remaining climate variables to determine which variables discriminate between three classes reflecting low (x < 0.01), medium (0.01 < x < 0.07), and high (x > 0.07) NIC values. Variables failing the tolerance test (i.e., the variable is redundant) are removed from the analysis until all variables pass the tolerance test.
From the variables remaining in the DFA, multivariate regressions are performed in stage 4 to arrive at a predictive multivariate equation for NIC values. Using the t-test as a selection criterion (CitationGriffith and Amrhein, 1997), climate variables with a low significance (–1.96 < t <1.96) are removed from subsequent iterations until all variables display significance, producing regression model 1. After removing 20% of the cases at random, the regression is run again, and the prediction capabilities of model 2 are tested against the missing cases.
RESULTS AND DISCUSSION
Univariate regression results () show that the strongest correlation is between observed NIC values and average MAM snowfall, where r2 = 0.35 (significant at p = 0.05, n = 108). Large amounts of spring snowfall limit spring and summer ablation, owing to the high albedo of snow and the persistence of a deep snowpack into the summer. A large MAM snowfall therefore increases annual mass balance, which would lead to higher NIC values over time. This result stands in direct contrast to previous studies indicating that precipitation shows little or no correlation to either mass balance or equilibrium-line altitude (ELA) of glaciers in the Canadian Rockies (CitationYoung, 1981; CitationLetréguilly, 1988), but supports the conclusions of CitationBitz and Battisti (1999). Significant correlation values are also identified for minimum seasonal temperatures and minimum summer temperatures in particular. The correlation between minimum JJA temperatures and NIC has been noted by other researchers (CitationYoung, 1981; CitationLetréguilly, 1988; CitationBitz and Battisti, 1999), who linked minimum summer temperatures to the net annual balance (NAB) of Peyto Glacier. Summer months dominate ablation regimes, hence the NIC is greatest (lowest) where summer temperatures are lowest (highest). The relatively low overall correlation values demonstrate that a single climate variable cannot satisfactorily explain the observed distribution of glacial ice. Of note is the fact that for precipitation variables, average cell climatologies display higher correlations than either maximum or minimum. The success of the sea-level interpolation is reflected in this observation, as cells with the highest maximum elevation are not necessarily the most correlated with glacier ice.
Other significant correlations between climate and glacier distributions include winter (NDJF) and summer (JJA) precipitation. In a study of the synoptic conditions of the Canadian Rockies, CitationYarnal (1984) concluded that large-scale cyclonic disturbances best explained the variance observed in the net winter balance of Peyto Glacier, while the work of CitationMcCabe and Fountain (1995) and CitationMcCabe et al. (2000) demonstrated that winter 700-mb height anomalies correlate with winter mass balances.
While summer snowfall shows no correlation to NIC, this is a likely result of the unavoidable bias towards low-lying stations that existed in the construction of climatic lapse rates. Snowfall is common at higher elevations the Rockies in the summer, yet not recorded by lower-elevation stations. Hence, summer precipitation becomes a proxy for high-elevation snowfall, and the correlation suggests that this could be a powerful control on glacier distributions.
Discriminant analysis with 18 noncollinear climate variables produces two canonical functions which explain 87.3% (Function 1; significant at F = 0.05) and 12.7% (Function 2; not significant at F = 0.05) of the observed variance between groups. The highest absolute correlation between the climate variables and the discriminant function occurs for average MAM precipitation and Function 1 (). Function 1 is also weighted heavily towards minimum JJA temperatures, average NDJF precipitation, average JJA precipitation, and average annual temperatures, reinforcing the observations of the univariate regressions. The canonical functions correctly predicts group membership for 72.2% of the 108 cases, and the all groups scatter plot of individual cases against their Function 1 and Function 2 scores () demonstrates the strong clustering exhibited by the different classed cells.
Variables used in the discriminant function analysis are entered into the multivariate regression stage, and removal of nonsignificant (−1.96 < t < 1.96) climate variables reduces the total number of variables to 5. Using average MAM temperature, average MAM precipitation, maximum MAM snowfall, average NDJF snowfall, and average annual temperatures to predict NIC values, regression model 1 (all cases) has r2 = 0.67 (significant at p = 0.05, n = 108). Confidence intervals are constructed using the standard error of the estimate (, ). To test the predictive capabilities of the regression model, 22 data points are removed from the dataset, and the multiple regression re-run with the same climate variables. Correlation coefficients from regression model 2 are then applied to the 22 cases removed from the analysis, and predicted values are compared with observed (). The model underpredicts large NIC values and slightly overpredicts small NIC values, but at the average NIC of 0.041, model performance is optimal. Several cases were predicted to contain no ice at all, suggesting that at several sites in the Rockies, glacier systems are either asynchronous with their respective climate systems, or are regulating their existence through local climate modifications.
SENSITIVITY ANALYSIS
To validate the regression model further, a sensitivity analysis was conducted to examine how well the model can estimate previously known ice extents. Little Ice Age (LIA) moraines have been studied throughout the Rockies, and CitationLuckman (2000) suggests that glaciated area at the LIA maximum was 25% greater than the current extent, while others estimate an areal decrease of 15 to 80% between 1918 and 1988 (CitationMcCarthy and Smith, 1994). Temperature reconstructions of the period estimate decreases of 0.4 to 0.9°C (CitationReasoner and Jodry, 2000) and 1.04°C from 1961–1990 normals, with a slight decrease in precipitation (CitationLuckman, 2000). Temperature changes of 0.4, 0.9, and 1.4°C and precipitation changes of 2, 5, and 10% are applied to the multivariate regression model (). While it is difficult to compare the sensitivities of a percentage change in precipitation variables and a fixed change in temperature variables, temperature appears to be the more sensitive component. A 25% decrease in ice area results from a temperature decrease of 0.4°C and a precipitation decrease in precipitation, presenting implications for Cordilleran ice sheet modeling efforts (CitationMarshall and Clarke, 1999). All LIA climate scenarios produce results that are well within the large range cited by CitationMcCarthy and Smith (1994), demonstrating the validity of the model, but also suggesting the need for further improvements in estimates of LIA glacier extents.
Alpine regions are predicted to be acutely sensitive to climate change due to the snow-albedo feedback effect—warmer temperatures would decrease snow accumulations, leading to earlier and increased summer heating, and further melting of glaciers and snowpacks. CitationFyfe and Flato (1999) suggest that the upper reaches of the Rockies could see temperature increases on the order of 10°C under CO2 doubling scenarios as a result of this feedback. Modeling results from CitationHall and Fagre (2003) indicate that the disappearance of glaciers from Glacier National Park (Montana) can be expected by AD 2030 under Intergovernmental Panel on Climate Change (IPCC) predictions. It can be seen from the sensitivity analysis () that a temperature increase of only 1.4°C could result in the virtual elimination of glaciers in the Canadian Rockies, with consequences for the hydrology and ecology of all glacier-fed streams and rivers. Analysis of future glacial extents should be attempted given a detailed regional analysis of future climate change, such as that provided by the Western Canadian Regional Climate Model (CitationLaprise et al., 1998).
Conclusions
A simple cell-based climatology of the Canadian Rockies is modeled from temperature, precipitation and snowfall lapse rates constructed from 1961–1990 climate normals, and elevation attributes extracted from a 1-km DEM. Glaciers in the Canadian Rockies are digitized at a scale of 1:50,000, and fractional glacierized areas (NIC values) are calculated for the 0.25° × 0.5° model cells. Single- and multivariate statistical analyses are then performed to determine the climatic variables controlling the spatial distribution of glaciers in the Rockies.
Univariate regression, discriminant analysis, and multivariate regression conclusively demonstrate that average spring (MAM) precipitation is a dominant control on observed distribution of glaciers in the Canadian Rockies. Other influences include minimum summer temperatures, average annual temperatures, winter precipitation, and minimum spring temperatures. Summer precipitation is also identified as an important factor, as it serves as a proxy for high-elevation snowfall which dramatically retards summer ablation.
The findings of this study suggest that future increases in temperature could be partially offset by increases in spring precipitation. A dramatic increase in spring precipitation could potentially lead to positive mass balances and the growth of glaciers and icefields. Sensitivity analysis of the model contributes to a validation of the results, as a −0.4°C temperature change and a 10% decrease in precipitation corresponds to a 25% increase in glaciated area, which resonates with values cited in the literature. The study also presents a methodology for other areas of glaciohydrogical interest, and for regional- or continent-scale modeling of glacier distributions and their sensitivity to climate change.
FIGURE 1. Study area map displaying1:50,000 digitized ice coverage (blue); location of climate stations used in lapse rate analysis; GLOBE DEM of the region; and locations of places named in the text
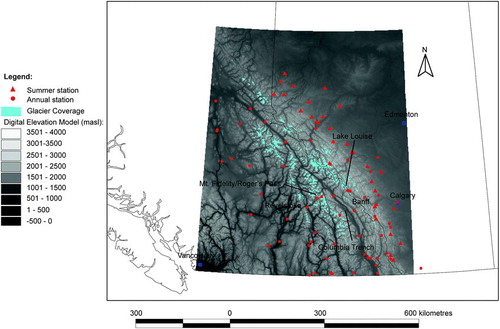
FIGURE 2. Sample model-cell climatology of (a) total summer (JJA) precipitation constructed from calculated lapse rates and cell elevations and (b) average summer (JJA) temperature reconstructed from sea-level interpolation. Also shown for comparison are climographs of stations used in the analysis. The model cell climates reflect regional (e.g., East-West) precipitation differences as well as the presence of large ice areas which affect the temperature interpolations (e.g., the Columbia Trench is observed as the line of warmer cells trending NW-SE through the study area [see for ice locations])
![FIGURE 2. Sample model-cell climatology of (a) total summer (JJA) precipitation constructed from calculated lapse rates and cell elevations and (b) average summer (JJA) temperature reconstructed from sea-level interpolation. Also shown for comparison are climographs of stations used in the analysis. The model cell climates reflect regional (e.g., East-West) precipitation differences as well as the presence of large ice areas which affect the temperature interpolations (e.g., the Columbia Trench is observed as the line of warmer cells trending NW-SE through the study area [see Fig. 1 for ice locations])](/cms/asset/81c05588-facf-410c-9bbe-cf2babb078b6/uaar_a_11956996_f0002.jpg)
FIGURE 3. Station climate normals (1961–1990) for Mt. Fidelity (West) and Banff (East) compared with original lapse rate cell climatology and interpolated sea-level up cell climatology (see text for methodology). For station locations, see . Interpolated values better approximate cell temperatures than original regressions, and improve both snowfall and precipitation estimations
FIGURE 4. All-cases plot of canonical function scores for model cells, from final discriminant function analysis (no variables failing tolerance test). Strong clustering around centroids illustrates strength in categorizing cells of differing glacial coverage based on climate indices weighted towards spring precipitation (canonical function 1) and summer temperatures (canonical function 2)
FIGURE 5. All-cases multivariate regression results (a), with best-fit line, 95% confidence intervals, and 1:1 line. The regression model appears to overestimate smaller NIC values while underestimating higher NIC values. (b) illustrates estimated NIC values for 22 cases randomly removed from the regression analysis
TABLE 1 Lapse rate analysis summary, significant correlations (P = 0.05) shown in bold. For discussion of lapse rates, see text
TABLE 2 Correlation (r2) matrix for single variate analysis of normalized ice coverage values and constructed cell climatologies (average, maximum and minimum based on cell elevations). Significant correlations (P = 0.05, n = 108) shown in bold
TABLE 3 Structure matrix of the canonical functions derived from multivariate analysis. Values shown are correlations between selected parameters and each function. Variables included in the analysis are those of equal covariance
TABLE 4 Multivariate model summaries for Model 1 (all cases) and Model 2 (22 cases randomly excluded). The standard error of the estimate is large, as reflected by the 95% confidence intervals constructed for the sensitivity analysis, but model predictions are well within current and historical ranges
TABLE 5 Sensitivity analysis results, displayed as a percentage change from original average NIC and total glacier area. For example, a 1.4°C increase in temperature could result in a decrease of 97% in average NIC values, while total area could decrease by 57% (heavily glaciated cells contribute more to total glacier area than to average NIC). In the analysis, any cells that displayed negative NIC or area values were assigned a value of zero (hence lower 95% confidence interval is smaller than upper 95% interval)
Acknowledgments
Topographic maps were generously loaned to the authors by the University of Calgary Map Library, and GIS support was provided by the Department of Geography, University of Calgary. The authors would like to thank Andrew Fountain and an anonymous reviewer for their comments on the initial manuscript. This work was supported by an NSERC USRA award to J. Shea, and an NSERC grant to S. Marshall.
References Cited
- Atmospheric Environment Service, Canada, 1993. Canadian Climate Normals, 1961–1990 [CD].
- Barry, R. G. 1973. A climatological transect on the east slope of the Front Range, Colorado. Arctic and Alpine Research 5:89–110.
- Barry, R. G. 1992. Mountain Weather and Climate. 2nd ed. New York: Routledge. 402 pp.
- Bitz, C. M. and D. S. Battisti . 1999. Interannual to decadal variability in climate and the glacier mass balance in Washington, Western Canada, and Alaska. Journal of Climate 12:3181–3196.
- Bolstad, P. V. , L. Swift , F. Collins , and R. F. Réginiere . 1998. Measured and predicted air temperatures at basin to regional scales in the southern Appalachian Mountains. Agricultural and Forest Meteorology 91:161–176.
- Daly, C. , R. P. Neilson , and D. L. Philips . 1994. A statistical-topographic model for mapping climatological precipitation over mountainous terrain. Journal of Applied Meteorology 33:140–158.
- Demuth, M. N. and R. Keller . 1997. An assessment of the mass balance of Peyto Glacier (1966–1995) and its relation to recent and past-century climatic variability. National Hydrology Research Institute Contribution Series CS-97007. 43 pp.
- Dyurgerov, M. 2002. Glacier mass balance and regime: Data of measurements and analysis. Meier, M. and Armstrong, R. (eds.), University of Colorado, Institute of Arctic and Alpine Research, Occasional Paper, 55. various paging, CD-ROM.
- Environment Canada, 2001. Canadian Climate Normals 1961–1990 [online]. Available http://www.msc-smc.ec.gc.ca/climate/climate_normals/index_e.cfm [July 26, 2001].
- Fyfe, J. and G. Flato . 1999. Enhanced climate change and its detection over the Rocky Mountains. Journal of Climate 12:230–243.
- GLOBE Task Team and others (Hastings, D. A., Dunbar, P. K., Elphingstone, G. M., Bootz, M., Murakami, H., Maruyama, H., Masaharu, H., Holland, P., Payne, J., Bryant, N. A., Logan, T. L., Muller, J-P., Schreier, G., and MacDonald, J. S.), eds., 1999: The Global Land One-kilometer Base Elevation (GLOBE) Digital Elevation Model, Version 1. 0. National Oceanic and Atmospheric Administration, National Geophysical Data Center, 325 Broadway, Boulder, Colorado 80303, U.S.A. Digital data base on the World Wide Web (www.ngdc.noaa.gov/seg/topo/globe.html) and CD-ROMs.
- Griffith, D. A. and C. G. Amrhein . 1997. Multivariate Statistical Analysis for Geographers. Upper Saddle River, NJ: Prentice-Hall. 345 pp.
- Hall, M. H P. and D. B. Fagre . 2003. Modeled climate-induced glacier change in Glacier National Park, 1850–2100. BioScience 53:131–140.
- Hare, F. K. and J. E. Hay . 1974. The climate of Canada and Alaska. In Bryson, R. A. and Hare, F. K. (eds.), Climates of North America. (World Survey of Climatology, Vol. 11.) Amsterdam: Elsevier Scientific, 49–192.
- Hay, L. , R. Viger , and G. McCabe . 1998. Precipitation interpolation in mountainous regions using multiple linear regression. Hydrology, Water Resources and Ecology in Headwaters. IAHS Publication 248:33–38.
- Hastings, D. A. and P. K. Dunbar . 1999. Global Land One-kilometer Base Elevation (GLOBE) Digital Elevation Model, Documentation, Volume 1.0. Key to Geophysical Records Documentation (KGRD) 34. National Oceanic and Atmospheric Administration, National Geophysical Data Center, 325 Broadway, Boulder, Colorado 80303, U.S.A.
- Hodge, S. M. , D. C. Trabant , R. M. Krimmel , T. A. Heinrichs , R. S. March , and E. G. Josberger . 1998. Climate variations and changes in mass of three glaciers in western North America. Journal of Climate 11:2161–2179.
- Houghton, J. G. 1979. A model for orographic precipitation in the north-central Great Basin. Monthly Weather Review 10:1462–1475.
- Laprise, R. , D. Caya , M. Giguère , G. Bergeron , H. Côté , J-P. Blanchet , G. J. Boer , and N. A. McFarlane . 1998. Climate and climate change in Western Canada as simulated by the Canadian Regional Climate Model. Atmosphere-Ocean 36:2 119–167.
- Letréguilly, A. 1988. Relation between the mass balance of western Canadian mountain glaciers and meteorological data. Journal of Glaciology 34:116 11–18.
- Luckman, B. 2000. The Little Ice Age in the Canadian Rockies. Geomorphology 32:357–384.
- Marcus, M. G. and R. H. Ragle . 1970. Snow accumulation in the Icefield Ranges, St. Elias Mountains, Yukon. Arctic and Alpine Research 2:277–292.
- Marshall, S. J. and G. K C. Clarke . 1999. Ice sheet inception: subgrid hypsometric parameterization of mass balance in an ice sheet model. Climate Dynamics 15:533–550.
- McCabe, G. J. and A. G. Fountain . 1995. Relations between atmospheric circulation and mass balance of South Cascade Glacier, Washington, U.S.A. Arctic and Alpine Research 27:226–233.
- McCabe, G. J. , A. G. Fountain , and M. Dyurgerov . 2000. Variability in winter mass balance of Northern Hemisphere glaciers and relations with atmospheric circulation. Arctic, Antarctic, and Alpine Research 32:64–72.
- McCarthy, D. P. and D. J. Smith . 1994. Historical glacier activity in the vicinity of Peter Lougheed Provincial Park, Canadian Rocky Mountains. Western Geography 4:94–109.
- Meier, M. F. and W. V. Tangborn . 1965. Net budget and flow of South Cascade Glacier, Washington. Journal of Glaciology 5:41 547–566.
- Moore, R. D. and M. N. Demuth . 2001. Mass balance and streamflow variability at Place Glacier, Canada, in relation to recent climate fluctuations. Hydrological Processes 15:2473–3486.
- Natural Resources Canada, Canada Centre for Mapping. 1:50,000 topographic map sheets (and date of publication): 82 J11 (1996); 82 J12 (1996); 82 J13 (1996); 82 K9 (1996); 82 N1 (1996); 82 N2 (1996); 82 N3 (1996); 82 N7 (1996); 82 N8 (1996); 82 N9 (1996); 82 N10 (1996); 82 N11 (1996); 82 N12 (1996); 82 N13 (1996); 82 N14 (1996); 82 N15 (1996); 82 N16 (1996); 82 O5 (1996); 82 O12 (1996); 83 C2 (1996); 83 C3 (1996); 83 C4 (1996); 83 C5 (1996); 83 C6 (1996); 83 C7 (1996); 83 C10 (1996); 83 C11 (1996); 83 C12 (1996); 83 C13 (1996); 83 C14 (1996); 83 D8 (1996); 83 D9 (1996); 83 D15 (1996); 83 D16 (1995); 83 E1 (1996); 83 E2 (1996); 83 E3 (1996); 83 E5 (1996); 83 E7 (1996); 93 I13 (1989). Ottawa.
- Ommanney, C. S L. 2001. Glaciers of the Canadian Rockies. In Williams, R. S. and Ferrigno, J. G. (eds.), Satellite Image Atlas of Glaciers of the World. U S Geological Survey Professional Paper 1386-J-1.
- Osborn, H. B. 1984. Estimating precipitation in mountainous regions. Journal of Hydraulic Engineering 110:1859–1863.
- Paterson, W. S B. 1994. The Physics of Glaciers. 3rd ed. Tarrytown, NY: Pergamon Press. 480 pp.
- Pielke, R. A. and P. Mehring . 1977. Use of mesoscale climatology in mountainous terrain to improve the spatial representation of mean monthly temperatures. Monthly Weather Review 105:108–112.
- Raddatz, R. L. 1975. Late spring upslope weather on the Canadian Western Plains: a mesoscale numerical simulation. Unpublished M.Sc. thesis, University of Alberta. 87 pp.
- Reasoner, M. A. and M. A. Jodry . 2000. Rapid response of alpine timberline vegetation to the Younger Dryas climate oscillation in the Coloardo Rocky Mountains, USA. Geology 28:51–54.
- Reinelt, E. R. 1970. On the role of orography in the precipitation regime of Alberta. Albertan Geographer 6:45–58.
- Saunders, I. R. , D. S. Munro , and W. G. Bailey . 1997. Alpine environments. In Bailey, W. G., Oke, T., and Rouse, W. (eds.), The Surface Climates of Canada.. Montreal: McGill-Queen's University Press, 224–246.
- Sawyer, J. S. 1956. The physical and dynamical problems of orgraphic rain. Weather 11:375–381.
- Storr, D. and H. L. Ferguson . 1972. The distribution of precipitation in some Mountainous Canadian watersheds. In: Distribution of Precipitation in Mountainous Areas: Vol. II. WMO Publication No. 243–263.
- Surveys and Mapping Branch, Department of Mines, Energy and Resources, Government of Canada. 1:50,000 topographic map sheets, 1969–1986, Ottawa.
- Surveys and Mapping Branch, Department of Mines, Energy and Resources, Government of Canada. 1:50,000 topographic map sheets (and year of publication): 82 F14 (1981); 82 F16 (1981); 82 J6 (1977); 82 K1 (1979); 82 K2 (1979); 82 K3 (1979); 82 K6 (1979); 82 K7 (1979); 82 K8 (1979); 82 K10 (1979); 82 K11 (1978); 82 K12 (1978); 82 K13 (1979); 82 K14 (1979); 82 K15 (1979); 82 L1 (1991); 82 L8 (1991); 82 L9 (1974); 82 L16 (1975); 82 M1 (1978); 82 M2 (1979); 82 M7 (1980); 82 M8 (1980); 82 M9 (1980); 82 M10 (1980); 82 M11(1979); 82 M14 (1980); 82 M15 (1980); 82 M16 (1980); 82 N4 (1980); 82 N5 (1980); 82 N6 (1980); 82 O4 (1979); 83 D1 (1980); 83 D2 (1986); 83 D4 (1980); 83 D5 (1980); 83 D6 (1980); 83 D7 (1980); 83 D10 (1986); 83 D11 (1980); 83 D12 (1986); 83 D13 (1986); 83 D14 (1986); 83 E4 (1981); 83 E6 (1981); 93 A7 (1973); 93 A8 (1973); 93 A9 (1974); 93 A10 (1973); 93 A15 (1982); 93 A16 (1982); 93 E2 (1984); 93 E3 (1984); 93 E4 (1984); 93 E5 (1979); 93 E6 (1980); 93 E7 (1984); 93 H1 (1981); 93 H2 (1981); 93 H7 (1975); 93 H8 (1975); 93 H11 (1975); 93 H15W (1964); 93 H15E (1964); 93 H16 (1975); 93 I1 (1986); 93 I2 (1986); 93 I3 (1989); 93 I6 (1989); 93 I7 (1986); 93 I11 (1984); 93 O1 (1981); Ottawa.
- Trenberth, K. E. and J. W. Hurrell . 1994. Decadal atmosphere-ocean variations in the Pacific. Climate Dynamics 9:303–319.
- Walker, E. R. 1961. A Synoptic Climatology for Parts of the Western Cordillera. Arctic Meteorology Research Group, McGill University, Montreal, Publication in Meteorology No. 35. 218 pp.
- Yarnal, B. 1984. Relationships between synoptic-scale atmospheric circulation and glacier mass balance in south-western Canada during the International Hydrological Decade, 1965–74. Journal of Glaciology 30:105 188–198.
- Young, G. J. and A. D. Stanley . 1976. Canadian Glaciers in the International Hydrological Decade, 1965–1974, no. 4. Peyto Glacier, Alberta—summary of measurements. Canada Inland Waters Directorate Scientific Series (1972): 71 pp.
- Young, G. J. 1981. The mass balance of Peyto Glacier, Alberta, Canada, 1965 to 1978. Arctic and Alpine Research 13:307–318.