Abstract
Ice elevation changes since 1975 and ice areal changes since 1945 of glaciers in the southeastern part of the Southern Patagonia Icefield (SPI) are presented. Comparison of digital elevation models, GPS, and optical survey data revealed high thinning rates for all the ablation areas of the glaciers, with average values between 1.4 and 3.4 m a−1 and maximum ice thinning of 7.6 m a−1. Ice elevation changes for the glacier accumulation areas were smaller than the estimated errors, and no significant trends could be detected. All the glaciers are retreating and shrinking considerably, with a total areal loss of 62.2 km2, which represents 8% of the total ice area of 1945. This trend is in agreement with other similar measurements carried out during recent decades for several glaciers of the SPI. The high thinning rates for the ablation areas of the SPI have been primarily interpreted as a result of the increase in temperature observed in the region, however, this warming trend is not large enough to account for all the ice thinning, indicating that dynamic factors could be important, especially in glaciers which have been thinning dramatically, allowing frontal calving fronts to reach nearly floating conditions. More measurements are needed to test and validate dynamic hypotheses related to glacier behavior in Patagonia.
Introduction
The Southern Patagonia Icefield (SPI) is the largest ice field in the Southern Hemisphere outside Antarctica. It extends north-south for 350 km between 48°20′S and 51°30′S, at an average longitude of 73°30′W () (CitationCasassa et al., 2002). The SPI has been divided into 48 main glacier basins (CitationAniya et al., 1996), which flow from a maximum altitude of 3600 m a.s.l. in the Patagonian Andes to the east and west, generally terminating with calving fronts in freshwater lakes (east) and Pacific Ocean fjords (west). In the accumulation area the outlet glaciers share a vast and relatively flat plateau with an average altitude of about 1600 m. The equilibrium-line altitude (ELA) of most of the glaciers is located between 900 and 1200 m a.s.l. with an average accumulation Area ratio (AAR) of 0.68 for the 48 main glaciers of the SPI (CitationAniya, 1999).
Most of the glaciers have been retreating very rapidly (CitationAniya et al., 1997), with high thinning rates during recent decades (CitationRivera et al., 2002). Although several field campaigns have been undertaken to the lower reaches of the SPI, much basic research remains to be done, especially with respect to the mass balance, and more particularly, the characteristics in the upper accumulation area. Field campaigns to the accumulation areas have concentrated at Glaciar Chico (CitationRivera and Casassa, 2002) and Glaciar Tyndall in Chile (CitationShiraiwa et al., 2002), and at Glaciar Perito Moreno in Argentina (CitationAristarain and Delmas, 1993) (). In these areas, several direct mass-balance measurements have been undertaken, but the wider application of such measurements is limited, due to the large spatial variations in the accumulation and ablation.
One of the methods to account for the mass balance in remote areas which are logistically difficult to access is based upon the generation and comparison of digital elevation models (DEMs) for different dates, the so-called geodetic method (CitationKrimmel, 1999). For that purpose, remotely sensed data obtained from photogrammetric restitution, laser altimetry, or radar imagery provide the best quality and most reliable sources of information. In Patagonia, the availability of these data is very limited as described in the following section.
The comparison of DEMs can be accurate in specific areas, where the contour lines have been generated from large amounts of ground control data and where the cover of aerial photographs allows for adequate stereoscopic vision. The application of this method requires an error assessment, in order to determine in detail the accuracy of the results (CitationMennis and Fountain, 2001). For this purpose, analysis of the ice-free areas around the glaciers provides control (CitationKrimmel, 1999).
The aim of this paper is to compare the existing regular cartography (1975 and 1995), GPS, and optical elevation data from the southeastern part of the SPI, in order to estimate the difference in elevation for several glaciers at different epochs. These results are compared with the frontal and areal variations of the glaciers.
Study Area
The southeastern part of the SPI is considered in this paper (), including most of the glaciers of National Park Torres del Paine in Chile (NPTP), and one glacier located at National Park Los Glaciares in Argentina (Glaciar Frías, ). These glaciers drain to the Pacific Ocean, with the exception of Glaciar Frías, which is located in the continental watershed divide. Most of the glaciers are part of the SPI, but Glaciar Olvidado, Los Perros, Ohnet, and U-2 are separated from the main icefield by mountain ranges free of ice ().
Data Sets
CARTOGRAPHIC DATA
With aerial photographs from 1975, the Instituto Geográfico Militar (IGM) of Chile made the first regular cartography of the study area at 1:50,000 scale using photogrammetric procedures. This cartography was published in the 1980s and no restrictions apply for use of the data (). With aerial photographs from 1995, IGM compiled a second regular cartography of almost the same area at 1:50,000 scale (). The emphasis was to cover with contour lines those areas with poor stereoscopic vision in the 1975 aerial photographs. This cartography has not yet been published, but IGM permitted restricted access to data from the southeastern part of the SPI.
Much of the area with regular cartography coverage lies within the NPTP, from where the IGM had some logistical facilities to access the SPI and obtain a few geodetic-quality ground GPS during the 1990s. These GPS points are now part of the National Geodetic Network of Chile, providing an adequate geographic control on the cartography.
REMOTELY SENSED DATA
CitationNaruse and Aniya (1992) used preliminary cartography of the IGM at a 1:250,000 scale from 1956 as ground truth for compiling and mosaicing two and a quarter consecutive Landsat Thematic Mapper (TM) satellite images at 30-m resolution, acquired in 14 January 1986. This Landsat mosaic was the basis for completing the first glacier inventory for SPI (CitationAniya et al., 1996).
Two Landsat ETM+ images obtained from the United States Geological Survey (USGS), acquired on 27 October 2000 (Path/Row 231/95 and 231/96) at a resolution of 28.5 m were geometrically corrected using the provided orbital parameters and mosaiced together using the available regular cartography of the IGM of 1975.
One ASTER image acquired on 12 January 2003 (granule ID ASTL1A 0301121450400301280345) at 15-m spatial resolution was obtained from the USGS, EROS data center. This image covers only a few lower glaciers, but the main plateau of the SPI is completely cloudy.
AERIAL PHOTOGRAPHS
Several aerial photographs were used for estimating glacier variations (). Most of the photos (with the exception of SAF-1995 acquired in autumn) were obtained at the end of the Southern Hemisphere summer, which corresponds to the minimum snow cover in the area.
HISTORICAL DATA
A few historical records are available from explorers and local inhabitants, who visited the lower glacier tongues of the study area during the first half of the 20th century. Some explorers took photographs of the glaciers, especially of Glaciares Grey and Dickson. CitationDe Agostini (1945), who visited most of the SPI during several climbing expeditions, acquired most of the pre-1945 photographs of the study area. A few older photographs of Glaciar Dickson are available as well from 1897 (CitationGallois, 1901).
FIELD DATA
The area has been visited many times by the authors during recent years. In November of 1998 Glaciares Dickson and Frías were visited, allowing ground GPS measurements with topographic-quality GPS receivers Trimble Geoexplorer II single frequency in C/A code mode, yielding 1 to 5 m precision after applying differential correction. In March 1999, topographic measurements were carried out with a Wild theodolite (TC1600) equipped with infrared distance-measuring instrument (Wild Di-1600) on Glaciar Tyndall. Water depths were measured on Lago Grey in November 2000, from a large boat using an acoustic echo sounder with a maximum penetration range of 500 m.
Methods
DEM AND OTHER TOPOGRAPHIC DATA GENERATION
Digital Elevation Models were generated by interpolation of contour lines digitized from the available regular cartography of the IGM. Due to the differences in datum between both sets of topographic data, it was necessary to convert the 1975 SAD 69 data to WGS 1984, based upon CitationNIMA (1997) standard values.
No error estimations for the cartography of 1975 and 1995 were obtained from the IGM. The regular cartography at 1:50,000 scale is considered class 1 accuracy, in terms of the American Society for Photogrammetry and Remote Sensing classification (CitationFalkner, 1995). That means that this cartography is the most stringent, with vertical inaccuracies related to the contour interval, yielding an RMS error of 17 m (based upon 50-m contour interval used by the IGM) for each regular cartography.
Three interpolation methods were applied in order to select the best-fit method: Inverse Distance Weighing (IDW), Triangulated Irregular Network (TIN), and TOPOGRID (a discretized thin plate spline technique available with commercial software Arc-Info version 8.0.1).
To estimate the RMS error of each interpolation method, a jack-knifing procedure was employed (CitationLythe et al., 2001). The best-fit DEM was obtained using TOPOGRID, yielding an error of 9 m for each DEM.
To account for the combined vertical error of the DEMs, rock areas were compared between 1975 and 1995, resulting in an RMS error of ∼26 m. Horizontal errors are related to contour inaccuracy, datum correction, digitization of contour lines and contour line generation, yielding 50 m at the most.
The data acquired using topographic-quality GPS receivers in 1998 were differentially corrected, allowing estimation of a vertical error of 5 m (). Optical measurements were less accurate than the above GPS values, due to visibility problems and long distances (between 500 to 4700 m) from the rock control point (“Alpha” in ) to each point on the surface of the glacier.
ICE ELEVATION CHANGES
The differences in altitude between data sets were obtained arithmetically. To avoid any interference from the areas without data or without stereoscopic vision, Boolean masks were generated to define areas of interest. To eliminate anomalous values, a histogram analysis was carried out, in order to select the pixels with values above and below three standard deviations. These pixels represent the extreme variations between DEMs and were not included in the analysis. A median filter was applied to reduce noisy data.
GLACIER EXTENT CLASSIFICATION
Both Landsat satellite image mosaics (1986 and 2000) and the ASTER image (2003) were geolocated using the regular IGM cartography at 1:50,000 scale by applying a linear nearest neighbor method. A final horizontal RMS error of 45 m was obtained for each Landsat mosaic, and 28 m for the ASTER image.
Once the satellite images were geolocated, two classification procedures were applied to account for the glacier extent. A color composite image was produced from Landsat TM and ETM+ bands 1, 4, and 5, with a histogram-equalized stretch. The same procedure was applied to the ASTER image, using bands 1, 2, and 3 Nadir.
The histogram analysis of the Landsat TM and ETM+ images ratio band 4 to band 5 (CitationPaul et al., 2002) were used to classify the study area, in terms of glacier extent, ice-free areas and lakes. To reduce the large number of small pixel areas (speckled noise) unconnected with the main units generated by the histogram analysis, a mode filter was applied.
The ELA for each glacier was estimated based upon the previous studies of CitationAniya et al. (1996) and CitationRivera et al. (2000).
FRONTAL AND AREAL VARIATIONS
The determination of the variation in each glacier front was achieved mainly through stereoscopic vertical aerial photographs. The information obtained was transferred with a Zoom Transfer Scope to the regular cartography, with ice fronts being digitally compared to the satellite image mosaics. All glacier limits were analyzed using GIS commercial software, allowing an accurate estimation of areas and frontal changes. Frontal changes were determined as average distance between two different positions of the glacier front. In some cases the glacier tongue was divided in different arms to allow for a more accurate determination of frontal changes.
Results
FRONTAL VARIATIONS
Glaciares Dickson and Cubo
The lower end of Glaciar Dickson has two terminal tongues. The main one is mainly bare ice, which has been continuously flowing to the south and calving into Lago Dickson. The second arm which flows to the east had a noncalving partially debris covered ice front until the 1980s, where it received a northern tributary named Glaciar Cubo, before ending in a moraine belt in the junction with Glaciar Frías ().
The southern tongue of Glaciar Dickson has been retreating since 1897, when CitationGallois (1901) took a first panoramic photograph of the glacier. The position of the glacier in that time corresponds closely with a prominent moraine belt and associated trimline detected on the field, which can be assigned to the Little Ice Age (LIA) if we allow correlation with the dates obtained by CitationMarden and Clapperton (1995) for the moraines on Glaciar Grey. This means the glacier was more or less stable without any significant retreat or advance between the LIA and 1897.
The southern arm has been calving since 1897, with the exception of 1945 when two small islands appeared at the terminus of the glacier. The retreat reached maximum values between 1975 and 1986.
The eastern arm of the glacier was in 1975 partially debris covered. This tongue started calving into a proglacial lake located at the junction between Glaciares Dickson, Cubo, and Frías, sometime between 1975 and 1982. In 1982 a jökulhlaup evacuated a huge amount of water presumably from this proglacial lake to Lago Dickson, destroying bridges and facilities of the NPTP farther downstream (CitationPeña and Escobar, 1985). Between 1986 and 1995, the lower end of the eastern arm of the glacier collapsed into the proglacial lake (). In 1998 the proglacial lake joined main Lago Dickson through a water corridor between the ice wall and the opposite steep rock flank (Cerro Daudet). This corridor is easily blocked by icebergs floating in the lake (). In January 2003 (ASTER image), the eastern front had completely collapsed into the proglacial lake and thus the eastern arm effectively disappeared ().
Once the lower end of the eastern arm of Glaciar Dickson began to detach from the moraine belt located at the junction with Glaciar Frías (1975 to 1982), the northern tributary was clearly visible as a separate glacier, which has been unofficially named Glaciar Cubo. Glaciar Cubo has an ice front which is partially calving into the proglacial lake where it has been slightly retreating since 1986. The rest of the lower tongue of Glaciar Cubo was still in contact with the moraine belt of Glaciar Frías in 2003. Nevertheless, new proglacial lagoons have been generated in the north eastern edge of Glaciar Cubo, which probably will join with Lago Dickson in the near future ().
Glaciar Frías
Glaciar Frías has experienced completely different behavior during the 20th Century, largely because its lower ablation area is mainly debris covered. Clear trimlines and moraines which are approximately 200 m above the present ice surface can be clearly seen in aerial photographs and in the field. Following the case for Glaciar Dickson, we also estimate that these moraines correspond to the LIA (CitationMarden and Clapperton, 1995). By 1945 the front of Glaciar Frías had not substantially separated from the LIA moraines. Between 1945 and 1986 the lowest debris covered area of the glacier was progressively transformed into an ice-cored moraine, covered by big boulders and smaller deposits. Between 1986 and 1995, two proglacial lakes appeared at the eastern front of the glacier, in areas previously occupied by debris-covered ice and ice-cored moraines. These two lakes have been growing since 1995, due to the calving retreat of the glacier. In 1998 observations carried out on the field allowed detection of many water streams flowing at the surface of the debris covered area, as well as proglacial lagoons, moulins, and other typical features indicating active melting (), which suggest that the lower eastern debris covered arm of the glacier is collapsing into a new proglacial lake.
The glacier has been contributing melt water to Lago Argentino since the LIA. Nevertheless, in 1998 and in the satellite images of 2000 and 2003 () a strong dissection of the moraine belt which separates this glacier from Lago Dickson was observed. This process is due to evacuation of melt water from Glaciar Frías to the west through a large glacier stream. As a result the continental watershed divide between the Atlantic and Pacific oceans is now located within the glacier.
Glaciar Olvidado, Los Perros, Ohnet, and U-2
Glaciar Olvidado is a small glacier north of Cordillera del Paine, separated from the SPI by a nonglaciated mountain range. The glacier has two fronts, the main one being located at the southern front, where the glacier has been retreating since 1975. It has been partially calving in a proglacial lake since 1986 (). This lake was expanding until 2000, when it was full of icebergs. The second and minor front is noncalving, being in fact an outflow of the eastern margin, located at an altitude of 700 m, where the glacier is flowing to the east into a lateral valley. The eastern front was calving into Lago Escondido in 1975 at an altitude of 540 m a.s.l., and then retreated at high rates until 1986. Both fronts have been retreating at small rates since 1986. Between 2000 and 2003, the southern front suffered a dramatic retreat and an associated expansion of the lake. The eastern front did not show any significant change in the last period ().
Glaciar Los Perros is flowing to the north from Cerro Paine Grande, to a lagoon where the lower tongue is calving. The lagoon has a frontal moraine with a well-developed trim line, which presumably corresponds to the LIA. The glacier has been retreating slightly since 1975 ().
Apart from the main calving glaciers of the study area, some smaller glaciers exist in the surroundings of the SPI as well as on the mountain slopes of large peaks of the NPTP, such as Cerro Paine Grande (3248 m a.s.l.). Most of these smaller glaciers have been retreating since 1975, like Ohnet and U-2 (), both of which do not have calving fronts ().
Glaciar Grey
The lower tongue of Glaciar Grey is composed of two fronts () calving into Lago Grey. Between them, a nunatak (“La Isla”) has been visible from the early 20th century (CitationDe Agostini, 1945). The glacier has been retreating since the LIA ca. A.D. 1600 when frontal moraines were generated approximately 1.5 to 2 km south from the 1937 ice-front position (CitationMarden, 1997).
The main glacier front located toward the west of the nunatak, was retreating moderately between 1937 and 1945 in water depths between 250 and 300 m. After that, the retreat accelerated between 1945 and 1975 (), presumably due to frontal ungrounding because of deeper water in that area of the lake (>500 m depth). Between 1975 and 1986 the frontal tongue was retreating at reduced rates, in areas with relatively shallow waters (110 m). Between 1986 and 1995 the retreat continued with higher rates in deeper waters (250 m). In 1997 a large calving event destroyed most of the lower part of the glacier (1.5 km2 of ice), preventing navigation for 3 yr due to the large amount of icebergs in the lake. Since this huge calving event, the western front has continued retreating but at lower rates. The water depth close to the November 2000 ice-front position was approximately 100 m. The presence of shallow waters together with the appearance of two small rock outcrops at the western front, suggest that the glacier frontal retreat will be smaller in the near future.
The secondary front of the glacier located to the east of the nunatak, was also retreating at a moderate rate between 1937 and 1986 when the ice was attached to a pinning point in an embayment of Lago Grey. But since then, and presumably due to the high thinning rates of that part of the glacier, the glacier has experienced a rapid retreat ().
Glaciar Pingo
Glaciar Pingo was retreating at high rates until 1975 (), when a rock outcrop appeared in the middle of the glacier terminus, which apparently has been acting as pinning point, slowing down the retreat in recent decades ().
Glaciar Zapata
Glaciar Zapata is a small glacier located between Glaciares Pingo and Tyndall, which has been retreating continuously since 1945 (). Between 1975 and 1986, a small proglacial lake appeared at the ice front. The maximum retreat occurred between 1986 and 2000 ().
Glaciar Tyndall
The historical frontal variations of Glaciar Tyndall have been described mainly for its southern calving fronts between 1945 and 1986 by CitationAniya et al. (1997) and between 1986 and 1997 by CitationAniya et al. (2000). The glacier is also retreating in the ablation area around its margin as well, including a noncalving eastern glacier tongue, also known erroneously as “Glaciar Zapata” (; ).
The eastern tongue is located at approximately 650 m a.s.l. (), with flow toward the east. This tongue reached a Late Neoglacial maximum during the LIA ca. A.D. 1700 (CitationAniya, 1995). In this advance, several moraine belts were generated with the youngest one located very close to the 1945 position of the glacier. In the area around two small lakes (), the retreat between the LIA and the 1945 position of the glacier is ca. 1 km. In recent years, this lateral arm has been retreating in a noncalving environment, although small proglacial lagoons could be observed in the period 1986–2000 ().
The southern and main tongue of the glacier is calving in two lakes (), separated by a rock outcrop where in recent years small proglacial lagoons have appeared. Both calving fronts have been retreating since 1945, and both are showing an increase in retreat rates since 1986 ().
AREA CHANGES
CitationAniya et al. (1997) analyzed the area changes experienced by the frontal tongues of glaciers from the SPI between 1945 and 1986. Here we account for the area variations of the frontal tongues and the glacier margins as well, for the periods when aerial photographs and satellite images are available.
The areal changes were evaluated mainly for the ablation areas, where changes from terrestrial margins were separated from those changes taken place at the calving fronts, where area shrinkage meant lake expansions. Changes in the accumulation area of the glaciers are much more complicated to determine, due to the presence of snow, poor coverage of aerial photographs, and a lack of stereoscopic vision in most of the photographs. In this sense, the calculated areal changes are presumably underestimated, because we could not consider the wastage at the accumulation areas.
The total glacier area in 2000 for Glaciares Frías, Cubo, Dickson, Grey, Pingo, Zapata, and Tyndall was 751.7 km2 (). The areal loss in 1945–2000 for the above glaciers was 62.2 km2, which represents 8% of the ice area of 1945 ().
The main area changes have taken place in the northern sector of the NPTP. In 1945, the lower tongues of Glaciares Cubo, Dickson, and Frías were joined together at the valley bed. Glaciar Dickson showed a maximum area loss between 1975 and 1986, when the southern arm was retreating in deep water at Lago Dickson. Between 1986 and 2000 the glacier wasted at a slower rate, because the southern arm was more stable. Nevertheless, during that period the eastern arm of the glacier was collapsing into the new proglacial lake generated in the early 1980s in the junction of the three glaciers (Cubo, Dickson, and Frías). Between 2000 and 2003 (based upon the ASTER image), the eastern tongue disappeared, having lost 1.45 km2 of ice at a rate of 0.62 km2 a−1 , the maximum rate in the historical record, forming an extended Lago Dickson (). Glaciar Frías was losing area at reduced rates in all the periods. The debris-covered area change at Glaciar Frías was more significant at the eastern end of the glacier. Glaciar Cubo has been retreating at slower rates, although it has been calving into a proglacial lake for approximately the last 20 yr. However, in terms of area percentage, Glaciar Cubo has lost more area than any other glacier in NPTP.
Glaciars Grey and Tyndall have experienced an acceleration of their areal loss rates in recent years, especially since 1986, when an increment of calving activity has been observed. The other glaciers have been losing area at slower rates, especially Glaciar Pingo, which has experienced a reduction on its areal change rates since 1975.
ICE ELEVATION CHANGES
DEMs Comparison
Only a few glaciers were evaluated in terms of ice elevation changes based upon DEM comparison (), because they were poorly covered or not covered at all in the regular cartography of 1975 and 1995.
Glaciar Olvidado was the only glacier completely covered in both maps. The ice elevation changes at the accumulation and ablation areas are higher than the estimated errors, with a maximum thinning of 110 m at the lower end of the glacier ().
Glaciar Frías was only partially covered in both regular cartographies of the IGM. The upper part of the glacier was scarcely covered due to the presence of areas without stereoscopic vision on the aerial photographs. For this reason only the ablation area was considered for calculating ice elevation change, which showed a maximum thinning of 57 m in debris covered areas. The average thinning rate considering different surfaces of the glacier (bare ice, debris cover and ice core moraine) was much smaller 1.4 m a−1.
Glaciar Dickson was thinning at very high rates at the ablation area, with maximum values of 150 m at the eastern arm of the glacier, where the ice was in near hydrostatic equilibrium at the proglacial lake in 1998, which was evident from the water-filled longitudinal crevasses and the flat surface topography of the ice. The accumulation area was not covered completely by the 1975 and 1995 maps, with the lower part showing thinning, and the upper part thickening.
Only the middle altitude area of Glaciar Grey was studied, because the lower front of the glacier was not surveyed in the 1995 cartography, and the upper part was not covered due to lack of stereoscopic vision on the aerial photographs. In this sense, the thinning values are not completely representative of the maximum thinning experienced by the western glacier front, which disappeared in the above mentioned calving event of 1997.
DEM versus GPS Measurements
At Glaciar Dickson, the GPS measurements were carried out at the ice front in an area which has experienced severe retreat (), allowing the generation of a water corridor at the glacier front. The measured ice elevation change is very high (−7.6 ± 0.9 m a−1) between DEM-1975 and GPS-1998 representing the maximum thinning value at the calving front of the glacier. On the debris covered area of Glaciar Frías the thinning rate during the same period yielded 3.2 ± 0.9 m a−1, illustrating the attenuation effect of the debris cover mantle.
DEM versus Optical Data
Surface topography measurements were carried out in March 1999 at mid-altitude (± 650 m a.s.l.) on Glaciar Tyndall by means of a theodolite from the same control point (“Alpha”, 677.6 m a.s.l., ) as used by CitationNaruse et al. (1987), when they surveyed in 1985 a transverse profile of the glacier (“Japanese profile,” ). The objective of the 1999 campaign was to re-survey the Japanese profile, however, the measurements turned out to be located a few hundred meters downstream due to problems of adjusting the original azimuth of the line.
In spite of this problem, it was possible to compare the theodolite measurements () with the DEM generated by IGM based upon 1975 aerial photographs yielding an ice thinning rate of 3.1 ± 0.8 m a−1 between 1999 and 1975.
Discussion
All glaciers at NPTP have been retreating since the first historical records of glacier frontal position in Patagonia at the beginning of the 20th century. When these oldest historical records are compared with the last stage of glacier advance during the LIA at A.D. 1500–1700 obtained from dendrochronological and geomorphological analysis (CitationMarden and Clapperton, 1995; CitationLuckman and Villalba, 2001), there is evidence that most of the glaciers were relatively stable with small retreats between the LIA and the early 1900s.
Since the beginning of the historical records, glacier retreats have been related among other factors, to the presence of calving activity. Most of the calving fronts have been retreating at greater rates than their noncalving counterparts. In this sense, once atmospheric warming accelerates thinning rates, the main control on the glaciers retreat is probably related to the water depth in the lakes (i.e. for Glaciares Dickson, Cubo, and Grey), as has been demonstrated for other temperate freshwater calving glaciers of New Zealand (CitationWarren and Kirkbride, 2003) and Patagonia (CitationWarren and Aniya, 1999).
Another factor which affects glacier retreat is the presence of debris cover in the ablation areas. The only glacier with debris cover is Glaciar Frías, which is flowing from north to south, perpendicular to the main Dickson–Cubo–Frías valley, where the lower ablation area of Glaciar Frías is confined. During the Late Pleistocene (10,390 14C yr B.P.), the lower part of the glacier was flowing to the east, where it joined another glacier tongue coming from Glaciar Perito Moreno (CitationStrelin and Malagnino, 2000). After the Holocene retreat, the lower part of the glacier was confined to the valley bottom, and the moraine material became pushed against the northern slopes of Cerro Daudet where it were accumulated (). These thick layers of boulders and clasts have been acting as insulators for the underlying ice, preventing melting and stabilizing the frontal tongue. The surface of the glacier within the debris-covered area presents arc undulations at the ice front which might represent stages of ice advances after the LIA. The lack of proglacial lakes and therefore absence of calving activity until recent years, allowed the glacier to thin in situ without frontal retreat. In the past, frontal retreat has also been small compared to thinning, as evidenced by the LIA trimlines and moraines located only 500 m from the glacier front, but 150 to 200 m above the present ice surface. The process of deglaciation affecting the frontal tongue of the glacier will be probably enhanced with the appearance of new proglacial lakes since 1986, as has been described for other Patagonian debris-covered glaciers suffering supraglacial lake expansions and retreats (CitationAniya and Wakao, 1997).
In the accumulation areas of glaciers in NPTP, the average thinning rate between 1975 and 1995 is smaller than the estimated error. Two reasons are possible to explain this: the changes at higher altitudes are very small, and/or, the quality of the cartography at higher altitudes is poor due to the lack of ground control used by the IGM to compile the maps. Based upon historical records and extrapolations, CitationAniya (1999) estimated thinning rate between 0.5 and 1 m a−1 for the accumulation area of the SPI, which are smaller than values observed in the ablation areas. Unfortunately, with the available topographic data used in this paper, it is not possible to verify or dismiss these results.
Data in the ablation areas are more reliable, as the thinning rates are in agreement with similar measurements carried out in the ablation areas of other retreating glaciers of the SPI (CitationRivera et al., 2000; CitationCasassa et al., 2002; CitationRignot et al., 2003). The explanations for such rapid thinning rates in the ablation areas could be related to an increase in the ablation rates, or as a result of longitudinal stretching (CitationVenteris et al., 1997). It is well known that more rapidly flowing glaciers have higher stretching rates near the terminus, which increases retreat rate at the calving-terminus by thinning and fracturing (CitationVenteris, 1999).
At Glaciar Dickson this dynamic process is significant, especially in its eastern arm. In this area, the glacier response to the high thinning rates measured between 1975 and 1995 was a lateral and longitudinal stretching of the glacier into a new proglacial lake (generated before 1982), with water-filled longitudinal crevasses, indicating that the buoyancy condition was probably reached. Subsequently, the tongue collapsed with the expansion of Lago Dickson up to the frontal tongue of Glaciar Cubo. Similar processes of lower tongue collapses have been described for Glaciar Nef of the Northern Patagonia Icefield (CitationWarren et al., 2001) and Glaciar Upsala of the SPI (CitationNaruse and Skvarca, 2000).
In Glaciar Grey, the high thinning rate measured between 1975 and 1995 could also be related to an increase in ice flow velocity, with a longitudinal stretching of the lower part of the glacier. This process might be responsible for enhanced fracturing of the glacier, and the subsequent large calving event of 1997. The lake water depth at the western arm of the glacier seems to have a close relation to the frontal retreat of the glacier, enhancing the retreat when water depth was higher than approximately 250 m, and providing pinning points when the lake was shallower.
At Glaciar Tyndall, the Japanese profile was resurveyed in 1990 and 1993 determining an average ice elevation change of −4 m a−1 between 1985 and 1990 (CitationKadota et al., 1992) and −3.1 m a−1 between 1990 and 1993 (CitationNishida et al., 1995). The value for the last period is the same as the result of this paper (−3.1 ± 0.9 m a−1 for the period 1975–1999). More accurate values were obtained by CitationRaymond et al. (pers. comm., 2004), who measured the same profile in 2000 and 2001 with geodetic quality GPS receivers, concluding that the glacier was showing a continuous shrinkage and accelerated thinning.
CitationAniya et al. (1997) discussed the close relationship between thinning and frontal retreat of calving glaciers, and explained this process as a response to the negative surface mass balance. Long-term temperature series obtained from stations located around the SPI corroborated this hypothesis, with a warming rate of 0.013 to 0.02°C a−1 at Punta Arenas (53°S, 70.85°W, 37 m a.s.l.) in the period 1933–1992 (CitationRosenblüth et al., 1997). Nevertheless, the amount of ablation generated by the warming trend is not enough to account for all the ice thinning. Using a degree-day model for estimating ablation, it is possible to calculate the contribution of warming to ice thinning (CitationNaruse et al., 1997). At 330 m a.s.l. on Glaciar Perito Moreno, CitationTakeuchi et al. (1996) estimated an annual ablation of 12.8 m based upon stake measurement and an annual cumulative daily positive mean temperature of 1806°C day. Considering the degree-day factor to be constant (in space and time) and a warming trend of 0.02°C a−1 during the last 25 yr (CitationRosenblüth et al., 1997), the estimated annual ablation in 1975 (the first available DEM of the study area) yields 11.5 m. The difference (−1.3 m) is not large enough to account for all the ice elevation change measured in the glaciers of the study area (−1.4 to −7.6 m a−1). As a result, a dynamic component must be important in the glacier response, especially when glacier tongues are reaching floating points (CitationNaruse and Skvarca, 2000) or are accelerating due to longitudinal stretching and corresponding decrease in thickness (CitationSkvarca et al., 2002).
Conclusions
The upper accumulation areas of the glaciers present an elevation change between 1975 and 1995 very close to zero and with values much smaller than the errors. This value for the accumulation areas is therefore not significant, due to the low accuracy of the available topographic data. On the ablation areas there is a strong thinning substantially in excess of errors with a clear regional signal.
The total ice area lost in the period 1945–2000 represents 8% of the total glacier area of 1945. This value is an underestimation of the total area lost due to the exclusion of the accumulation area in the analysis.
The primary explanation for these high thinning rates is the prolonged negative mass balance experienced by the SPI, in response to regional atmospheric warming over the last 100 yr at least. However, dynamical explanations could be important as well, especially if we consider that high thinning rates are affecting freshwater calving glaciers tongues, which are close to buoyancy and therefore susceptible to enhanced longitudinal stretching and associated fracturing.
FIGURE 1. Southern Patagonia Icefield and study area. Figure adapted from CitationAniya et al. (1996) showing main glaciers of the SPI and ice divides. Glaciers flowing to the Pacific Ocean are in light gray. Glaciers contributing to the Atlantic Ocean are in dark gray. Dashed lines show areas where the ice divide is uncertain. Area in rectangle is shown in
FIGURE 2. Landsat ETM+ satellite composite image with bands 1, 4, and 5 from October 2000. Main glacier basins are shown in black. The image is an enlargement of the rectangle shown in
FIGURE 3. ASTER composite (bands 1, 2, and 3 Nadir) satellite image acquired in February 2003, with frontal variations of Glaciares Dickson, Frías, and Cubo. LIA indicates the Little Ice Age moraine estimated by correlation with similar moraines on Lago Grey (CitationMarden and Clapperton, 1995). UTM coordinates are expressed in meters.FIGURE 4. ASTER composite (bands 1, 2, and 3 Nadir) satellite image of 2003 and frontal variations of Glaciares Olvidado, Los Perros, Ohnet, and U-2. UTM coordinates are expressed in meters.FIGURE 5. Landsat ETM+ composite image (bands 1, 4, and 5) of October 2000, with frontal variations of Glaciares Grey, Pingo, and Zapata. UTM coordinates are expressed in meters.FIGURE 6. Landsat ETM+ composite image (bands 1, 4, and 5) of October 2000, with frontal variations of the eastern ice front of Glaciar Tyndall. The control point “Alpha,” the Japanese profile surveyed since 1985 (CitationNaruse et al., 1987) as well as the point measurements carried out by optical survey in 1999 are shown. LIA indicates the Little Ice Age moraine as defined by CitationAniya (1995). UTM coordinates are expressed in meters.FIGURE 7. Landsat ETM+ composite image (bands 1, 4 and 5) with frontal variations of the calving ice fronts of Glaciar Tyndall. UTM coordinates are expressed in meters
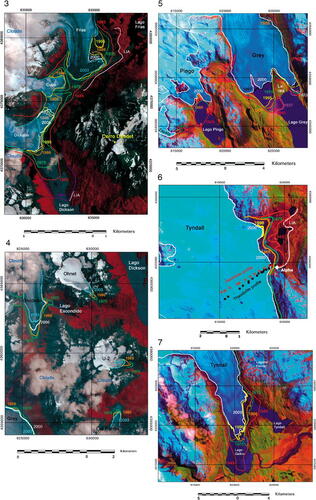
FIGURE 8. Ice elevation changes in meters at the ablation area of Glaciares Frías, Dickson, Olvidado, Cubo, and Grey between 1975 and 1995. UTM coordinates are expressed in meters
TABLE 1 Basic glacier information based on the Landsat ETM+ mosaic acquired in October 2000 and regular cartography of the IGM
TABLE 2 Characteristics of the cartographic data
TABLE 3 Aerial photographs
TABLE 4 Errors for each data set (m)
TABLE 5 Frontal variation (m a−1) of Glaciar Dickson
TABLE 6 Frontal variations (m a−1) of Glaciar Frías
TABLE 7 Frontal variations of glaciares Olvidado, Los Perros, Ohnet and U-2 (m a−1)
TABLE 8 Frontal variations (m a−1) of Glaciar Grey
TABLE 9 Frontal variations (m a−1) of Glaciares Zapata and Pingo
TABLE 10 Frontal variations (m a−1) of Glaciar Tyndall
TABLE 11 Ice area change rates 1945–2000
TABLE 12 Ice elevation change rates 1995–1975 (m a−1)
Acknowledgments
This research is funded by FONDECYT 1000445, CECS, the Republic of Chile scholarship of MIDEPLAN, and the University of Chile. The support of Universidad de Magallanes is appreciated. Renji Naruse kindly shared the optical survey data of Tyndall glacier. Renji Naruse and Masamu Aniya contributed with a Landsat TM mosaic of 1986. Fiona Cawkwell and Jonathan Bamber edited the paper. Heiner Lange provided the 1999 theodolite data for Glaciar Tyndall. Rodrigo Traub and Rodrigo Adaros collaborated during the field campaigns. IGM permitted restricted access to the 1995 regular cartography. FACH provided logistical support during the 1998 field campaign. CONAF gave support during the campaigns in the NPTP area. Cesar Acuña and José Araos collaborated with data compilation. Fernando Ordenes prepared the figures. USGS and GLIMS gave access to Landsat ETM+ images from Patagonia. CECS is a Millennium Science Institute and is funded in part by grants from Fundación Andes and the Tinker Foundation. The comments of two anonymous referees and the editor of the journal are acknowledged.
Related Research Data
References Cited
- Aniya, M. 1995. Holocene glacial chronology in Patagonia: Tyndall and Upsala Glaciers. Arctic, Antarctic, and Alpine Research 27:4 311–322.
- Aniya, M. 1999. Recent glacier variations of the Hielos Patagónicos, South America, and their contribution to sea-level change. Arctic and Alpine Research 31:2 165–173.
- Aniya, M. and Y. Wakao . 1997. Glacier variations of Hielo Patagónico Norte, Chile, between 1944/45 and 1995/96. Bulletin of Glacier Research 15:11–18.
- Aniya, M. , H. Sato , R. Naruse , P. Skvarca , and G. Casassa . 1996. The use of satellite and airborne imagery to inventory outlet glaciers of the Southern Patagonia Icefield, South America. Photogrammetric Engineering and Remote Sensing 62:1361–1369.
- Aniya, M. , H. Sato , R. Naruse , P. Skvarca , and G. Casassa . 1997. Recent variations in the Southern Patagonia Icefield, South America. Arctic and Alpine Research 29:1–12.
- Aniya, M. , A. Dhakal , S. Park , and R. Naruse . 2000. Variations of Patagonian Glaciers, South America, Using RADARSAT and Landsat Images. Canadian Journal of Remote Sensing 26:501–511.
- Aristarain, A. and R. Delmas . 1993. Firn-core study from the southern Patagonia ice cap, South America. Journal of Glaciology 39:132 249–254.
- Casassa, G. , A. Rivera , M. Aniya , and R. Naruse . 2002. Current knowledge of the Southern Patagonia Icefield. In Casassa, G., Sepúlveda, F., and Sinclair, R. (eds.), The Patagonian Icefields: A Unique Natural Laboratory for Environmental and Climate Change Studies. Series of the Centro de Estudios Científicos. New York: Kluwer Academic/Plenum Publishers, 67–83.
- De Agostini, A. 1945. Andes Patagónicos. Viajes de Exploración a la Cordillera Patagónica Austral. 2nd ed. Buenos Aires: Guillermo Kraft. 445 pp.
- Falkner, E. 1995. Aerial Mapping. Methods and Applications. Boca Raton, Fl.: CRC Press 322 pp.
- Gallois, L. 1901. Les Andes de Patagonie. In: Annales de Géographie, Vol. 10, No 51.
- Kadota, T. , R. Naruse , P. Skvarca , and M. Aniya . 1992. Ice flow and surface lowering of Tyndall Glacier, Southern Patagonia. Bulletin of Glacier Research 10:63–68.
- Krimmel, R. 1999. Analysis of difference between direct and geodetic mass balance measurements at South Cascade glacier, Washington. Geografiska Annaler 81A:653–658.
- the BEDMAP Consortium, 2001. BEDMAP: A new ice thickness and subglacial topographic model of Antarctica. Journal of Geophysical Research 106:B6 11335–11351.
- Luckman, B. and R. Villalba . 2001. Assessing the synchroneity of glacier fluctuations in the western Cordillera of the Americas during the last millennium. In V. Markgraf, V. (ed.), Interhemispheric Climate Linkages. London: Academic Press, 119–140.
- Marden, C. 1997. Late-Glacial fluctuations of South Patagonian Icefield, Torres del Paine National Park, Southern Chile. Quaternary International 38/39:61–68.
- Marden, C. and C. Clapperton . 1995. Fluctuations of the South Patagonian Ice-Field during the last glaciation and the Holocene. Journal of Quaternary Science 10:197–210.
- Mennis, J. and A. Fountain . 2001. A spatio-temporal GIS database for monitoring alpine glacier change. Photogrammetric Engineering and Remote Sensing 67:967–975.
- Naruse, R. and M. Aniya . 1992. Outline of Glacier Research Project in Patagonia, 1990. Bulletin of Glacier Research 10:31–38.
- Naruse, R. and P. Skvarca . 2000. Dynamic features of thinning and retreating Glaciar Upsala, a lacustrine calving glacier in Southern Patagonia. Arctic, Antarctic, and Alpine Research 32:485–491.
- Naruse, R. , H. Peña , M. Aniya , and J. Inoue . 1987. Flow and surface structure of Tyndall glacier, the Southern Patagonia Icefield. Bulletin of Glacier Research 4:133–140.
- Naruse, R. , P. Skvarca , and Y. Takeuchi . 1997. Thinning and Retreat of Glaciar Upsala, and an estimate of annual ablation Changes in Southern Patagonia. Annals of Glaciology 24:38–42.
- NIMA (National Imagery and Mapping Agency), 1997. Department of Defense World Geodetic System 1984: Its Definition and Relationships with Local Geodetic Systems. NIMA TR8350.2 Third Edition 4 July 1997. Bethesda, MD.
- Nishida, K. , K. Satow , M. Aniya , G. Casassa , and T. Kadota . 1995. Thickness change and flow of Tyndall Glacier, Patagonia. Bulletin of Glacier Research 13:29–34.
- Paul, F. , A. Kääb , M. Maisch , T. Kellenberger , and W. Haeberli . 2002. The new remote sensing derived Swiss glacier inventory I: Methods. Annals of Glaciology 34:355–362.
- Peña, H. and F. Escobar . 1985. Análisis de las crecidas del río Paine, XII Región. Publicación Interna E.H. N. 83/7. DGA (Dirección General de Aguas), Departamento de Hidrología, Santiago. 78 pp.
- Raymond, C. , T. Neumann , E. Rignot , K. Echelmeyer , A. Rivera , and G. Casassa . 2004. Personal communication. Unpublished manuscript: Retreat of Tyndall Glacier, Patagonia, over the last half century.
- Rignot, E. , A. Rivera , and G. Casassa . 2003. Contribution of the Patagonia icefields of South America to global sea level rise. Science 302:434–437.
- Rivera, A. and G. Casassa . 2002. Detection of ice thickness using radio echo sounding on the Southern Patagonia Icefield. In Casassa, G. Sepúlveda, F., and Sinclair, R. (eds.), The Patagonian Icefields: A Unique Natural Laboratory for Environmental and Climate Change Studies. Series of the Centro de Estudios Científicos. New York: Kluwer Academic/Plenum Publishers, 101–115.
- Rivera, A. , G. Casassa , C. Acuña , and H. Lange . 2000. Variaciones recientes de Glaciares en Chile. Investigaciones Geográficas 34:25–52.
- Rivera, A. , C. Acuña , G. Casassa , and F. Bown . 2002. Use of remote sensing and field data to estimate the contribution of Chilean glaciers to the sea level rise. Annals of Glaciology 34:367–372.
- Rosenblüth, B. , H. Fuenzalida , and P. Aceituno . 1997. Recent temperature variations in southern South America. International Journal of Climatology 17:67–85.
- Shiraiwa, T. , S. Kohshima , R. Uemura , N. Yoshida , S. Matoba , J. Uetake , and M. Godoi . 2002. High net accumulation rates at Campo de Hielo Patagónico Sur, South America, revealed by analysis of a 45.97 m long ice core. Annals of Glaciology 35:84–90.
- Skvarca, P. , H. de Angelis , R. Naruse , C. Warren , and M. Aniya . 2002. Calving rates in fresh water: new data from southern Patagonia. Annals of Glaciology 34:379–384.
- Strelin, J. and E. Malagnino . 2000. Late-Glacial History of Lago Argentino, Argentina, and Age of the Puerto Bandera Moraines. Quaternary Research 54:339–347.
- Takeuchi, Y. , R. Naruse , and P. Skvarca . 1996. Annual air-temperature measurement and ablation estimate at Moreno Glacier, Patagonia. Bulletin of Glacier Research 14:23–28.
- Venteris, E. 1999. Rapid tidewater glacier retreat: a comparison between Columbia Glacier, Alaska and Patagonia calving glaciers. Global and Planetary Change 22:131–138.
- Venteris, E. , I. Whillans , and C. Van der Veen . 1997. Effect of extension rate on terminus position, Columbia Glacier, Alaska, USA. Annals of Glaciology 24:49–53.
- Warren, C. and M. Aniya . 1999. The calving glaciers of South America. Global and Planetary Change 22:1–4 59–77.
- Warren, C. and M. Kirkbride . 2003. Calving speed and climatic sensitivity of New Zealand lake-calving glaciers. Annals of Glaciology 36:173–178.
- Warren, C. , D. Benn , V. Winchester , and S. Harrison . 2001. Buoyancy-driven lacustrine calving, Glaciar Nef, Chilean Patagonia. Journal of Glaciology 47:156 135–146.