Abstract
Lengthening of the growing season at high latitudes, observed by satellites with the Normalized Difference Vegetation Index (NDVI), has been ascribed to climate warming. To test this assumption, and to verify whether changes in vegetation greenness are quantitative or qualitative, we experimentally warmed patches of High Arctic tundra with infrared heating in Northeast Greenland. By analyzing digital images of the vegetation, changes in cover were distinguished from changes in senescence. During the season, experimental warming significantly increased green cover, for example, at the time of peak cover, the total green cover was enhanced from 59.1 to 67.3%. The dominant wavelength (hue) reflected by our tundra plots shifted from yellow-green to yellow. Experimental warming with 2.5°C delayed this hue-shift by 15 d. The results demonstrate that higher summer temperatures do not only promote plant growth at these latitudes but also retard and/or postpone the senescence process, contrary to indications from previous research that late-season phenology in the High Arctic is governed by photoperiod.
Introduction
High latitudes are expected to undergo the earliest and most pronounced effects of global warming (CitationMaxwell 1992; CitationWatson et al., 1998; CitationMcCarthy et al., 2001). Scenarios of temperature increase in arctic regions for 2080 vary between 0.5 and 7.5°C in summer and between 2.5 and 16°C in winter (CitationMcCarthy et al., 2001). This will affect soil temperatures, soil moisture content, nutrient cycling, active layer depth, and mean daily solar radiation available to plants (CitationKane et al., 1992; CitationMaxwell 1992). The effects on arctic plants are likely to be strongly constrained by existing controls on phenology and growth (CitationShaver and Kummerow, 1992). For example, the controls on autumn senescence have a strong genetic component to them that is unlikely to change except over a very long time span (CitationShaver and Kummerow, 1992). In addition, previous research indicates that late-season phenology in High Arctic species is controlled by photoperiod rather than by temperature (CitationBarnes et al., 1998; CitationArft et al., 1999), so senescence should not be sensitive to climate warming. Still, satellite observations of the Normalized Difference Vegetation Index (NDVI) over the past two decades indicate a lengthening of the growing season (CitationMyneni et al., 1997; CitationZhou et al., 2001; CitationLucht et al., 2002). But NDVI data are only surrogates of plant photosynthetic activity and the translation to actual photosynthetic gains requires additional research. The inferred changes in NDVI magnitude and growing season duration must consequently be interpreted with caution (CitationZhou et al., 2001). In particular, NDVI does not distinguish between quantitative (e.g., cover) and qualitative (e.g., senescence) changes of vegetation greenness; therefore, we disentangled these processes by digital image analysis, in tundra plots exposed to experimental warming in Northeast Greenland. We investigated whether higher summer temperatures modify the seasonal variation in cover at these latitudes and alter the timing of senescence. To avoid artefacts associated with greenhouses or open top chambers (for critiques see CitationKennedy [1995] and CitationMarion et al. [1997]), the vegetation was warmed by infrared irradiation with the Free Air Temperature Increase (FATI) technique (CitationNijs et al., 1996; CitationNijs et al., 2000).
Materials and Methods
SET UP
The study was conducted in the grassland area of the Zackenberg research station on the Northeast coast of Greenland (74°28′N, 20°34′W, 25 m a.s.l.). In this wet High Arctic tundra site with continuous permafrost, the growing season lasts approximately 2 mo, mean annual air temperature is −10.4°C, and annual precipitation 215 mm (means for 1961–90, Danish Meteorological Institute). At the start of the 1999-growing season, we selected six tundra plots (40 × 50 cm) with visually similar species composition, dominated by Salix artica Pall. and Arctagrostis latifolia Griseb., with Carex bigelowii Torr. ex Schwein, Polygonum viviparum L., and Dryas spp. as subdominants. Living plant cover was subsequently estimated with pin-frames placed on the plots, which recorded the species with a vertical needle at each point of a 500-point matrix (40 × 50 cm). Plots were allocated to the two temperature groups to have approximately equal cover and species composition before heating began (ANOVA of cover by species, P > 0.05) and were placed a minimum distance of 2 m apart to avoid interference. From 2 July to 26 August, three of these plots were continuously warmed with individual FATI-units placed on the north side, designed to increase surface temperature of the vegetation by 2.5°C. The three other plots served as controls and had “dummy” FATI-units without lamps to ensure they received similar solar radiation. Over the period of warming, the surface temperature of the vegetation, monitored and controlled by noncontact semiconductor sensors (“infracouple”, type OS39-MVC-6; Omega engineering, Stamford, CT, US) was elevated on average with 2.50 ± SD 0.71, 2.48 ± SD 0.34, and 2.44 ± SD 0.42°C, above means of 9.26, 7.90, and 7.92°C in FATI units 1, 2, and 3, respectively. Of the instantaneous increments in surface temperature, 78% fell within ±0.5°C of the target increment of +2.5°C. Soil temperature was increased on average 2.59, 2.13, 1.63, and 0.86°C at 2.5, 7.5, 15, and 30 cm depth, respectively; air temperature at a height of 5 cm was increased 1.09°C, all measured with NTC-thermistors (EC95, Thermometrics, New Jersey, US). Total cumulative photosynthetically active radiation (PAR), measured with a gallium-arsenide sensor (JYP-1000, SDEC, France), was 2052 mol m−2.
MEASUREMENTS
We first examined the seasonal dynamics of the vegetation with NDVI, a greenness index ranging from −1 to +1 related to the fraction of absorbed PAR. NDVI integrates effects of leaf area index and effects of absorptance per unit leaf area. For exposed soils, it varies between −0.2 and 0.5, which progressively increases to 0.7 as green cover increases (CitationTucker et al., 1986). At Zackenberg we measured NDVI throughout the growing season on day of the year (DOY) 184 (3 July), 189, 194, 210, 216, 218, 227, 232, and 238 (28 August), with a gallium-arsenide sensor (JYP-1000, SDEC, France), adapted for the NDVI-wavebands (CitationPontailler and Genty, 1996) at 8 cm above the ground surface. FATI systems were turned off during the measurements.
To distinguish quantitative (e.g., cover) from qualitative (e.g., senescence) changes in greenness, we recorded color images of the plots with a digital camera (Red, Green, Blue values for each of 300000 pixels, Mavica MVC-FD91, Sony Corporation, Japan). Digital color imaging has been applied successfully in assessment of both senescence (CitationAdamsen et al., 1999) and cover (CitationEwing and Horton, 1999; CitationRichardson et al., 2001). For efficient color processing, RGB was converted to HSI (hue, saturation, and intensity) with software xv for Linux (CitationGonzalez and Woods, 1992).
If G ≥ B,
If G < B,
Hue represents the dominant wavelength in a mixture of light waves, saturation the relative purity or the amount of white light mixed with light of a given hue, and intensity the brightness (CitationTang et al., 2000; CitationChoi et al., 1995). Red, yellow, green, and blue have a hue value of 0, 60, 120, and 240, respectively. Effects of illumination intensity on hue (the Bezold-Brucke shift, CitationPridmore [1999]) could be discarded since the mean intensity of the images did not change significantly with date or treatment (ANOVA, P > 0.05, F
7,7 = 3.181 and F
1,7 = 0.117 for, respectively, DOY and treatment). In the experiment, images were taken from each plot at a height of 128 cm with maximum zoom on eight dates spanning the entire growing season (DOY 182, 189, 194, 210, 218, 227, 232, and 239). From each image 300 pixels of living (green) leaves were selected at random. We excluded (i) leaf edges to avoid mixing of leaf with background color and (ii) dead material in order to detect senescence rather than mortality. To detect changes in hue during the season, we calculated the relative frequency distributions of the hues of these pixels for each treatment on each DOY. Because the mean, skewness, kurtosis, variance, and standard deviation were not significantly different between replicate plots of the same treatment (=no plot effect, MANOVA, P > 0.05, F
2,20 between 0.056 and 1.762), the hue values of 300 randomly selected pixels from each replicate plot were combined into 900 hue values per treatment per date (=one frequency distribution). We quantified the hue-shift with cross-correlation statistics. This method shifts the frequency curves by one hue at the time and calculates each time the correlation-coefficient (r) between the shifted curve and the curve on the starting day (DOY 182). The hue-shift is the number of hues a frequency curve had to be moved to maximize r.
With software xv for Linux we also determined from the digital images the quantitative component of greening, i.e. the total green cover (TGC). Two thresholds were used to quantify the number of all green and moss pixels, which corrected for the minor (1 to 10%) overlaps with bare soil and dead material (hue < 43) and with sensors placed in the plots (hue > 115). TGC derived in this way was not significantly different (ANOVA, P > 0.05, F 1,67= 0.205) from TGC measured with the pin-frames placed on the plots. From this pin-frame readings we also calculated the moss cover (MC), and subsequently the higher-plant green cover (HPGC) as TGC-MC.
Results and Discussion
Overall, NDVI was significantly higher in the heated plots (, ANOVA, P < 0.05, F 1,105= 10.054). Effects became significant from DOY 210 onwards (separate ANOVAs on early- (DOY 184, 189, and 194) (P > 0.05, F 1,33= 0.246), mid- (DOY 210, 216, and 218) (P < 0.05, F 1,33= 6.787), and late-season data (DOY 227, 232, and 238) (P < 0.01, F 1,33= 29.980)). In spite of the accelerated greening, the peak NDVI value did not shift (standard-error overlap of peak DOY). In contrast to this, the NDVI value, observed in the heated plots at the end of the season (0.60 on DOY 238), was reached 10 d earlier in the unheated plots. This may indicate that whole-season warming delayed the onset of senescence and/or decelerated the senescence process, in spite of its assumed photoperiodic control. However, higher NDVI after the mid-season peak might equally arise from increased or prolonged growth in this period. The origin of the NDVI increase under experimental warming was identified from the image analysis results.
shows the relative frequency distribution of the hues from heated and unheated plots on DOY 182, 218, and 239. During the season, the hue shifted from green to yellow-green, which we quantified with cross-correlation statistics (). Hue-shifts are related to senescence because the mean hue of the images was negative linear related with the percentage dead cover in the plots (r 2 = 0.83), indicating that more vegetation had senesced in plots with a lower hue. Also the research of CitationAdamsen et al. (1999) confirms the utility of digital images for studying “greenness,” they found that the average green to red ratio (G/R) of an image and the chlorophyll measurements showed similar temporal trends and had a good correlation (r 2 = 0.91). Experimental warming significantly retarded the seasonal hue-shift (ANOVA on pooled samples, P < 0.05, F 1,13= 8.519), by 6.0 units by the end of August (, average shift −17.0 instead of −23.0 in the controls, or a 15-d delay). The end-of-season difference in hue is visible in : unheated vegetation () was substantially more yellow than heated vegetation (). These data elucidate that NDVI findings of growing season extension can indeed be caused by the fact that the senescence process itself is slower or delayed in a warmer climate. As the hue started shifting towards yellow almost immediately after the start of the growing season (), senescence is clearly a gradual process, possibly with a different onset in different species.
Overall, experimental warming significantly increased green cover (all components, , MANOVA, P < 0.01, F 1,45= 13.979 for TGC and F 1,45 = 39.949 for HPGC). For example, at the time of peak cover (DOY 205), TGC derived from the images was enhanced from 59.1 to 67.3%, and HPGC from 45.8 to 58.2%. The 12.4% increase in HPGC at this time augmented to 18.6% by the end of the season. Time of peak TGC or HPGC was not affected by the warming (standard error overlap of peak DOY). These results cohere with our NDVI measurements and confirm that plant growth was higher in the warmer plots. Whether this was still the case after the seasonal peak we cannot ascertain, because decreases in cover in this period reflect the balance of remaining plant growth and mortality. Two species, Arctagrostis latifolia and Polygonum viviparum, seemed to contribute most to the greening, although no species contributed significantly (MANOVA, P > 0.05, F 1,5 between 0.007 and 4.419). Species-specific warming responses have been observed before and sometimes compensate for each other (CitationChapin and Shaver, 1996) due to space limitations. This was not the case here, probably because our tundra plots had sparse vegetation (10.0, 10.8, and 18.8% bare ground, moss, and dead material, respectively, at the time of peak cover).
The results of this study shed more light on satellite data of NDVI and greening trends (CitationMyneni et al., 1997, Citation1998; CitationTucker et al., 2001; CitationZhou et al., 2001; CitationBogaert et al., 2002; CitationLucht et al., 2002; CitationShabanov et al., 2002). Between 1982 and 1999, NDVI increased 8.44 and 12.41% over Eurasia and North America, respectively (CitationZhou et al., 2001). During the same period, the greatest average NDVI increase at latitudes >35°N (i.e. 15%), was observed between 65 and 75°N in North America (CitationTucker et al., 2001). For vegetated surfaces between 40 and 70°N, Tucker et al. (2002) found a statistically meaningful relationship between NDVI changes and land surface temperature and concluded that higher northern latitude vegetation is responding to warmer temperatures by starting the growing season earlier and continuing longer. Also according to a biogeochemical model using climate data, the observed trends towards earlier spring, delayed autumn and increased maximum leaf area index, were mainly a consequence of changes in temperature (CitationLucht et al., 2002). Our data collected on the ground at high latitude in Northeast Greenland confirm this hypothesis and document for the first time that changes in greening under simulated warming can have both a qualitative and a quantitative origin (decreased hue-shift from green to yellow-green, and increased green cover, respectively). Both direct effects of temperature on growth and indirect effects, such as increased nutrient cycling, might account for the change. Higher nutrient availability might occur because of an increase of active layer thickness and thus an improvement of drainage (CitationOechel and Billings, 1992; CitationMooney et al., 1999). Higher temperatures may mobilize nutrients previously frozen in the soil (CitationFung, 1997). A warmer soil can also stimulate root activity and uptake of nutrients (CitationOechel and Billings, 1992). As a consequence, plant growth and leaf area index could increase (CitationHobbie et al., 2002). We conclude that even moderate warming with +2.5°C has the potential to significantly alter seasonal plant growth patterns in the High Arctic, and to lift temperature constraints to the extent that plant activity is maintained later in the season. Whether this enhances the risk of early frost damage, or of untimely resorption of nutrients from senescing leaves, remains unknown.
FIGURE 1. Seasonal variation in normalized difference vegetation index (NDVI) for heated (•) and unheated (○) tundra. Readings of individual plots and fitted second-order polynomial curve
FIGURE 2. A: Relative frequency distributions of hues of pixels from living plants, taken from digital images of heated and unheated tundra plots on three days of the year (DOY). Grouping hues into classes of five units smoothed the curves. Long and short vertical lines indicate the means of the distributions for the unheated and heated treatment, respectively, and arrows the shifts of these means with experimental warming. B: Hue-shift in heated (•) and unheated (○) plots relative to the start of the growing season, calculated with cross-correlation statistics. Fitted lines estimate the seasonal hue-shifts
FIGURE 3. Typical examples of digital images (±4000 pixels) cropped from the original images (±300,000 pixels) at the end of the season (DOY 239), showing living leaves (see text for filtering technique). A: From an unheated plot (mean hue 55). B: From a heated plot (mean hue 61)
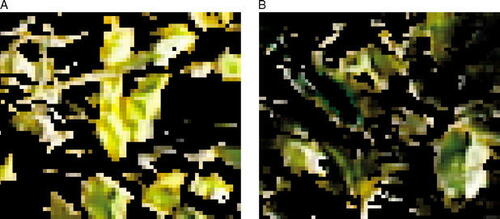
FIGURE 4. A: Percentage total green cover (TGC), determined either from digital images (heated • and unheated ○) or from pin-frame measurements (heated ♦ and unheated ⋄).B: Percentage higher-plant green cover (HPGC, heated ▴ and unheated Δ), determined from both techniques combined (see text), in the course of the growing season. Readings of individual plots and fitted second-order polynomial curve.
Acknowledgments
We thank the Danish Polar Centre for providing access to and logistics at the research station at Zackenberg under the framework program ZERO. This study was supported by the Fund for Scientific Research-Flanders (F.W.O., Belgium) under contract G.0086.98.
Related Research Data
References Cited
- Adamsen, F. J. , P. J. Pinter , E. M. Barnes , R. L. LaMorte , G. W. Wall , S. W. Leavitt , and B. A. Kimball . 1999. Measuring wheat senescence with a digital camera. Crop Science 39:719–724.
- Arft, A. M. , M. D. Walker , J. Gurevitch , J. M. Alatalo , M. S. Bret-Harte , M. Dale , M. Diemer , F. Gugerli , G. H R. Henry , M. H. Jones , R. D. Hollister , I. Jonsdottir , K. Laine , E. Lévesque , G. M. Marion , U. Molau , P. Molgaard , U. Nordenhall , V. Rashhivin , C. H. Robinson , G. Starr , A. Stenstrom , M. Stenstrom , O. Totland , P. L. Turner , L. Walker , P. J. Webber , J. M. Welker , and P. A. Wookey . 1999. Responses of tundra plants to experimental warming: meta-analysis of the international tundra experiment. Ecological Monographs, 69: 491–511.
- Barnes, B. V. , D. R. Zak , S. R. Denton , and S. H. Spurr . 1998. Forest Ecology. New York: Wiley. 774 pp.
- Bogaert, J. , L. Zhou , C. J. Tucker , R. B. Myneni , and R. Ceulemans . 2002. Evidence for a persistent and extensive greening trend in Eurasia inferred from satellite vegetation index data. Journal of Geophysical Research, 107, DOI 10.1029/2001JD001075.
- Chapin, F. S. and G. R. Shaver . 1996. Physiological and growth responses of arctic plants to a field experiment simulating climatic change. Ecology 77:822–840.
- Choi, K. , G. Lee , Y. J. Han , and J. M. Bunn . 1995. Tomato maturity evaluation using color image analysis. Transactions of the ASAE 38:171–176.
- Ewing, R. P. and R. Horton . 1999. Quantitative color image analysis of agronomic images. Agronomy Journal 91:148–153.
- Fung, I. 1997. A Greener North. Nature 386:659–660.
- Gonzalez, R. C. and R. E. Woods . 1992. Digital Image Processing. Reading, Mass.: Addison-Wesley Publishing Co. 716 pp.
- Hobbie, S. E. , K. J. Nadelhoffer , and P. Hogberg . 2002. A synthesis: the role of nutrients as constraints on carbon balances in boreal and arctic regions. Plant and Soil 242:163–170.
- Kane, D. L. , L. D. Hinzman , M-K. Woo , and K. R. Everett . 1992. Arctic hydrology and climate Change. In Chapin, F. S., Jefferies, R. L., Reynolds, J. F., Shaver, G. R., and Svoboda, J., (eds.), Arctic Ecosystems in a Changing Climate: An Ecophysiological Perspective. San Diego: Academic Press, 35–55.
- Kennedy, A. D. 1995. Simulated climate change: are passive greenhouses a valid microcosm for testing the biological effects of environmental perturbations?. Global Change Biology 1:29–42.
- Lucht, W. , I. C. Prentice , R. B. Myneni , S. Sitch , P. Friedlingstein , W. Cramer , P. Bousquet , W. Buermann , and B. Smith . 2002. Climatic control of the high-latitude vegetation greening trend and Pinatubo effect. Science 296:1687–1689.
- Marion, G. M. , G. H R. Henry , D. W. Freckman , J. Johnstone , G. Jones , M. H. Jones , E. Lévesque , U. Molau , P. Molgaard , A. N. Parsons , J. Svoboda , and R. A. Virginia . 1997. Open-top design for manipulating field temperature in high-latitude ecosystems. Global Change Bioliogy 3:20–32.
- Maxwell, B. 1992. Arctic Climate: potential for change under global warming. In Chapin, F. S., Jefferies, R. L., Reynolds, J. F., Shaver, G. R., and Svoboda, J., (eds.), Arctic Ecosystems in a Changing Climate: An Ecophysiological Perspective. San Diego: Academic Press, 11–34.
- McCarthy, J. J. , O. F. Canziani , N. A. Leary , D. J. Dokken , and K. S. White . 2001. Climate Change 2001: Impacts, Adaptation, and Vulnerability. Cambridge: Cambridge University Press. 1032 pp.
- Mooney, H. A. , J. Canadell , F. S. Chapin III. , J. R. Ehleringer , Ch Körner , R. E. McMurtrie , W. J. Parton , L. F. Pitelka , and E. D. Schulze . 1999. Ecosystem physiology responses to global change. In Walker, B., Steffen, W., Canadell, J., and Ingram, J., (eds.), The Terrestrial Biosphere and Global Change: Implications for Natural and Managed Ecosystems. Cambridge: Cambridge University Press, 141–189.
- Myneni, R. B. , C. D. Keeling , C. J. Tucker , G. Asrar , and R. R. Nemani . 1997. Increased plant growth in the northern high latitudes from 1981 to 1991. Nature 386:698–702.
- Myneni, R. B. , C. J. Tucker , G. Asrar , and C. D. Keeling . 1998. Interannual variations in satellite-sensed vegetation index data from 1981 to 1991. Journal of Geophysical Research 103:6145–6160.
- Nijs, I. , F. Kockelbergh , M. Heuer , L. Beyens , K. Trappeniers , and I. Impens . 2000. Climate-warming simulation in tundra: enhanced precision and repeatability with an improved infrared-heating device. Arctic, Antarctic, and Alpine Research 32:242–253.
- Nijs, I. , F. Kockelbergh , H. Teughels , H. Blum , G. Hendrey , and I. Impens . 1996. Free Air Temperature Increase (FATI): a new tool to study global warming effects on plants in the field. Plant Cell Environment 19:495–502.
- Oechel, W. C. and W. D. Billings . 1992. Effects of global change on the carbon balance of Arctic plants and ecosystems. In Chapin, F. S., III., Jefferies, R. L., Reynolds, J. F., Shaver, G. R., and Svoboda, J., (eds.), Arctic Ecosystems in a Changing Climate: An Ecophysiological Perspective. San Diego: Academic Press, 139–168.
- Pontailler, J. Y. and B. Genty . 1996. A simple red: far-red sensor using gallium arsenide phosphide detectors. Functional Ecology 10:535–540.
- Pridmore, R. W. 1999. Bezold-Brucke hue-shift as functions of luminance level, luminance ratio, interstimulus interval and adapting white for aperture and object colors. Vision Research 39:3873–3891.
- Richardson, M. D. , D. E. Karcher , and L. C. Purcell . 2001. Quantifying turfgrass cover using digital image analysis. Crop Science 41:1884–1888.
- Shabanov, N. V. , L. Zhou , Y. Knyazikhin , R. B. Myneni , and C. J. Tucker . 2002. Analysis of interannual changes in northern vegetation activity observed in AVHRR data from 1981 to 1994. IEEE Transactions on Geoscience and Remote Sensing 40:115–130.
- Shaver, G. R. and J. Kummerov . 1992. Phenology, resource allocation, and growth of Arctic vascular plants. In Chapin, F. S., Jefferies, R. L., Reynolds, J. F., Shaver, G. R., and Svoboda, J., (eds.), Arctic Ecosystems in a Changing Climate: An Ecophysiological Perspective. San Diego: Academic Press, 193–211.
- Tang, L. , L. Tian , and B. L. Steward . 2000. Color image segmentation with genetic algorithm for in field weed sensing. Transactions of the ASAE 43:1019–1027.
- Tucker, C. J. , I. Y. Fung , C. D. Keeling , and R. H. Gammon . 1986. Relationship between atmospheric CO2 variations and a satellite-derived vegetation index. Nature 319:195–199.
- Tucker, C. J. , D. A. Slaybeck , J. E. Pinzon , S. O. Los , R. B. Myneni , and M. G. Taylor . 2001. Higher northern latitude NDVI and growing season trends from 1982 to 1999. International Journal of Biometeorology 45:184–190.
- Watson, R. T. , M. C. Zinyowera , and R. H. Moss . 1998. The Regional Impacts of Climate Change: An Assessment of Vulnerability. Cambridge: Cambridge University Press. 517 pp.
- Zhou, L. , C. J. Tucker , R. K. Kaufmann , D. Slayback , N. V. Shabanov , and R. B. Myneni . 2001. Variations in northern vegetation activity inferred from satellite data of vegetation index during 1981 to 1999. Journal of Geophysical Research 106:20069–20083.