Abstract
We present here the 2001–2004 results of observational field studies aimed at quantifying tropical timberline climate and radial increment of Pinus hartwegii Lindl. trees on Nevado de Colima, in the middle of the North American Monsoon region. An automated weather station was installed at 3760 m a.s.l., 19°34.778′N latitude, 103°37.180′W longitude, within a forest where multi-century tree-ring records had been previously developed. At the same time, automated electronic sensors for recording tree growth at 30-min intervals were set up at two sites within a 1-km radius from the weather station. Meteorological observations recorded every 30 min were summarized on a daily basis. Time-series patterns are reported for atmospheric pressure, precipitation, incoming solar radiation, air and soil temperature, relative humidity, soil moisture, and wind speed and direction. Of particular interest is the sudden decrease in air temperature after the onset of the monsoon season, which determines very high relative humidity over the summer and results in air temperature having a spring maximum. Despite sub-freezing air temperatures in most months, soil temperatures never drop below 0°C. Dendrometer data show that the timberline growing season begins in March–April as temperature increases, then radial growth continues throughout the cool-wet summer monsoon, and ends in October–November. As an unexpected result, it was also possible to measure the progressive decline of Pinus hartwegii stem increment in response to an outbreak of roundheaded pine beetle (Dendroctonus adjunctus Blandford), which ultimately killed most trees at one of our two experimental sites.
Introduction
Modern paleoclimate research requires the careful, quantitative assessment of the climatic signals contained in a proxy record before proceeding to extrapolation into the past (CitationHardy et al., 1998; CitationAlverson, 2002). This is even more important when reconstructing natural variability at annual to decadal scales because of its direct relevance to human society in the context of global climate change. Among all archival records with annual resolution and time control, tree rings are uniquely suited for calibration/verification exercises because of the independent, internally consistent dating procedure of wood growth layers (CitationFritts and Swetnam, 1989). Because of this, together with the relatively greater ease of access to tree-ring sites than to other high-resolution natural archives, such as corals and ice caps, dendroclimatic reconstructions of precipitation and temperature in mid- to high-latitude environments are backed by a wealth of supporting empirical and experimental evidence on the mechanisms that link wood increment to those climatic variables (CitationFritts, 1976; CitationFritts et al., 1991; CitationShashkin and Vaganov, 1993). In tropical areas, on the other hand, dendroclimatology is a relatively new enterprise, and extreme care is needed to provide quantitative calibration of tree-ring records against instrumental data (CitationWorbes, 2002).
Despite the prominent role of the tropics in the global climate system (CitationHoerling and Kumar, 2003), terrestrial areas at low latitudes are still characterized by a paucity of high-resolution proxy records that could be used to understand climate variations over the past several centuries. Recently, progress has been made in the North American tropics by locating and exploiting old-growth stands of conifer species whose distribution was not known to expand so far south (CitationDíaz et al., 2002; CitationTherrell et al., 2002; CitationCleaveland et al., 2003), or by employing endemic species that were not previously studied (CitationBiondi, 2001; CitationDíaz et al., 2001). Most of these studies have reconstructed precipitation variability, either during the cool or the warm season. Especially for tree species whose ecophysiology has not been thoroughly investigated, it is vital to obtain as much information as possible on the mechanistic pathways that lead to the storage of climatic signals during tree-ring formation.
Pinus hartwegii Lindl. is Central America's highest altitude pine (CitationPerry Jr. et al., 1998). It usually forms pure stands at timberline on the high volcanic peaks of the Sierra Volcánica Transversal (Mexico), in Guatemala, and in isolated other parts of Mexico (CitationPerry Jr., 1991). The physiognomy of these stands resembles that of yellow pine forests in the western U.S.A. before Euro-American settlement, with an open, park-like tree layer as the overstory, and a herb-bunchgrass layer in the understory (CitationVelázquez et al., 2000). Although there is abundant field evidence of periodic wildfires (charred bark around the base of tree trunks, together with occasional fire-scarred trees), no fire-history study has yet been conducted in these ecosystems. Climatic regime is characterized by a wet summer season (the North American Monsoon; CitationAdams and Comrie, 1997) and sub-freezing minimum temperatures in most months of the year. Throughout the current distribution of Pinus hartwegii, needles vary in number from three to five in a bundle, but the prevailing number is usually five (CitationMcVaugh, 1992). Because of its location, the species has recently been the subject of global comparative studies on treeline ecophysiology and biogeography (CitationHoch and Körner, 2003; CitationKörner and Paulsen, 2004).
Mountain ecosystems are extremely rich and diverse, but are also sensitive and vulnerable to natural and human disturbance (CitationMesserli and Ives, 1997). Renewed attention to high-elevation land areas recently culminated in the United Nations' International Year of the Mountains—2002. Several studies have suggested that mountaintops are likely to be most impacted by climatic changes occurring on a global scale (CitationDiaz et al., 2003). Of such areas, the tropical timberline of North America has received little attention. Instrumental records of weather and climate tend to be concentrated at much lower altitudes, and indeed the Global Climate Observing System includes only three meteorological stations above 3000 m in all of western America (CitationBradley and Hardy, 2003).
In this paper we present two integrated approaches for determining the radial growth response to climate of Pinus hartwegii Lindl. trees located near timberline (as defined by CitationKörner, 1999) on Nevado de Colima, Mexico. Ground-truth, in situ data on weather and radial growth fluctuations were obtained using an automated weather station and electronic tree growth sensors. Our objective was to better define growing season length and climatology of tropical treelines; in particular, we wanted to test the hypothesis that radial growth of Pinus hartwegii is truly seasonal and directly related to summer monsoon precipitation.
Materials and Methods
Nevado de Colima is located at the western end of the Trans-Mexican Neovolcanic Belt. It is an andesitic volcano long extinct and covered by abundant vegetation, especially on its northern side (CitationMadrigal Sánchez, 1970). As Nevado rises about 4300 m a.s.l., forest ecosystems on its slopes occupy elevational zones that change along gradients of temperature and precipitation (CitationPerry Jr. et al., 1998). Pinus hartwegii dominates the timberline vegetation, forming uneven-aged stands with old-growth traits (CitationBiondi, 2001, Citation2002; CitationBiondi et al., 2003). The strategic location of this natural archive of environmental change within the North American Monsoon system can be shown by the relationship between the Nevado de Colima tree-ring chronology and summer Palmer Drought Severity Index over the Midwest plains (), which is consistent with a direct connection between monsoon precipitation in west-central Mexico and summer drought in the central U.S.A. (CitationHiggins et al., 1997).
WEATHER DATA
The automated weather station was installed on 20 May 2001 in an area on Nevado de Colima that is relatively accessible with a four-wheel-drive vehicle and that is actively being protected for conservation and research purposes by El Patronato del Nevado de Colima y Cuencas Adyacentes, A.C. It should be emphasized that no act of vandalism or human interference has occurred to date, despite the presence of people all year round and the high visibility of the equipment. On the contrary, a few days after the installation, local land managers built a fence all around the weather station (), as well as around the tree growth monitoring sites (see DENDROMETER DATA), to protect them from cattle damage, since grazing is allowed in the area. Here we present the instrumental design of the automated weather station and a summary of the observations recorded from 22 May 2001 to 24 March 2004 on atmospheric pressure, precipitation, incoming solar radiation, air and soil temperature, relative humidity, soil moisture, and wind speed and direction.
The automated weather station is located in an open, relatively flat area about 200 m below treeline on Nevado de Colima (3760 m elevation, 19°34.778′N latitude, 103°37.180′W longitude), within the Pinus hartwegii Lindl. forest, from which a 400-year-long tree-ring chronology has been developed (CitationBiondi, 2001). The station is made of well-proven, commercially available components, configured to operate at high elevation in the North American Monsoon region. Measurements and control functions are accomplished by a Campbell Scientific, Inc., model CR10X datalogger with 2 Mb of memory. All sensors are controlled by the datalogger, which stores processed data at 30-min intervals. With the current settings, the datalogger has sufficient memory to store about 12 months of data. Specialized software and RS232 interfaces are used for communication between the datalogger and a laptop computer.
Sensors consist of a Vaisala ultrasonic wind sensor, a LI-COR silicon pyranometer, a Kipp & Zonen pyranometer, a Vaisala temperature and relative humidity probe, a Vaisala barometric pressure sensor (specially calibrated for high-elevation sites to record pressures between 500 and 1100 mb), a Texas Electronics rain gaugeFootnote1, a Hydrological Services rain gauge (for high-intensity rainfall, up to 500 mm/h), a soil water content probe, and a soil temperature probe. Electrical power to the station is supplied by a 12-volt DC system that uses a 20-watt solar panel and regulator to recharge a sealed, 7 amp/h battery. The datalogger, battery, pressure sensor, and peripheral electronics are housed in a white, fiberglass-reinforced enclosure, which also contains desiccant packs to control humidity. Field maintenance followed standard guidelines (CitationBlauvelt, 2001; CitationHubbard and Sivakumar, 2001). Currently, it is not possible to remotely retrieve data from the station in near-real-time mode. A GOES satellite connection comprised of high-data-rate satellite transmitter with on-board GPS, antenna, and cables was included in the May 2001 installation, but it was never possible to obtain data via satellite, apparently due to a manufacturing defect in the transmitter. Because of this, sensor failures could only be detected during inspection trips, and repairs had to be delayed until the next visit. Despite such limitation, relatively few missing data are present in the 49,824-long record of 30-min observations ().
Post processing of the data required additional corrections. Wind speed and vector magnitudes, as well as wind gust, occasionally reached impossible values (up to 1000 mi/h!), possibly because of a “glitch” in the software that handles communication between the datalogger and the sonic anemometer. Based on the range of existing measurements from other high-elevation sites (Gregory D. McCurdy, Western Regional Climate Center, Desert Research Institute, Reno, Nevada, personal communication), values of wind speed and wind vector magnitude greater than 50 mi/h, and values of wind gust greater than 100 mi/h, were considered missing. Furthermore, any relative humidity reading that exceeded 100% was considered equal to 100%. Since records provided by the two pyranometers were extremely similar in both absolute values and time series variability, as suggested by their exceptionally high correlation (r > 0.99), we report only measurements from the Kipp & Zonen one. The original Julian day format was converted to a month and day format, and all variables recorded in imperial units were transformed into metric units.
The 30-min data downloaded from the datalogger were reduced to daily values for further analysis. This was accomplished by selecting, for each day, the maximum 30-min value for wind gust, maximum soil temperature, maximum air temperature, and maximum relative humidity; the minimum 30-min value for minimum soil temperature, minimum air temperature, and minimum relative humidity; the total of all 30-min values for solar radiation (in kJ m−2) and precipitation; the arithmetic average of all 30-min values for wind speed, standard deviation of the wind vector direction, soil moisture (water percent of total volume), and atmospheric pressure. The wind vector direction, which is recorded as a polar coordinate in degrees, was first transformed into two Cartesian components, which were then averaged to obtain daily values, and finally the X and Y means for each day were converted back to a polar coordinate in degrees. In addition, the daily ranges of air temperature, soil temperature, and relative humidity were computed by subtracting the daily minimum from the daily maximum.
DENDROMETER DATA
The second component of our study on tropical timberline dendroclimatology was to obtain tree growth observations at the same temporal scale as the weather records. In order to do so, in May 2001 we installed automated point and band dendrometers (CitationKeeland and Sharitz, 1993) to measure stem increment of Pinus hartwegii at two locations within a 1-km radius from the weather station. Point dendrometers, also called dial gage dendrometers (CitationReineke, 1932) or recording dendrometers (CitationFritts and Fritts, 1955), and dendrometer bands, also called vernier tree growth bands (CitationHall, 1944), have often been used to detect the seasonal growth patterns of woody species (CitationBormann and Kozlowski, 1962; CitationDeslauriers et al., 2003). Our setup, as detailed below, allowed continuous and accurate recording of changes in the diameter of tree trunks (7 at Site 1, 8 at Site 2) at 30-min intervals and with a resolution of a few microns (CitationDownes et al., 1999).
Site 1 (19°34.703′N, 103°37.137′W) is characterized by a west-northwest exposure, 25% slope, and 3790 m elevation. Site 2 (19°34.872′N, 103°36.728′W) has a north-northeast aspect and an average 3780 m elevation; it is farther away from the weather station and on a much steeper (58%) slope than Site 1. At each site, sensors were controlled by an underground field computer with 10 Mb of non-volatile memory, which is enough for recording up to 12 months of data at 30-min intervals. Specialized software and RS232 interfaces are used to communicate with a laptop computer. Electric power is supplied by a 6-volt DC system and solar panel. Trees closest to the underground computer were outfitted with sensors, hence sample selection was based solely on distance from the recording unit.
Sensors installed at each site consist of 3 band dendrometers, 11 point dendrometers, 1 phytogram per tree, 1 air temperature sensor, 1 photosynthetically active radiation sensor, 4 soil temperature probes, and 7 soil moisture probes. Soil probes were distributed around the site at similar depths. Point dendrometers were usually placed about 1.7–1.8 m above the ground on the south-facing side of the tree stem after shaving most of the bark underneath them. A few point dendrometers were installed on the north-facing side or without removing the bark or at a higher level to provide comparisons.
Unfortunately, the equipment was repeatedly damaged by lightning strikes, which are common at high elevations, but may have been even more frequent at the study sites because of the amount of electrical wire running above and below ground. Additional records were lost because of a rockfall at Site 2 and an insect outbreak at Site 1; the latter is described in detail in the section TREE GROWTH. During the first 24 months since installation, two dataloggers were destroyed by lightning, and various individual sensors malfunctioned due to grounding problems. Here we present the data that were salvaged from 2001 and 2002 at the two sites, including the remarkable growth signature produced by an outbreak of roundheaded pine beetle (Dendroctonus adjunctus Blandford), which ultimately killed most trees at one of our two experimental sites.
Results and Discussion
CLIMATE
Daily patterns of recorded environmental variables (, ) reveal important features of tropical timberline climate. First, the warmest days are in May, when solar insolation increases and the sky is mostly cloud-free. This combination of factors brings soil moisture to its lowest point during the year (). As soon as the monsoon precipitation begins, soil moisture increases while temperatures decrease rapidly, with daily minimum and maximum air temperatures in July being comparable to those during the winter months. Indeed, minimum air temperatures can drop below 0°C from July until March. On the other hand, daily minimum and maximum soil temperatures keep decreasing from May until January, but never fall below 0°C (). The lowest maximum soil temperature (0.86°C) was recorded on 10 February 2004, and the lowest minimum soil temperature (0.75°C) occurred just the previous day (). Maximum and minimum soil temperatures tend to follow quite similar patterns, as indicated by their very high correlation (r = 0.96), whereas maximum and minimum air temperatures are loosely coupled (r = 0.49). Linear correlation between soil and air temperatures is greatest for the two minima (r = 0.75) and smallest for minimum soil and maximum air temperatures (r = 0.44). The daily range of air temperature is on average about three times as large as the soil temperature range, and it can be as high as 15.7°C (). The difference in daily range between air and soil temperatures is related to nighttime conditions. In fact, maximum temperatures reach very similar values in the air and in the soil, whereas minimum temperatures in air are always significantly lower than in soil (, ). The seasonal cycle also differs between air temperature range, which is highest in winter and lowest in summer, and soil temperature range, which peaks in spring and bottoms in winter ().Footnote2
The wet summer season, which begins in late May to early June and ends in late October to early November, is clearly identified by the precipitation measurements (). The greatest amount of daily precipitation (164 mm) was recorded on 7 October 2003, with the second greatest value (108 mm) recorded just the day before, i.e., on 6 October 2003. Although isolated winter storms can occasionally bring moisture to the area, almost all precipitation falls between June and October, which causes relative humidity to be highest in those months (). This, in combination with low air temperatures, brings air to saturation, hence maximum relative humidity remains at 100% for several days in a row (). As minimum relative humidity increases in summer even more than the maximum one, the daily range of relative humidity bottoms out at this time of the year. The wet and dry seasons are also reflected in wind parameters: during the monsoon, winds tend to be mostly from the east (they are mostly from the west otherwise), with slightly greater variability in direction, and higher mean speed and peak gust ().
The most intense weather events were recorded in January. First, on 13 January 2002, the atmospheric pressure dropped to 646 mb, almost 6 standard deviations below the long-term mean of 654.4 mb (). Air temperature was extremely low, with the maximum falling below 0°C, to −0.85°C, and the minimum reaching −7.5°C (and −7.7°C the day after; ). Furthermore, 12 January was extremely cloudy, as shown by the very low value for incoming short-wave radiation (). On 13 January the mean 30-min standard deviation of the wind vector direction was only 0.5°, much lower than usual (). Winds were therefore constantly from the south (171°) and extremely strong. In fact, both wind speed and wind gust were considered missing for that day (because the sonic wind sensor showed values of 1000 mi/h), but they likely exceeded 160 km/h.
January 2004 was equally remarkable, having the lowest minimum temperatures on record (−12.7°C on 31 January, −10.6°C on 30 January, and −10.0°C on 17 January), and two sub-freezing maximum temperatures (−0.79°C on 16 January and −0.85°C on 30 January; ). The highest air temperature range (15.7°C) also occurred on 31 January (). Barometric pressure dropped to some of its lowest values: 647 on 17 January and 648 mb on 16, 30, and 31 January; such values are more than 4 standard deviations below the long-term mean (, ).
The impact of hurricane Kenna is clearly visible in several weather variables on 25 October 2002 (). However, many other storms had a greater impact on the study area than Kenna, such as the cyclonic system that brought extremely high rainfall on 6 and 7 October 2003 (). In conclusion, although precipitation falls mostly during the summer monsoon, extreme weather events have appeared more often outside of the summer season, i.e., during January (winter storms) and October (tropical storms; CitationEnglehart and Douglas, 2001).
TREE GROWTH
Trees monitored at Sites 1 and 2 are of various sizes (). Mean stem diameter (DBH, measured at 1.3–1.5 m above ground) is 55 ± 4 cm at Site 1, and 60 ± 7 cm at Site 2; mean tree height is 19.2 ± 1.3 m at Site 1, and 18.1 ± 1.2 m at Site 2. Inter-tree distance varies from 5.6 to 40.7 m at Site 1, and from 4.2 to 41.9 m at Site 2. Based on a two-sample t-test (CitationDavis, 1986), mean DBH, height, and inter-tree distance are not significantly different between the two sites (p-values > 0.25). Comparisons between growth patterns at the onset of the 2002 summer monsoon season are feasible at Site 2 (). Both daily and seasonal patterns of radial increment are shown by the individual curves. Tree trunks can either shrink or expand at hourly to daily timescales because of thermal and hydration processes unrelated to wood growth, but those changes are most pronounced when measurements include the bark (CitationKozlowski et al., 1991). Inside bark, some shrinkage is expected during the day when transpiration exceeds water absorption, while a small swelling may occur at night because of excess absorption with respect to transpiration. Despite the presence of daily cycles, the growing season onset is clearly defined by the time when stem size significantly increases on a monthly timescale: although patterns differ from one tree to another, most of them initiate growth by the second half of April ().
A complete representation of seasonal growth patterns is given by point dendrometers at Site 1 (). From these measurements, it is clear that diurnal cycles unrelated to wood growth are smoothed out and irrelevant when records are plotted over several months. It is also evident that wood formation begins in March–April and continues until October–November, and that a definite dormant period occurs between growing seasons. The graphical relationship between stem size and precipitation () reveals that occasional winter storms can create a temporary swelling of the trunk, which gradually returns to its previous size when water evaporates. This “hydration” noise is much larger for point dendrometers that measure radial changes outside bark. For such instruments (data not shown), stem size actually decreases after the summer precipitation, and trunk swelling from winter storms is greatly amplified. Considering the patterns of weather variables previously described, one can hypothesize that annual radial growth is initiated in response to increasing spring temperatures and then continues because of summer precipitation in conjunction with above-freezing soil temperatures.
Upon returning to Nevado de Colima in mid-March of 2003, we were surprised to find four of the seven trees at Site 1 dying from a pest infestation. Roundheaded pine beetle (Dendroctonus adjunctus Blandford) has been a problem in the Pinus hartwegii forest for some time. Local land managers usually contain the spread of the insects by cutting down affected trees and burning the litter. Trees had already been logged all around Site 1, and the only pines left with signs of infestation were those inside the fence that surrounds our instrumented trees. Because of the cluster of dead and dying trees, whose brownish crowns contrast with the green ones of the surrounding live trees, it was even possible to spot Site 1 from a distance, as it stood out in the overall landscape. While a disappointment for the long-term implications of our study, this situation yielded a unique opportunity for recording in real time the radial growth response to the beetle outbreak.
Increment patterns of infested trees are remarkably different from those of healthy trees (). In 2001, tree 7 was not growing as rapidly as the other three pines, which seemed quite healthy. In 2002, trees 2 and 5 (the ones attacked by bark beetles) display stem sizes that are either flat or declining, whereas trees 1 and 7 (spared by the insect outbreak) are growing normally. Damage from the beetle infestation is quite distinctive (CitationMassey et al., 1977), as yellowish resin mixed with boring dust may exude from the entry holes, making the attack points visible on the bark. We inspected Site 1 in June 2002 and again in December of that year, but there was no notice of any characteristic beetle damage at that time. However, the dendrometer data () point to a suppression of growth starting in July 2002. The initial infestation for documented cases in Nevada and New Mexico takes place during the fall, late September to early November. By May of the following year, the crowns turn light green and are often completely brown by July (CitationMassey et al., 1977). We argue that our dendrometer measurements reflect the true timing of the tree response to the beetle attack in this tropical treeline forest. The cessation and reversal of stem growth could be a result of the progressive inactivation of the vascular cambium combined with stem dehydration and shrinkage because of the reduced xylem tissue capable of actively conducting and transporting water and nutrients.
Conclusion
The research presented here clarified some of the unique ecoclimatological patterns and processes that take place at high elevation under a tropical summer-wet winter-dry climatic regime. We demonstrated that Pinus hartwegii grows annually in response to the increasing spring temperature and the summer monsoon precipitation. In addition, comparing the growth records of two infested pines with two unaffected ones allowed us to identify the timing, evolution, and signature of tree growth response to a bark beetle outbreak. Considering that our timberline field study began as part of a project on reconstructing the past behavior of the North American Monsoon system using climatically sensitive tree-ring records, our findings provide a small example, rich with intriguing connections, of the interplay between plants, insects, and the physical environment that can only be uncovered using intensively monitored, permanent research plots.
FIGURE 1. Map of linear correlation (blue upward triangles for r > 0, red downward triangles for r < 0) from 1915 to 1997 between the Nevado de Colima tree-ring chronology (green star) and summer (June through August) Palmer Drought Severity Index over U.S. climate divisions. Symbol size for point correlations is directly proportional to the absolute r value, as shown for the highest positive (0.37) and lowest negative (–0.22) point correlations. Contour intervals were objectively determined (CitationSmith and Wessel, 1990)
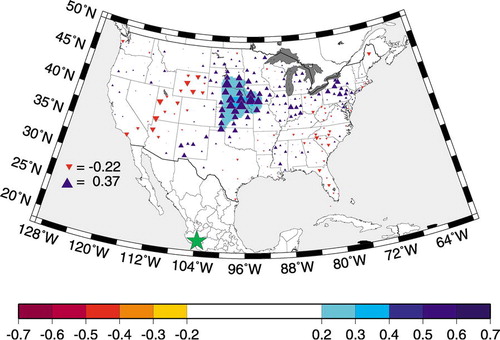
FIGURE 2. Automated weather station installed at the tropical timberline of Nevado de Colima, Mexico. This photograph was taken by F. Biondi on 2 April 2002
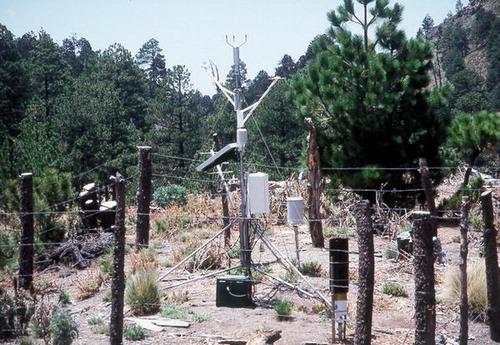
FIGURE 3. Plot of daily environmental variables from 22 May 2001 to 24 March 2004 (1038 days total). A dashed vertical line marks 1 January of each year, and the beginning of every month is marked by a dotted vertical line. (a) Temperature and moisture variables, together with solar radiation and atmospheric pressure. (b) Wind and relative humidity variables, together with daily temperature ranges
FIGURE 3. (Cont.)
FIGURE 4. Time-series plot of stem size during two months spanning the onset of the 2002 monsoon season. Measurements are taken at 30-min intervals by point dendrometers mounted on five trees at Site 2
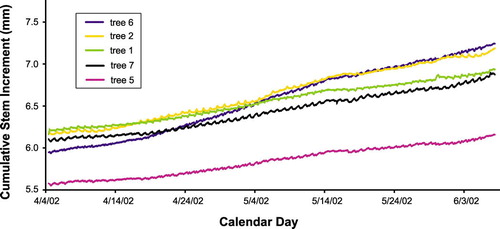
FIGURE 5. Time-series plot of stem size measured at 30-min intervals from 25 May 2001 until 10 October 2002 by point dendrometers mounted on four trees at Site 1. Radial increment of trees 2 and 5 stopped or declined in 2002 as the bark beetle infestation progressed, ultimately killing those two trees
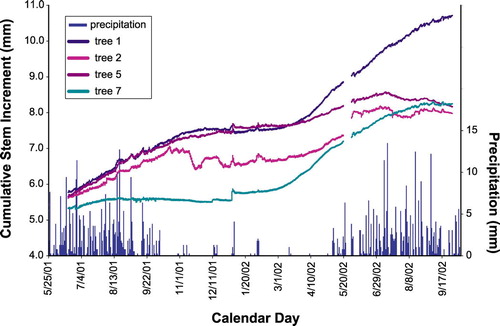
TABLE 1 Summary of daily weather observations recorded at Nevado de Colina, Mexico, from 22 May 2001 to 24 March 2004
TABLE 2 Features of Pinus hartwegii trees outfitted with point and band dendrometers on Nevado de Colima, Mexico
Acknowledgments
This material is based upon work supported by the National Science Foundation and by the National Oceanic and Atmospheric Administration of the U.S.A. Permission to install the equipment was granted by the “Patronado de Nevado de Colima y Cuencas Adyacentes A.C.,” Mexico. Greg McCurdy helped with acquiring, testing, and troubleshooting the automated weather station. Geoffrey Hope and Mark Williams provided comments on an earlier version of the manuscript.
Notes
A precipitation adapter was installed on 1–2 April 2002 for measuring precipitation in the form of hail or snow. However, because of instrument malfunctions, data from this sensor are not reported.
The extreme soil temperature range observed on 30 March 2003 is unrelated to other extreme weather events, and is most likely an outlier.
Related Research Data
References Cited
- Adams, D. K. and A. C. Comrie . 1997. The North American Monsoon. Bulletin of the American Meteorological Society 78:2197–2213.
- Alverson, K. 2002. Forward to the past: the future of PAGES. Global Change Newsletter 50:4–6.
- Biondi, F. 2001. A 400-year tree-ring chronology from the tropical treeline of North America. Ambio 30:162–166.
- Biondi, F. 2002. Treeline dendroclimatology in the North American tropics. PAGES News 10:9–10.
- Biondi, F. , I. Galindo Estrada , A. Elizalde Torres , and J. C. Gavilanes Ruiz . 2003. Tree growth response to the 1913 eruption of Volcán de Fuego de Colima, Mexico. Quaternary Research 59:293–299.
- Blauvelt, K. 2001. Maintenance and calibration manual for the automated weather data network. Lincoln, Nebraska, High Plains Climate Center, 85 pp.
- Bormann, F. H. and T. T. Kozlowski . 1962. Measurements of tree growth with dial gage dendrometers and vernier tree ring bands. Ecology 43:289–294.
- Bradley, R. S. and D. R. Hardy . 2003. A high elevation climate reference network for the Americas. IAI Annual Science Meeting: 6–11.
- Cleaveland, M. K. , D. W. Stahle , M. D. Therrell , J. Villanueva-Diaz , and B. T. Burns . 2003. Tree-ring reconstructed winter precipitation and tropical teleconnections in Durango, Mexico. Climatic Change 59:369–388.
- Davis, J. C. 1986. Statistics and data analysis in geology. Second edition. New York, Wiley, 646 pp.
- Deslauriers, A. , H. Morin , C. Urbinati , and M. Carrer . 2003. Daily weather response of balsam fir ( Abies balsamea (L.) Mill.) stem radius increment from dendrometer analysis in the boreal forests of Québec (Canada). Trees 17:477–484.
- Diaz, H. F. , M. Grosjean , and L. J. Graumlich . 2003. Climate variability and change in high elevation regions: past, present and future. Climatic Change 59:1–4.
- Díaz, S. C. , R. Touchan , and T. W. Swetnam . 2001. A tree-ring reconstruction of past precipitation for Baja California Sur, Mexico. International Journal of Climatology 21:1007–1019.
- Díaz, S. C. , M. D. Therrell , D. W. Stahle , and M. K. Cleaveland . 2002. Chihuahua (Mexico) winter-spring precipitation reconstructed from tree-rings, 1647–1992. Climate Research 22:237–244.
- Downes, G. M. , C. Beadle , W. Gensler , D. Mummery , and D. Worledge . 1999. Diurnal variation and radial growth of stems in young plantation eucalyptus. In Wimmer, R., and Vetter, R. E. (eds.), Tree-Ring Analysis: Biological, Methodological and Environmental Aspects. New York, CABI Publishing, 83–103.
- Englehart, P. J. and A. V. Douglas . 2001. The role of eastern North Pacific tropical storms in the rainfall climatology of western Mexico. International Journal of Climatology 21:1357–1370.
- Fritts, H. C. 1976. Tree Rings and Climate. London, Academic Press, 567 pp.
- Fritts, H. C. and E. C. Fritts . 1955. A new dendrograph for recording radial changes of a tree. Forest Science 1:271–276.
- Fritts, H. C. and T. W. Swetnam . 1989. Dendroecology: a tool for evaluating variations and present forest environments. In Begon, M., Fitter, A. H., Ford, E. D., and MacFadyen, A. (eds.), Advances in Ecological Research: Academic Press, 111–188.
- Fritts, H. C. , E. A. Vaganov , I. V. Sviderskaya , and A. V. Shashkin . 1991. Climatic variation and tree-ring structure in conifers: empirical and mechanistic models of tree-ring width, number of cells, cell size, cell wall thickness and wood density. Climate Research 1:97–116.
- Hall, R. C. 1944. A vernier tree growth band. Journal of Forestry 42:742–743.
- Hardy, D. R. , M. Vuille , C. Braun , F. Keimig , and R. S. Bradley . 1998. Annual and daily meteorological cycles at high altitude on a tropical mountain. Bulletin of the American Meteorological Society 79:1899–1914.
- Higgins, R. W. , Y. Yao , and X. L. Wang . 1997. Influence of the North American Monsoon system on the U.S. summer precipitation regime. Journal of Climate 10:2600–2622.
- Hoch, G. and C. Körner . 2003. The carbon charging of pines at the climatic treeline: a global comparison. Oecologia 135:10–21.
- Hoerling, M. and A. Kumar . 2003. The perfect ocean for drought. Science 299:691–694.
- Hubbard, K. G. and M. V K. Sivakumar . 2001. Automated Weather Stations for Applications in Agriculture and Water Resources Management: Current Use and Future Perspectives. Lincoln, Nebraska, High Plains Climate Center, 248 pp.
- Keeland, B. D. and R. R. Sharitz . 1993. Accuracy of tree growth measurements using dendrometer bands. Canadian Journal of Forest Research 23:2454–2457.
- Körner, C. 1999. Alpine Plant Life. Berlin, Germany, Springer-Verlag, 340 pp.
- Körner, C. and J. Paulsen . 2004. A world-wide study of high altitude treeline temperatures. Journal of Biogeography 31:713–732.
- Kozlowski, T. T. , P. J. Kramer , and S. G. Pallardy . 1991. The Physiological Ecology of Woody Plants. San Diego, California, Academic Press, 657 pp.
- Madrigal Sánchez, X. 1970. Caracterizacion Fito-ecologica Preliminar de los Volcanes de Fuego y Nevado de Colima (Mexico). Mexico City, Instituto Nacional de Investigaciones Forestales, 37 pp.
- Massey, C. L. , D. D. Lucht , and J. M. Schmid . 1977. Roundheaded Pine Beetle. U.S. Department of Agriculture Forest Service, Forest Insect and Disease Leaflet 155, 8 pp.
- McVaugh, R. 1992. Flora Novo-Galiciana. Ann Arbor, The University of Michigan Herbarium, 963 pp.
- Messerli, B. and J. D. Ives . 1997. Mountains of the World: A Global Priority. New York, Parthenon, 495 pp.
- Perry Jr, J. P. 1991. The Pines of Mexico and Central America. Portland, Oregon, Timber Press, 231 pp.
- Perry Jr, J. P. , A. Graham , and D. M. Richardson . 1998. The history of pines in Mexico and Central America. In Richardson, D. M. (ed.), Ecology and Biogeography of Pinus. Cambridge, U.K., Cambridge University Press, 137–149.
- Reineke, L. H. 1932. A precision dendrometer. Journal of Forestry 30:692–697.
- Shashkin, A. V. and E. A. Vaganov . 1993. Simulation model of climatically determined variability of conifers annual increment (on the example of common pine in the steppe zone). Russian Journal of Ecology 24:275–280.
- Smith, W. H F. and P. Wessel . 1990. Gridding with a continuous curvature surface in tension. Geophysics 55:293–305.
- Therrell, M. D. , D. W. Stahle , M. K. Cleaveland , and J. Villanueva-Diaz . 2002. Warm season tree growth and precipitation over Mexico. Journal of Geophysical Research—Atmospheres 107:4205–4212.
- Velázquez, A. , V. M. Toledo , and I. Luna . 2000. Mexican temperate vegetation. In Barbour, M. G., and Billings, W. D. (eds.), North American Terrestrial Vegetation. New York, Cambridge University Press, 573–592.
- Worbes, M. 2002. One hundred years of tree-ring research in the tropics—a brief history and an outlook to future challenges. Dendrochronologia 20:217–232.