Abstract
Intraseasonal patterns of normalized difference vegetation index (NDVI), leaf area index (LAI), and phytomass were compared for four tundra vegetation types at Ivotuk, Alaska, during summer 1999. The vegetation types included moist acidic tundra (MAT), moist nonacidic tundra (MNT), mossy tussock tundra, and shrub tundra. The seasonal curves of NDVI were similar among the vegetation types but with varying magnitudes of the peak values. Peak NDVI in the shrub tundra (0.83) was significantly greater than in MAT (0.76), which was significantly greater than in MNT (0.71) and mossy tussock tundra (0.70). LAI and phytomass exhibited high temporal variability with distinct seasonality only in shrub tundra. Seasonal LAI and NDVI patterns were therefore correlated only in shrub tundra, which was attributed to the high quantity of deciduous shrub foliage present in this community and absent in the other vegetation types. Shrub tundra peak live above-ground phytomass (1256 ± 123 g m−2) was significantly greater than peak live above-ground phytomass for MAT, MNT, and mossy tussock tundra (722 ± 71, 773 ± 53, 703 ± 39 g m−2 respectively, P < 0.05). Relative abundances of deciduous shrubs, mosses, and graminoids were revealed as key components controlling differences in NDVI, LAI, and phytomass among tundra vegetation types.
Introduction
Recognition of the complexity and importance of arctic tundra ecosystems with regard to their sensitivity to climate change (CitationOechel et al., 1993, Citation1994; CitationChapin et al., 1995; CitationMyneni et al., 1997; CitationArft et al., 1999; CitationEpstein et al., 2000) has established the need for more detailed analyses into tundra vegetation. Some recent studies have focused on understanding landscape heterogeneity of tundra vegetation caused by topography (CitationGiblin et al., 1991; CitationShaver and Chapin, 1991; CitationWalker and Everett, 1991; CitationShaver et al., 1996) and local variations of substrate (CitationM. D. Walker et al., 1994; CitationGough et al., 2000; CitationD. A. Walker et al., 2001, Citation2003a). Total live plant biomass and net primary production are highly variable among communities along toposequences (CitationShaver and Chapin, 1991; CitationWalker and Everett, 1991; CitationShaver et al., 1996); in general, these system properties are greatest in well-drained riparian areas followed by moist mid-slope tussock tundra communities. Phytomass levels in lowland wet sedge communities are typically considered limited by poor nutrient supply resulting from anaerobic conditions. Upland dry heath communities can exhibit lower levels of phytomass and production, compared to mid-slope tussock tundra, due to winter desiccation on exposed ridges and its effect on plant community composition (CitationShaver and Chapin, 1991). One study conducted on a toposequence in northern Alaska, found that the highest total live plant biomass and second highest productivity occurred in the hilltop birch-heath section of the toposequence (CitationShaver et al., 1996). Local differences in biomass, productivity, and species composition may result from variations in nutrient availability, which are consequences of the interaction of topography and other environmental variables.
Differences in soil pH can play a key role in affecting the local variation of tundra vegetation properties. Distribution patterns of acidic and nonacidic soils have been observed at the regional scale (CitationWalker et al., 1998), and soil pH in arctic tundra can also vary considerably at the landscape scale (100s of meters) (CitationBockheim et al., 1998). While the ultimate control on the distribution of nonacidic communities is not fully understood (CitationBockheim et al., 1998), differences in peat formation are considered a major control of the acidity of arctic soils (CitationM. D. Walker et al., 1994). Low-pH soils are hypothesized to occur when peat formation results in restricted drainage and accumulation of acidophilic mosses, which in turn alters the soil chemistry (CitationM. D. Walker et al., 1994). The existence of nonacidic soils can be attributed to several natural disturbances, including loess deposition, glacial till (CitationWalker and Everett, 1991), solifluction, alluvial process (CitationM. D. Walker et al., 1994), cryoturbation (CitationBockheim et al., 1998), and differences in landscape age (CitationWalker et al., 1998). The differences in soil properties have a substantial effect on ecosystem processes (CitationWalker et al., 1998; CitationGough et al., 2000; CitationHobbie and Gough, 2002). Compared to acidic tundra, nonacidic tundra has been shown to have thinner organic horizons, greater soil heat flux, deeper summer thaw, and greater concentrations of calcium, and serves as less of a carbon sink and a smaller methane source (CitationBockheim et al., 1998; CitationWalker et al., 1998).
Differing nutrient regimes can have important implications for vegetation properties in tundra ecosystems, many of which are considered nutrient limited (CitationChapin et al., 1986; CitationShaver et al., 2001). Compared to acidic tundra communities, nonacidic communities have greater biodiversity (CitationM. D. Walker et al., 1994; CitationGough et al., 2000). Species composition is also quite different; moist acidic tundra (MAT) communities are dominated by the sedge, Eriophorum vaginatum, Sphagnum mosses and dwarf shrubs such as Betula nana, while moist nonacidic tundra (MNT) communities are generally dominated by the sedge, Carex bigelowii, and Dryas integrifolia, a prostrate shrub (CitationM. D. Walker et al., 1994).
Recent findings indicate that the presence of MNT is not an isolated or small-scale occurrence (CitationWalker et al., 1998, Citation2001), thus providing further evidence that the natural patchiness of vegetation types is common across the tundra even on subregional scales. Some previous studies have focused on quantifying differences in vegetation attributes between MNT and MAT (CitationWalker et al., 1998; Citation2001, Citation2003a; CitationGough et al., 2000; CitationHobbie and Gough, 2002; CitationJia et al., 2002). The majority of the studies have typically focused on comparing vegetation properties at the peak of the growing season. Several studies have captured the intraseasonal variation of tundra vegetation, but have been limited to the use of satellite data (CitationStow et al., 1993; CitationJia et al. 2004), and therefore the spatial scale at which vegetation properties can be examined is bound by resolution of the satellite data.
The objective of this study was to investigate the spatial and temporal patterns of tundra vegetation that result from differences in soil properties and topographic location. Seasonal patterns of field-derived normalized difference vegetation index (NDVI), leaf area index (LAI), and phytomass have not been compared across an entire growing season for a set of distinct tundra vegetation types that occur within the same landscape. Seasonal patterns of NDVI, LAI, and phytomass were analyzed to determine how vegetation properties vary among distinct types that exist as a result of landscape scale heterogeneity. Additionally, seasonal patterns of vegetation properties were compared to examine how the level of spatial heterogeneity varied throughout the growing season. Finally, this study provides a critical baseline for ground measurements of tundra vegetation properties against which future measurements from the same site can be compared.
Methods
Our study site was Ivotuk, Alaska (68.49°N, 155.74°W), which is located on the North Slope of the Brooks Mountain Range and is characterized by a growing season of approximately 110 d and a mean July maximum daily temperature of ∼12°C. Mean annual temperature is −10.9°C, and mean annual precipitation is 202 mm based on a 3-yr dataset (1991–2001; Hinzman, unpublished data). Ivotuk was a key sampling location for the NSF Arctic Transitions in the Land-Atmosphere System (ATLAS) study as part of a western North Slope transect from Point Barrow to the Seward Peninsula. Ivotuk was chosen as a research site because it has one of the few airstrips in all of northwestern Alaska, and it is comparable to Toolik Lake, a National Science Foundation Long-Term Ecological Research site found approximately 200 km to the east. Additionally, the study site was chosen because four tundra vegetation types, moist acidic tundra (MAT), moist nonacidic tundra (MNT), mossy tussock tundra, and shrub tundra exist within a 2 km2 area. Examining the heterogeneity of tundra vegetation was accomplished by comparing ecosystem properties across distinct vegetation types that occur largely as a result of differences in hydrologic regime and soil pH. In this study the MNT site differed from the other three vegetation types in that it is the only site with nonacidic soils (). The shrub tundra site is located in a low slope position and drainage channel, compared to mid and upper slope positions for the two other vegetation types found on acidic soils (). The vegetation types examined in this study are common throughout the North Slope and have been classified as distinct types in numerous studies (CitationShaver et al., 1996; CitationM. D. Walker et al., 1994; CitationD. A. Walker et al., 1998, Citation2001, Citation2003a; CitationGough et al., 2000, CitationJia et al., 2004).
The vegetation at the MAT site is composed of Eriophorum vaginatum, Sphagnum mosses, and dwarf shrubs, including Betula nana. The MNT site, found on neutral pH soils, has a vegetative community dominated by Carex bigelowii and Dryas integrifolia, as well as non-Sphagnum mosses. The mossy tussock tundra site is composed mostly of Sphagnum mosses, Eriophorum vaginatum, Betula nana, and lichens. The shrub tundra site is dominated by Salix pulchra and Betula nana ().
NDVI, LAI, and above-ground phytomass samples were collected biweekly from four 100 m × 100 m grids, each representative of a different vegetation type, during the 1999 growing season. Field measurements were divided into seven sampling periods beginning 5 June and ending 27 August. LAI and NDVI measurements were taken at 20 random points within each grid; the same 20 points were used throughout the growing season. From prior sampling, we determined that 20 random points in a 100 m × 100 m grid were sufficient for capturing the variability at this spatial scale. NDVI was measured using an Analytical Spectral Devices FieldSpec spectroradiometer (Boulder, Colorado). The reflectance data for the pertinent wavelength intervals were used to calculate NDVI from the formula
where NIR is the near infrared reflectance (average reflectance of wavelengths between 725 and 1060 nm), and “red” is the red reflectance (average reflectance of wavelengths between 580 and 680 nm) of the vegetation. Four replicate measurements were taken 1 m north, east, south, and west of each grid point and averaged to give a mean NDVI value. The fiber optic sensor of the FieldSpec spectroradiometer was held approximately 1.5 m above the surface of the vegetation, providing a 0.35-m2 footprint using a 25° field of view. The spectroradiometer was calibrated with dark and pure white readings before measurements at each grid point.
LAI which is simply the total leaf area per unit ground surface area (m2 m−2) is commonly measured optically, as it was in this study, using a LI-COR LAI-2000 Plant Canopy Analyzer (Lincoln, Nebraska). Above- and below-canopy radiation measurements are made with a “fish eye” optical sensor with a 5-ring 148° angle of view. Below-canopy measurements were made from the top of the moss layer. LAI is calculated using a model of radiative transfer in vegetation canopies and then stored in the unit data logger. At each of the 20 grid points, one above canopy reading was taken, and four below canopy readings were taken (1 m north, east, south, and west of the grid point) to yield a single LAI value.
Above-ground phytomass was collected from 10 randomly selected 20 cm × 50 cm plots within each grid, for a total of 1 m2 per vegetation type for each of the first six sample periods. Phytomass sampling occurred near, but not within, the footprints of LAI and NDVI measurements. On the fourth sample period (15–26 July), the number of phytomass plots harvested was doubled for MAT and mossy tussock tundra in order to more accurately capture peak biomass. On the fifth sample period (27 July–7 August), the number of phytomass plots harvested was doubled for MNT and shrub tundra, for the same reason. Vascular plants were clipped at the top of the moss surface; mosses were clipped at the base of the green layer. Phytomass samples were sorted into six main categories (horsetails, other forbs, graminoids, lichens, mosses, and shrubs). Horsetails were separated from other forbs because they can represent a substantial component of the plant community in the nonacidic tundra. The graminoid and shrub samples were sorted further into subcategories. Graminoid phytomass was divided into live and dead material. Shrub phytomass was divided into evergreen and deciduous, which were then separated into woody, foliar live, and foliar dead components. Dead material was combined into a single pool, referred to as “standing dead.” Therefore when we refer to specific components of phytomass or total phytomass, we are referring only to the above-ground live fraction.
Comparison of seasonal patterns of LAI, NDVI, and phytomass among the four vegetation types was accomplished using a repeated measures general linear model (SPSS 8.0). Peak LAI, NDVI, and phytomass among the four vegetation types were compared using ANOVA. Above-ground net primary productivity (ANPP) was estimated by subtracting initial phytomass from peak phytomass. Coefficients of variation were calculated for mid-growing season phytomass values to investigate the level of heterogeneity within vegetation types. Results were used to determine the controls that local substrate and topography have on vegetation patterns. Finally, we compared biomass and ANPP data from Ivotuk to other similar datasets collected near the Toolik Lake Long-Term Ecological Research site within the Kuparuk River Basin, located approximately 200 km to the east of Ivotuk (CitationShaver and Chapin, 1991; CitationShippert et al., 1995; CitationWalker et al., 1995; CitationShaver et al., 1996, Citation2001; CitationWilliams and Rastetter, 1999, CitationHobbie et al., 2002; CitationWalker et al. 2003a, Citation2003b; CitationEpstein et al., 2004).
Results
The seasonal patterns of NDVI were significantly different among the four vegetation types (repeated measures GLM, P < 0.05) (). Early season (7–10 June) values of NDVI were generally similar for all vegetation types, with no statistical difference between MAT, mossy tundra, and shrub tundra. Peak season NDVI values occurred at the same time for three vegetation types (16 July), the exception being the mossy tussock tundra (27 July). The peak value of NDVI in shrub tundra (0.83 ± 0.01; mean ± one standard error) was significantly greater than in the MAT (0.76 ± 0.01), which was significantly greater than in the MNT (0.71 ± 0.01) and the mossy tundra (0.70 ± 0.01) (P < 0.05). Late season (22–26 August) NDVI values were again not statistically different for MAT, mossy tundra, and shrub tundra, while MNT values were significantly lower. In all vegetation types the shapes of the seasonal patterns were generally similar; however, the magnitude of the seasonal increase was dependent on vegetation type. For example, NDVI increased by 44% from early to mid-growing season in the shrub tundra, while increasing by only 20% in the mossy tussock tundra.
The seasonal patterns of LAI were significantly different among the four vegetation types (repeated measures GLM, P < 0.05) (). Peak values of LAI were observed at different times throughout the growing season, depending on vegetation type. Shrub tundra was the only vegetation type in which the seasonal pattern of LAI exhibited a notable peak at mid-growing season (24 July). LAI values in the MNT showed little variation over the course of the growing season with a slight peak relatively early (5 July). LAI values in the MAT and mossy tundra were variable throughout the course of the growing season. In both MAT and mossy tundra, peak LAI values were observed at the end of our sampling season (27 August). The peak value of LAI in the shrub tundra (2.93 ± 0.30) was significantly greater than peak values of LAI in MAT (2.26 ± 0.23) and in mossy tussock tundra (1.75 ± 0.23), which were significantly greater than those in the MNT (0.71 ± 0.10) (P < 0.05).
The seasonal patterns of total phytomass were also significantly different among the four vegetation types (repeated measures GLM, P < 0.05) (). In the shrub tundra and MNT, quantities of total phytomass peaked during mid-season (8 July and 10 July, respectively), while total phytomass quantities in MAT and mossy tundra peaked later in the growing season (29 July and July 30, respectively). The peak total phytomass in shrub tundra (1256 ± 123 g m−2) was significantly greater than peak total live phytomass for MAT, MNT, and mossy tundra (722 ± 71, 773 ± 53, 703 ± 39 g m−2 respectively, P < 0.05) ().
The two dominant life forms found across tundra vegetation types were shrubs and mosses, which comprised over 80% of the total peak phytomass for all four of the tundra types (). However, the relative abundance of the specific phytomass components and the seasonal patterns of these components showed significant variation among the vegetation types (). Moss phytomass made up a large proportion of total peak phytomass in the MNT (80%) and mossy tussock tundra (64%), unlike in the MAT and shrub tundra, where only approximately 30% of the total phytomass was moss. In the MAT and shrub tundra, the shrubs were the dominant life form comprising over 50% of the total phytomass. Shrub phytomass comprised less than one fifth of the total phytomass in MNT (8%) and mossy tundra (18%). Graminoid phytomass made up 11 and 15% of total phytomass in the MAT and mossy tundra respectively, but in the MNT and shrub tundra less than 4% of total phytomass was composed of graminoids.
MAT exhibited the highest ANPP (479 g m−2 yr−1), only slightly greater than the shrub tundra (459 g m−2 yr−1) (). There was considerably less productivity observed in MNT (357 g m−2 yr−1) than in MAT and shrub tundra, and the mossy tussock tundra had the lowest rate of ANPP of all vegetation types (140 g m−2 yr−1). Spatial coefficients of variation were relatively similar across vegetation types (). All four tundra types had high coefficients of variation for lichen biomass (78–222%) and low coefficients of variation for shrub biomass (36–44%). Spatial variation in forb biomass was high for MAT (182%) and MNT (149%).
Total above-ground live biomass values for MAT at Ivotuk (using data from this study and CitationWalker et al. [2003b]) averaged 780 g m−2 and fell within the range of values (although on the high side) estimated for areas near Toolik Lake (444–789 g m−2). In general, greater moss, deciduous shrub and graminoid biomass at Ivotuk accounted for the relatively greater total biomass at Ivotuk compared to Toolik Lake. ANPP estimates of MAT from Ivotuk were substantially greater than those estimated for the Toolik Lake area, 479 g m−2 yr−1 at Ivotuk compared to a range of 144–266 g m−2 yr−1 for Toolik. Total above-ground live biomass values for MNT was approximately 60% greater at Ivotuk compared to the Toolik Lake area, with average values of 644 g m−2 at Ivotuk compared to 401 g m−2 at Toolik. Toolik MNT had somewhat greater shrub and graminoid biomass compared to Ivotuk, however, substantially greater moss biomass at Ivotuk (465 g m−2 compared to 115 g m−2 at Toolik) accounted for the difference. Vascular plant ANPP for MNT at Ivotuk was estimated to be 95 g m−2 yr−1 compared to an estimate of 127 g m−2 yr−1 from Toolik Lake (CitationHobbie et al., 2002). Total above-ground biomass in shrub tundra at Ivotuk was calculated to be 1037 g m−2, which was relatively similar to the mean of 1077 g m−2 found near Toolik Lake (range of 750–1394 g m−2). ANPP estimates for shrub tundra at Ivotuk were 459 g m−2 yr−1 compared to 310 g m−2 yr−1 at Toolik Lake; greater shrub and nonvascular plant productivity at Ivotuk compared to Toolik Lake accounted for the difference.
Discussion
NDVI was relatively similar among the vegetation types both early and late in the growing season, but with varying magnitudes of the peak values. Our results are consistent with two studies that used satellite data to compare seasonal patterns of NDVI among arctic tundra vegetation types (CitationHope et al., 2003; CitationJia et al., 2004). CitationJia et al. (2004) also found the highest NDVI in the shrub tundra, and both studies found NDVI in MAT to be greater than in MNT. The larger increase of NDVI from early to mid-season observed in the shrub tundra versus MAT, could have been due in part to the larger increase in the total quantity of phytomass, but was most likely due to increases in specific components of phytomass. Several studies have shown that the presence of shrub phytomass has a significant influence on variations of NDVI in tundra vegetation (CitationHope et al., 1993; CitationWalker et al., 1995; Citation2003a, CitationRiedel et al., 2005). The seasonal quantities of shrub phytomass found in each vegetation type coincided with the seasonal levels of NDVI (the quantity of shrub phytomass and seasonal magnitude of NDVI were significantly greater in the shrub tundra than in the MAT, which were significantly greater than in both the MNT and mossy tussock tundra) (, ). These results suggest that vegetation types with different total phytomass quantities and plant community structure can exhibit similar NDVI values during the early and late portions of the growing season. However, over the course of the growing season differences in shrub phytomass yield differences in foliar production and therefore a separation of the patterns of NDVI, or an increased “greening up,” in areas with high abundance of shrubs, particularly deciduous shrubs.
Observing similar NDVI values among the vegetation types early and late in the growing season indicated that if the spatial pattern of NDVI were examined at Ivotuk at these time periods, the landscape would look homogenous. However, at peak season there was a difference in NDVI between shrub tundra and MNT of 0.12, which was similar to that found in a study comparing vegetation types at a coarser scale (1 km2) using NOAA's Advanced Very High Resolution Radiometer (AVHRR) (CitationJia et al., 2004). The level of spatial variability in peak NDVI from our study was approximately equal to the temporal change in NDVI from early June to peak season found in the MNT and almost half the temporal change in NDVI found in the shrub tundra during that period. The distinct seasonal patterns observed in this study illustrate the variability of NDVI patterns among the vegetation types and demonstrate that there is a significant amount of spatial variation even at the landscape scale.
We assumed that quantities of live foliar deciduous shrub phytomass would also have the strongest influence on seasonal patterns of LAI, resulting in a seasonal trend that increases to a mid-season peak (coinciding with mid season foliar growth) and declines late in the growing season due to leaf senescence. The results from this study support the fact that shrub foliar material has an important control on LAI, but also suggest that the presence of graminoids and standing dead may substantially influence LAI, when estimated using these optical, nondestructive methods. The only notable mid-season peak in LAI occurred in the shrub tundra. Not surprisingly the shrub tundra was the only vegetation type with a relatively high productivity of deciduous shrubs (). A smaller mid season increase of LAI was observed in the MAT, coinciding with the productivity of evergreen shrubs () and a peak in graminoid phytomass.
In both the MAT and mossy tussock tundra the highest LAI values occurred at the end of our sampling season (end of August). This is most likely attributed ultimately to the absence of substantial deciduous foliar shrub phytomass and the relatively high quantities of graminoid phytomass found in these two vegetation types (). The standing dead pool in these communities consists mostly of dead graminoids, and consequently where there were large amounts of graminoid phytomass, we found large amounts of standing dead. MAT and mossy tundra had considerably higher ratios of standing dead to total phytomass than found in MNT and shrub tundra. Standing dead material blocks incoming solar radiation and therefore contributes to LAI when these particular methods (attenuation of solar radiation) are used. As the growing season progresses the effect of the high abundance of graminoids on LAI will increase due to continued plant growth combined with the accumulation of graminoid standing dead, and consequently the peak in LAI occurred at the end of the growing season in the MAT and mossy tundra.
Across the growing season, LAI values in the MAT and mossy tussock tundra were highly variable, and the peak values of LAI did not coincide with the peak greenness (NDVI). Some of this is likely due to LAI sampling variability associated with time of day, cloudiness, and sampling inconsistencies, even though we tried to minimize these. However, part of the discrepancy between the LAI and NDVI curves is due to the specific phytomass components that are included in each of these measurements. LAI measurements were taken above the moss layer, therefore mosses are not part of LAI, but they will contribute to NDVI values. Standing dead tissue will be included in LAI, but will not contribute in large part to NDVI, which is essentially an index of green vegetation. In the mossy tussock tundra, high quantities of mosses and graminoids outweigh any minor peak in green shrub material that occurred at mid-season, suggesting that we should not expect a temporal correlation between LAI and NDVI. It was more surprising that peak LAI did not coincide with peak NDVI in the MAT, however again this was due to the plant structure present at that site. Even though MAT had high levels of shrub phytomass, the majority was either in woody or evergreen material, neither of which have a substantial peak at mid-season. As a result there was no definitive mid-season peak in LAI, and consequently the peak greenness from NDVI did not coincide with the peak of LAI.
In MNT, the seasonal LAI had low values and showed little variation. This resulted from the very low quantity of shrub phytomass, resulting in low shrub foliar production () coupled with the relatively high quantity of moss phytomass. In the MNT 76% of total phytomass was composed of mosses which, again due to the sampling method, are not included in the LAI measurements.
Seasonal and peak quantities of total phytomass were similar in all vegetation types except for shrub tundra, which had significantly more total phytomass. The total phytomass was between 60 and 80% greater in the shrub tundra versus the other three vegetation types. The similarity in quantities of total phytomass observed in the other three tundra types was unexpected. In some research comparing plant biomass quantities in MAT and MNT conducted in the Arctic, MAT was found to have greater above-ground plant biomass than MNT (CitationShippert et al., 1995; CitationWalker et al., 2001, CitationHobbie et al., 2002). Our total live phytomass quantities and those from the 1998 growing season at Ivotuk (CitationWalker et al., 2003a) were more consistent with a study comparing MAT and MNT at their transition zone in the Kuparuk River basin, where no significant difference in above-ground plant biomass was found (CitationWalker et al., 1998).
The high temporal variability in the phytomass patterns probably resulted from a combination of the sampling method and the high level of spatial heterogeneity in tundra vegetation found even within vegetation types. The high spatial variability found at Ivotuk is demonstrated by the relatively high coefficients of variation observed for mean mid season phytomass values within each vegetation type (). Using destructive sampling to estimate phytomass obviously does not allow for repetition of measurements at the exact same point throughout the growing season; rather samples are collected nearby previous sample locations. Therefore in landscapes with high spatial variability at scales of a few meters, such as those at Ivotuk, when temporal patterns are examined at slightly different locations throughout the course of the sampling, the spatial variability is incorporated into the temporal patterns. By increasing the replicates of phytomass harvests we could have reduced some of the effects of spatial variability that were included in the seasonal patterns, and consequently we might have observed a more predictable pattern similar to that of NDVI.
Above-ground net primary production (ANPP) was also different among vegetation types and significantly influenced by plant community structure. The higher abundance of shrubs in the MAT and shrub tundra (ST), compared to MNT and mossy tussock tundra, led to higher levels of ANPP (MAT = 479 g m−2 yr−1, ST = 459 g m−2 yr−1). In the MNT and mossy tussock tundra, shrub phytomass made up less than 20% of the total live phytomass, consequently lower estimates of ANPP were observed in the MNT (357 g m−2 yr−1) and mossy tundra (140 g m−2 yr−1). However, the absence of substantial shrub productivity found in the MNT and mossy tussock tundra was partially offset in the MNT by high productivity of mosses.
The results from this study show that seasonal patterns of tundra vegetation properties can vary substantially among vegetation types that occur in close proximity. Investigation of how these vegetation properties vary temporally identified key components of tundra ecosystems, in this case deciduous shrubs, mosses, and graminoids, whose relative abundances across tundra types yield differences in NDVI, LAI, phytomass, and ANPP patterns. This work contributes to the body of research that has revealed the significant level of heterogeneity in tundra vegetation occurring at the landscape scale and supports the importance of considering these distinctions when modeling or examining tundra vegetation at coarser scales. Finally, the permanent grids established at Ivotuk allow for temporal replication of this study. Therefore, these data provide a critical baseline against which future studies may be compared.
FIGURE 1. Vegetation maps of the shrub tundra (ST), moist nonacidic tundra (MNT) and mossy tussock tundra (MT) 100 × 100 m grids. A vegetation map of the moist acidic tundra (MAT) grid was not developed because the corners of the grid could not be adequately georeferenced from the aerial photographs of the site
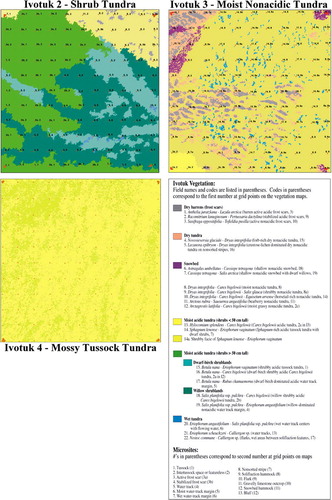
FIGURE 2. (a) Seasonal patterns of NDVI across the 1999 growing season at Ivotuk, Alaska. Curves represent four distinct vegetation types. Error bars represent the standard error of the mean (n = 20); (b) Seasonal patterns of LAI across the 1999 growing season at Ivotuk, Alaska. Curves represent four distinct vegetation types. Error bars represent the standard error of the mean (n = 20); (c) Seasonal patterns of total live above-ground phytomass across the 1999 growing season at Ivotuk, Alaska. Curves represent four distinct vegetation types. Error bars represent the standard error of the mean (n = 10 or n = 20*)
FIGURE 3. (a) Peak quantities of total live above-ground phytomass for the 1999 growing season for four vegetation types found at Ivotuk, Alaska. Distinct hatching represents specific components of above-ground phytomass. (b) The percent of peak live above-ground phytomass comprised by each component plant type for four vegetation types at Ivotuk, Alaska. Distinct hatching represents specific components of above-ground phytomass
TABLE I Soil and topography data for four distinct tundra vegetation types at Ivotuk, Alaska
TABLE 2 Summary of live aboveground phytomass and standing dead quantities for the 1999 growing season for four vegetation types at Ivotuk, Alaska
TABLE 2 (Cont.)
TABLE 3 Estimates of above-ground net primary productivity for four vegetation types at Ivotuk, Alaska
TABLE 4 Spatial coefficients of variation (CV) of mean above-ground live phytomass and standing dead. CVs calculated for mid growing season (15 July–26 July) measurements for four vegetation types at Ivotuk, Alaska
Acknowledgments
This project was funded by the NSF Arctic System Sciences, Land-Atmosphere-Ice Interactions Program in a grant to Donald A. Walker (OPP-9908829) as part of the Arctic Transitions in the Land-Atmosphere System (ATLAS) effort. We thank Meg Miller and Elaine Smid for lab assistance at the University of Virginia.
Related Research Data
References Cited
- Arft, A. M. , M. D. Walker , J. Gurevitch , J. M. Alatalo , M. S. Bret-Harte , M. Dale , M. Diemer , F. Guferli , G. H R. Henery , M. H. Jones , R. D. Hollister , I. S. Jonsdottir , K. Laine , E. Levesque , G. M. Marion , U. Molau , P. Molgaard , U. Nordenhall , V. Raszhivin , C. H. Robinson , G. Starr , A. Stenstrom , M. Stenstrom , O. Totland , P. L. Tuner , L. J. Walker , P. J. Webber , J. M. Welker , and P. A. Wookey . 1999. Responses of tundra plants to experimental warming: a meta analysis of the International Tundra Experiment. Ecological Monographs 69:491–511.
- Bockheim, J. G. , D. A. Walker , L. R. Everett , F. E. Nelson , and N. I. Shiklomanov . 1998. Soils and cryoturbation in moist nonacidic and acidic tundra in the Kurparuk River Basin, Arctic Alaska, USA. Arctic and Alpine Research 30:166–174.
- Chapin III, F. S. , J. D. McKendrick , and D. A. Johnson . 1986. Seasonal changes in carbon fractions in Alaskan tundra plants of differing growth form: implications for herbivores. Journal of Ecology 74:707–731.
- Chapin III, F. S. , G. R. Shaver , A. E. Giblin , K. J. Nadelhoffer , and J. A. Laundre . 1995. Responses of arctic tundra to experimental and observed changes in climate. Ecology 76:694–711.
- Epstein, H. E. , M. D. Walker , F. S. Chapin III , and A. M. Starfield . 2000. A transient nutrient-based model of Arctic plant community response to climatic warming. Ecological Applications 10:824–841.
- Epstein, H. E. , M. P. Calef , M. D. Walker , F. S. Chapin III , and A. M. Starfield . 2004. Detecting changes in arctic plant communities in response to warming over decadal time scales. Global Change Biology 10:1325–1334.
- Giblin, A. E. , K. J. Nadelhoffer , G. R. Shaver , J. A. Laundre , and A. J. McKerrow . 1991. Biogeochemical diversity along a riverside toposequence in arctic Alaska. Ecological Monographs 61:415–435.
- Gough, L. , G. R. Shaver , J. Carroll , D. L. Royer , and J. A. Laundre . 2000. Vascular plant species richness in Alaskan arctic tundra: the importance of pH. Journal of Ecology 88:54–66.
- Hobbie, S. E. and L. Gough . 2002. Foliar and soil nutrients in tundra on glacial landscapes of contrasting ages in northern Alaska. Oecologia 131:453–462.
- Hobbie, S. E. , T. A. Miley , and M. S. Weiss . 2002. Carbon and nitrogen cycling in soils from acidic and nonacidic tundra with different glacial histories in northern Alaska. Ecosystems 5:761–774.
- Hope, A. S. , J. S. Kimball , and D. A. Stow . 1993. The relationship between tussock tundra spectral reflectance properties and biomass and vegetation composition. International Journal of Remote Sensing 14:1861–1874.
- Hope, A. S. , W. L. Boynton , D. A. Stow , and D. C. Douglas . 2003. Interannual growth dynamics of vegetation in the Kuparuk River watershed, Alaska based on the Normalized Difference Vegetation Index. International Journal of Remote Sensing 24:3413–3425.
- Jia, G. J. , H. E. Epstein , and D. A. Walker . 2002. Spatial characteristics of AVHRR–NDVI along latitudinal transects in northern Alaska. Journal of Vegetation Science 13:315–326.
- Jia, G. J. , H. E. Epstein , and D. A. Walker . 2004. Controls over intra-seasonal dynamics of AVHRR NDVI for the arctic tundra in northern Alaska. International Journal of Remote Sensing 10:1547–1564.
- Myneni, R. B. , C. D. Keeling , C. J. Tucker , G. Asrar , and R. R. Nemani . 1997. Increased plant growth in the northern high latitudes from 1981–1991. Nature 386:698–702.
- Oechel, W. C. , S. J. Hastings , G. Vourlitis , M. Jenkins , G. Riechers , and N. Grulke . 1993. Recent change of Arctic tundra ecosystems from a net carbon dioxide sink to a source. Nature 361:520–523.
- Oechel, W. C. , S. Coles , N. Grulke , S. J. Hastings , B. Lawrence , T. Prudhomme , G. Riechers , B. Strain , D. Tissue , and G. Vourlitis . 1994. Transient nature of CO2 fertilization in Arctic tundra. Nature 371:500–503.
- Ping, C. L. , J. G. Bockheim , J. M. Kimble , G. J. Michaelson , and D. A. Walker . 1998. Characteristics of cryogenic soils along a latitudinal transect in arctic Alaska. Journal of Geophysical Research–Atmospheres 103:D22 28917–28928.
- Riedel, S. M. , H. E. Epstein , and D. A. Walker . 2005. Biotic controls over spectral indices of arctic tundra vegetation. International Journal of Remote Sensing, in press.
- Shaver, G. R. and F. S. Chapin III . 1991. Production: biomass relationships and element cycling in contrasting arctic vegetation types. Ecological Monographs 61:1–31.
- Shaver, G. R. , J. A. Laundre , A. E. Giblin , and K. J. Nadelhoffer . 1996. Changes in live plant biomass, primary production, and species composition along a riverside toposequence in arctic Alaska, USA. Arctic and Alpine Research 28:363–379.
- Shaver, G. R. , M. S. Bret-Harte , M. H. Jones , J. Johnstone , L. Gough , J. Laundre , and F. S. Chapin III . 2001. Species composition interacts with fertilizer to control long-term change in tundra productivity. Ecology 82:3163–3181.
- Shippert, M. M. , D. A. Walker , N. A. Auerbach , and B. E. Lewis . 1995. Biomass and leaf-area index maps derived from SPOT images for Toolik Lake and Imnavait Creek areas, Alaska. Polar Record 31:147–154.
- Stow, D. A. , A. S. Hope , and T. H. George . 1993. Reflectance characteristics of arctic tundra vegetation from airborne radiometry. International Journal of Remote Sensing 14:1239–1244.
- Walker, D. A. and K. R. Everett . 1991. Loess ecosystems of northern Alaska–regional gradient and toposequence at Prudhoe Bay. Ecological Monographs 61:437–464.
- Walker, D. A. , N. A. Auerbach , and M. M. Shippert . 1995. NDVI, biomass and landscape scale evolution of glaciated terrain in northern Alaska. Polar Record 31:169–178.
- Walker, D. A. , N. A. Auerbach , J. G. Bockheim , F. S. Chapin III , W. Eugster , J. Y. King , J. P. McFadden , G. J. Michaelson , F. E. Nelson , W. C. Oechel , C. L. Ping , W. S. Reeburg , S. Regli , N. I. Shiklomanov , and G. L. Vourlitis . 1998. Energy and trace-gas fluxes across a soil pH boundary in the Arctic. Nature 394:469–472.
- Walker, D. A. , J. G. Bockheim , F. S. Chapin III , W. Eugster , F. E. Nelson , and C. L. Ping . 2001. Calcium-rich tundra, wildlife, and the “Mammoth Steppe.”. Quaternary Science Reviews 20:149–163.
- Walker, D. A. , H. E. Epstein , G. J. Jia , A. Balsar , C. Copass , E. J. Edwards , J. Hollingsworth , J. Knudson , H. Meier , and A. Moody . 2003a. Phytomass, LAI, and NDVI in northern Alaska: relationships to summer warmth, soil pH, plant functional types, and extrapolation to the circumpolar Arctic. Journal of Geophysical Research, 108: doi:10.1029/2001JD000986.
- Walker, D. A. , G. J. Jia , H. E. Epstein , M. K. Raynolds , F. S. Chapin III , C. Copass , L. D. Hinzman , J. A. Knudson , H. A. Maier , G. J. Michaelson , F. Nelson , C. L. Ping , V. E. Romanovsky , and N. Shiklomanov . 2003b. Vegetation-soil-thaw-depth relationships along a Low-Arctic bioclimate gradient, Alaska: Synthesis of information from ATLAS studies. Permafrost and Periglacial Processes 14:103–123.
- Walker, M. D. , D. A. Walker , and N. A. Auerbach . 1994. Plant communities of a tussock tundra landscape in the Brooks Range Foothills, Alaska. Journal of Vegetation Science 5:843–866.
- Williams, M. and E. B. Rastetter . 1999. Vegetation characteristics and primary productivity along an arctic transect: implications for scaling-up. Journal of Ecology 87:885–898.