Abstract
We mapped Little Ice Age (LIA) moraines in the Brooks Range to estimate former equilibrium-line altitudes (ELAs), and combined this information with available proxy temperature estimates to infer precipitation trends because little is known about precipitation changes associated with centennial-scale climate variability in the Arctic during the late Holocene. The Brooks Range, northern Alaska (68°N), hosts hundreds of extant glaciers that exhibit geomorphic evidence for multiple fluctuations in ice extent during the past millennium. Our lichenometric age estimates for LIA moraines in the forefields of five cirque glaciers in the Sagavinerktok River valley and Oolah Valley suggest two intervals of LIA moraine formation centered around a.d. 1250 and 1650. The outermost LIA moraine was mapped on aerial photographs for 114 relatively large (1.2 ± 0.5 km) and geographically simple glaciers along a 700-km-long transect following the range crest. At their maximum extent during the LIA, these glaciers were an average of 0.2 ± 0.1 km longer than the ice margins shown on most recent U.S. Geological Survey topographic maps (1956 and 1972). The ELA was estimated using an accumulation-area-ratio method and GIS analysis. The reconstructed ELAs needed to maintain an equilibrium length for the LIA glaciers were an average of 51 ± 29 m lower than for the smaller glacier sizes of the mid 20th century. This small ELA lowering during the LIA is less than would be expected from available proxy temperature estimates from elsewhere in Alaska that indicate warm-season temperature reductions of about 1 °C. To explain this discrepancy, we suggest that precipitation decreased during the LIA. A prolonged southern displacement of the Arctic front might explain the drier conditions in the Brooks Range during the LIA.
Introduction
The Little Ice Age (LIA) is widely recognized as the most recent period of Neoglacial cooling, and it attests to the tendency of Earth's climate to change appreciably on time scales of decades to centuries. Multiple lines of historical and proxy climate evidence suggest that northern hemisphere summer temperatures were on average about 0.5 to 1.0 °C lower during the LIA than the 20th century (e.g., CitationMoberg et al., 2005), although the spatial variability of cooling was high (e.g., CitationD'Arrigo et al., 2006), and temperature changes at high latitudes seemed to have exceeded the global average (CitationOverpeck et al., 1997). Less is known about precipitation changes during the LIA, especially at high latitudes, despite the importance of moisture availability to a broad range of physical and biological processes in the Arctic (CitationMann et al., 2002a; CitationNesje and Dahl, 2003). This study provides a quantitative comparison of glacier extent between the LIA and the mid 20th century in the Brooks Range of arctic Alaska, and furthers our understanding of precipitation dynamics prior to the advent of instrumental weather data in this region.
Land-based glaciers expand and retreat in response to changes in mass balance largely controlled by climate. Such fluctuations are often cited as prima facie evidence for climate change (e.g., CitationLowell, 2000; CitationOerlemans, 2005). A climatically meaningful measure of glacier extent is the equilibrium-line altitude (ELA), which is controlled mainly by the counterbalancing influences of warm-season melting and cold-season accumulation. During years of positive annual balance, the ELA of a glacier lowers, and the glacier tends towards advancing until its size comes into equilibrium with the new climate and the mass balance is once again zero. If the ice marginal position is sustained, a moraine can form. Reconstructions of ELAs based on moraine positions provide information about climate variations in the past, including during the LIA (e.g., CitationDahl and Nesje, 1992, Citation1996).
The polythermal glaciers of the Brooks Range, Alaska (), are particularly sensitive to climate change because they are located in a relatively arid environment, where mass flux is low and mass balance is highly responsive to summer ablation (CitationCalkin et al., 1985). In this study, we estimate the ELA of glaciers for both the mid 20th century and the LIA maximum in the Brooks Range. Our ELA reconstructions coupled with previously published LIA summer temperature reconstructions for northern Alaska suggest that, during the LIA maximum, glaciers expanded under drier conditions.
![Figure 1 Northern Alaska showing extent of the Brooks Range (gray) and the three areas where moraines were mapped in the field (black boxes; [1] = Oolah Valley, [2] = Sagavinertok River valley, and [3] = Accomplishment Creek valley).](/cms/asset/7d88546a-7eb6-4330-beb6-9ed7fe098a3f/uaar_a_11957384_f0001.gif)
Setting
The Brooks Range is located between the North Slope and Yukon Basin of Alaska, and extends from the Chukchi Sea to the Alaska-Yukon border, spanning from 141° to 163°W at 68°N (). The mountains increase in elevation eastward, with summits reaching ∼2700 m a.s.l. On the basis of our analysis of topographic maps by the U.S. Geological Survey, the Brooks Range supports over 800 modern cirque and small valley glaciers (most <1 km long). In this paper, “modern” refers to the glacier positions delimited on 1:63,360-scale topographic maps, which are based on aerial photographs taken in 1970 and 1955 of the central and northeastern Brooks Range, respectively. The largest glaciers (up to 10 km long) are located in the northeastern Brooks Range, where glaciation thresholds are the highest (CitationPorter et al., 1983; CitationBalascio et al., 2005). In general, glaciers are located in north-facing cirques that were formed by more extensive glaciers that covered most of the central and eastern Brooks Range during repeated Pleistocene glaciations (CitationHamilton, 1986).
Glacier fluctuations during the Holocene are relatively well documented in the Brooks Range. Early work by CitationDetterman et al. (1958), CitationPorter and Denton (1967), and others resulted in a general framework of middle and late Holocene advances. More recent research (CitationEllis and Calkin, 1979, Citation1984; CitationCalkin and Ellis, 1980; CitationEllis et al., 1981; CitationCalkin et al., 1985) based on extensive mapping and lichenometric analysis supports the conclusions of earlier studies that the glaciers of the Brooks Range advanced several times throughout the Neoglaciation. A few historical records, including those of CitationLeffingwell (1919), have been used to constrain the age of LIA moraines in the Brooks Range (CitationEvison et al., 1996). This study expands on the detailed Holocene moraine mapping available for the central Brooks Range.
Weather stations are sparse and unevenly distributed across the Brooks Range. Most of the stations in northern Alaska are at low-elevation sites, such as in river valleys and along the coast of the Arctic Ocean. Mean annual temperatures for the Brooks Range are between −4 and −12 °C (http://prism.oregonstate.edu/state_products/ak_maps.phtml), and decrease toward the Chukchi and Beaufort Seas. Ablation-season (JJA) temperatures at McCall Glacier, among the highest glaciers in the range, averaged about 2 °C during 1957–1958 (CitationOrvig, 1961). More recent measurements show that average summer temperatures can exceed 5 °C in some years on McCall Glacier (CitationKlok et al., 2006). The glaciers of the Brooks Range receive most of their moisture from the Pacific Ocean (CitationPorter et al., 1983), although the Arctic Ocean provides moisture to some of the glaciers in the northernmost part of the range (CitationRabus and Echelmeyer, 1998; Matt Nolan, unpublished). Precipitation receipts in the Brooks Range are poorly documented. The smoothed circum-arctic representation of CitationSerreze and Hurst (2000) shows average annual precipitation over the Brooks Range of around 300 mm. The more spatially refined PRISM model for Alaska generally shows similar values, but the modeled precipitation increases with elevation in the Brooks Range, reaching around 600 mm over the crest of the range where the study glaciers are located (http://prism.oregonstate.edu/state_products/ak_maps.phtml).
Methods
Moraine Mapping
The glaciers selected for this study are located along a 700-km-long transect that follows the central divide of the Brooks Range. The sample set of 114 glaciers includes some of the largest in the range; they average 1.2 ± 0.5 km long and 0.6 ± 0.5 km2 in area (; Appendix). Together, they comprise 13% of the total “modern” glacier area in the Brooks Range, with an area-altitude distribution representative of the aggregate glaciated area (). Most glaciers are confined to the highest cirques along the range crest where their mean elevation averages 1810 ± 180 m a.s.l. From west to east, this transect includes 15 glaciers around the Arrigetch Peaks, nine around Anaktuvuk Pass, 65 in the Atigun Pass area, and 24 glaciers from the Mount Michelson area. The spatial density of this data set is 1.0 glacier per 1000 km2 in an area of 115,000 km2. This sample population is biased toward the larger glaciers located close to the range crest. It might underestimate the broader population of glaciers that includes numerous smaller (<0.5 km), isolated glaciers far to the north and south of the range crest, and glaciers located in compound cirques with complex accumulation areas. We also avoided glaciers with extensive debris cover.
Figure 2 Area-altitude distribution of glaciers in the Brooks Range based on U.S. Geological Survey topographic maps (1970 and 1950 for the central and eastern Brooks Range, respectively). Black line is aggregate of all glaciers; gray line represents the 114 glaciers used in this study. Elevation bin size is 30 m.
Table 1 Summary statistics (mean ± 1σ) for physical parameters and estimated equilibrium-line altitudes (ELAs) for Brooks Range glaciers.
The maximum extent reached by these 114 glaciers during the LIA was mapped on the basis of glacial morphological evidence interpreted from 1:70,000-scale aerial photographs taken in 1955 (eastern Brooks Range) and 1970 (central Brooks Range) (CitationSikorski, 2004). In general, all LIA moraines lack vegetation cover, have well-defined moraine crests, and are a short distance down valley (≤1.5 km) from “modern” glaciers (). Seven glaciers within three valleys in the central Brooks Range were chosen to field-check our aerial photograph interpretation. From west to east these are located in the Oolah Valley, Sagavinertok River valley, and Accomplishment Creek valley; all are northward flowing (). They are distributed along a 90-km-long segment of the continental divide and are located in six predominately north-facing cirques (aspect = 330 to 15°) between 1800 and 2300 m a.s.l. The forefields of these glaciers were not studied by CitationEllis and Calkin (1984), and they have not previously been mapped in more detail than 1:250,000 (CitationHamilton, 1979, Citation1981). These glaciers were chosen because they (1) showed clear Neoglacial moraines in the aerial photographs, (2) are well distributed along the southwest-northeast–trending range crest, and (3) have clear accumulation areas that are confined to simple cirques.
Figure 3 Typical central Brooks Range glaciers and associated Little Ice Age (LIA) moraines. Glaciers are flowing toward the north. (a) Aerial photograph of two glaciers located in the headwaters of Accomplishment Creek in 1970. The inferred LIA maximum extents of these glaciers are highlighted (dashed lines). (b) Aerial view looking south toward glacier A-2. Photograph taken in July 2003. LIA moraines have well-defined moraine crests and lack vegetation.
Lichenometry
We used lichenometry to estimate the ages of moraines mapped in the field. We focused on the lichen genus Rhizocarpon because of its slow and regular growth rate, ubiquity, and ease of recognition. Its yellow-green color distinguishes the genus, but identification of individual species is difficult (CitationInnes, 1985). Therefore, our measurements might include several species (e.g., R. superficiale, R. eupetraeoides, and R. inarense—referred to here collectively as R. sensu lato). Following the procedure used by CitationCalkin and Ellis (1980) to develop the lichen growth curve for the Brooks Range, we relied on the maximum thallus diameter of the largest lichen to characterize each moraine. This approach assumes that the diameter of the single largest lichen is the best indicator of substrate age because it was the first to colonize. The diameters of the five largest lichens on each moraine were tabulated by CitationSikorski (2004). The average values of the five largest are about 10% smaller than the single largest, and the size groups are more tightly clustered, suggesting average values are a more sound chronologic index, assuming that the ages of the moraines should cluster in discrete groups. To measure lichen, we walked along the entire length of each moraine crest and measured the diameter of the longest axis of large lichen to the nearest millimeter using a digital caliper. Only lichens that were slightly elliptical to circular with discrete thalli were included. For moraine ridges longer than about 50 m, we established several stations and recorded lichen sizes within a 10 m radius of each station.
The original lichen growth curve for the central Brooks Range (CitationCalkin and Ellis, 1980) was recently updated by CitationSolomina and Calkin (2003). Their R. geographicum s.l. growth curve is constrained by 12 lichen diameters ranging from 2 to 50 mm from surfaces between 20 and 1260 L yr (where “L yr” is lichenometric age relative to a.d. 1950) (). We fit a least-squares second-order polynomial to the published lichen-growth calibration data (CitationSolomina and Calkin, 2003) and specified a y-intercept of 30 yr to incorporate the estimated colonization time for R. geographicum s.l. (CitationCalkin and Ellis, 1980). The age equation is:
1 where x is the lichen diameter in mm, and y is age in L yr. In addition to incorporating colonization time, this equation yields younger and possibly more realistic ages for lichens older than about 2000 L yr compared to the logarithmic model proposed by CitationSolomina and Calkin (2003). We used this equation to estimate ages for Neoglacial moraines with lichens up to 150 mm in diameter.
Figure 4 Lichen growth curve for the central Brooks Range used to date moraines in this study. Data of CitationSolomina and Calkin (2003) were fit to a least-squares second-order polynomial (curved line). The growth curve preferred by CitationSolomina and Calkin (2003) uses a logarithmic fit (dashed line), which yields older extrapolated ages for lichens beyond 2000 L yr.
The ages of lichens larger than 50 mm are uncertain because they fall beyond the range of the calibration points and are therefore dependent on the choice of curve-fit model used to extrapolate lichen ages. We consider the ±20% error in lichen ages used by CitationCalkin and Ellis (1980) to be a reasonable estimate. This error incorporates the uncertainty associated with locating the single largest lichen on a moraine, the influence of moraine lithology and variable stabilization times on lichen size, and microclimate variations that control lichen growth. This level of certainty is sufficient for the purposes of this study.
Ela Reconstructions
The ELA of a glacier typically undergoes significant variation from year to year in response to variable weather patterns. These annual variations rarely leave lasting geomorphic evidence. In contrast, reconstructing the ELAs of paleoglaciers relies on geomorphic evidence for relatively stable ice-marginal positions. It is assumed that they represent “steady-state” conditions during which a glacier maintains a particular geometry long enough to build a significant moraine (e.g., CitationSeltzer, 1994). During this interval of relative stability, the typical annual net mass balance is zero, and the glacier geometry is in equilibrium with the climate.
A variety of methods have been used to reconstruct steady-state ELAs of paleoglaciers (recently reviewed by CitationBenn et al., 2005). We used the accumulation area ratio (AAR) method, which has been shown to produce consistent results, especially for glaciers with simple geometries like those in this study. This method is based on glacier extent depicted on maps or reconstructed from ice-marginal geomorphic features, and it assumes a fixed ratio between the accumulation and ablation area of a glacier. AAR values for alpine glaciers with long-term mass-balance measures typically range from 0.55 to 0.65 globally (CitationDyurgerov, 2002). For the reconstructed LIA glaciers, we assumed an AAR of 0.58, which is the average value for the interpolated steady-state mass balance of alpine glaciers in CitationDyurgerov's (2002) global data set (Dyurgerov, personal communication to W. F. Manley). The actual value depends on a variety of factors, but because we are primarily concerned with the difference between ELAs inferred for the “modern” and the LIA maximum ice extents (ΔELA), our analysis is largely insensitive to the choice of AAR value. In this sense, ELA serves as an index of glacier extent, similar to the glacier median altitude. ΔELA does, however, depend on whether the AAR was the same for both the “modern” and LIA glaciers. Glaciers shown on U.S. Geological Survey topographic maps were in various states of retreat from their LIA maxima. Their geometry reflects cumulative mass balance during the few decades (estimated response time) prior to 1955 and 1970, and the AAR of a retreating glacier is less than for its steady state, LIA counterpart. For “modern” glaciers, we used an AAR of 0.48, which is based on data from McCall Glacier, the only glacier monitored regularly for mass balance in northern Alaska. The mass balance of the glacier was measured annually between 1969 and 1972, and the long-term average balance was calculated using surface-elevation surveys for the interval between 1958 and 1971 (CitationRabus and Echelmeyer, 1998). These results converge on an AAR of about 0.48 for the interval prior to the rapid retreat of recent decades.
ELAs were determined using geographic information system (GIS) techniques. Briefly, “modern” and reconstructed LIA maximum extents were delimited on 1:63,360-scale maps, then digitized in GIS. Elevations were assigned to the glacier outlines based on the digital elevation models (DEM) with a grid resolution of 60 m (USGS National Elevation Dataset). The hypsometry of the glacier surface was assessed at 3-m-elevation increments. U.S. Geological Survey standards for the DEMs used in this analysis have root mean squared errors of 10–15 m, one half of the contour interval (CitationU.S. Geological Survey, 1998).
Results and Comparison With Other Studies
Reconstruction of Lia Glaciers and Lichenometic Ages
Lichenometric ages were estimated at 24 lichen stations or transects, most on individual moraines in the forefields of the five glaciers that we studied in the Sagavinertok River valley and Oolah Valley (). We excluded the results from the forefields of the two glaciers studied in the Accomplishment Creek valley because the shale-dominated, unstable moraine crests in this valley had few boulders with lichens. Maximum lichen diameters range broadly from 10 to 106 mm and systematic patterns are difficult to infer from our small data set. Overall, lichen sizes generally increase with distance from the ice margin. Reversals in down-valley trends tend to be located at stations near the up-valley extent of lateral moraines, where slope stability or lichen die-off under perennial snow might be a factor. In general, the distribution of lichen sizes shows a break between about 35 and 50 mm, with only one (up-valley) station with maximum lichen sizes within this gap. This gap corresponds to ages of about 1300 to 700 L yr (a.d. 650 to 1250). Moraines with lichens larger than about 50 mm predate the LIA. They tend to have noticeably more subdued ridges, stable frontal slopes, some sod cover, and lichen-encrusted boulders, all of which can be recognized on aerial photographs. We used this break in weathering and lichen characteristics to delimit the LIA maximum advance in glacier forefields that were not studied on the ground.
Figure 5 Maps of Holocene moraines and outwash fronting five of the seven glaciers studied in the central Brooks Range. Numbers in parentheses are the single largest lichen (mm) measured on the moraine followed by its lichenometric age estimate (L yr). The transition between debris-covered glacier and rock glacier is gradational, and all debris-covered ice was mapped as a single unit. The down-slope increase in debris cover may mark the transition. Locations of glaciers as follows: O1: 68.110°N, 150.474°W; O2: 68.033°N, 150.401°W; O5: 68.036°N, 150.172°W; S5: 68.266°N, 148.451°W; S8: 68.315°N, 148.337°W.
Older Neoglacial moraines that predate the LIA are present at most glaciers in the Brooks Range, where they record advances that extended several hundred meters beyond the LIA margin. At the five glaciers where lichenometry could be used, lichen diameters typically range between 50 and 70 mm on these moraine ridges, indicating ages of around 1800 ± 500 L yr. These ages are consistent with ages of other Neoglacial moraines from elsewhere in the central Brooks Range reported by CitationEllis and Calkin (1984). Lichen diameters of >100 mm on one moraine located 0.3 km beyond the LIA margin at glacier O-2 indicate a much older Neoglacial advance during the mid-Holocene, as has been discussed previously for elsewhere in the Brooks Range (e.g., CitationCalkin and Ellis, 1980).
The outermost LIA moraines at the five glacier forefields studied in the field have maximum lichen diameters that range between 17 and 35 mm (). Four of the five fall within the narrow range of 21 ± 4 mm, which equates to an average age of 320 ± 80 L yr (a.d. 1550 to 1710), and the fifth is about twice as old (700 L yr = a.d. 1250). Although our sample size is small, the frequency distribution of lichen ages at all stations indicates two phases of moraine stabilization during the last millennium (). The earlier period of moraine stabilization occurred around 700 L yr (a.d. 1250), and the more recent around 300 L yr (a.d. 1650), as evidenced by modes in the frequency distribution. Although the data are sparse, they agree with the results of the more extensive study of CitationEllis and Calkin (1984) who concluded that the LIA maximum in the Brooks Range was reached between a.d. 1250 and 1650. These correspond with the Maunder and Wolf minima in solar irradiance, providing further evidence that glaciers fluctuations on centennial time scales are associated with solar variability in Alaska (CitationWiles et al., 2004) and elsewhere (e.g., CitationLuckman and Wilson, 2005; CitationPolissar et al., 2006).
Figure 6 Frequency histogram showing the lichenometric age distribution of moraines in the Sagavanirktok River valley and Oolah Valley. The most recent periods of moraine stabilization occurred around 700 and 300 L yr (a.d. 1250 and 1650).
Little Ice Age Elas
The maximum extent of glaciers during the LIA seems to have been reached at different times at different glaciers, but the lichenometric results lend confidence to our ability to distinguish between LIA maximum and older Neoglacial moraines based on the interpretation of similar features on aerial photographs from other valleys. On average, during the LIA maximum, the 114 glaciers that we mapped on aerial photographs lengthened by 0.2 ± 0.1 km and gained 0.14 ± 0.03 km2 compared to their “modern” positions (; Appendix). On the basis of these paleoglacier reconstructions, and using an AAR of 0.58, the ELAs of reconstructed LIA glaciers increase from 1450 ± 95 m in the Arrigetch Peaks, to 1710 ± 110 m near Atigun Pass, to 1980 ± 100 m near Mount Michelson (). The uncertainties are the standard deviations within each region and reflect the important influence of snow drift, shading, and other microclimate and minor debris-cover effects on the ELA (CitationLie et al., 2003). For comparison, ELAs reconstructed by CitationEllis and Calkin (1984) increase from 1340 ± 40 m in the Arrigetch Peaks to 1755 ± 70 m in Atigun Pass. Their values are based on a smaller subsample of glaciers, a higher AAR (0.67), and reconstructions of the maximum Neoglacial ice margins, which lie beyond the LIA moraines for some glaciers.
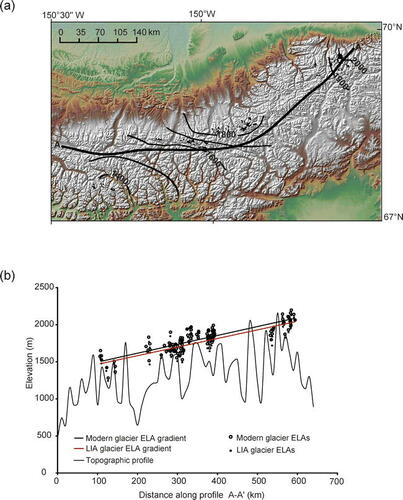
Figure 7 (a) Contoured Little Ice Age (LIA) equilibrium-line altitudes (ELAs) of 114 glaciers (black shapes). Paleo-ELAs rise from southwest to northeast across the range. Contour interval is 100 m. (b) Topographic profile from A to A′ across the crest of the Brooks Range shown in (a) with the ELAs of 114 “modern” and LIA glaciers. Lines are least-squares linear regressions. “Modern” and LIA ELAs rise eastward across the range at 1.2 m km−1 (R2 = 0.71, p > 0.01).
“Modern” Elas and Δela
On the basis of glacier extents photographed in 1955 and 1970, and using an AAR of 0.48, the average ELA of the 114 study glaciers increases from 1470 ± 100 m in the Arrigetch Peaks, to 1730 ± 110 m near Atigun Pass, to 2001 ± 95 m near Mount Michelson (Appendix; ). These values are consistent with those based on a larger data set of 940 glaciers across the Brooks Range recently mapped by CitationBalascio et al. (2005). Our first-order trend in ELA bisects the third-order trend surface calculated by CitationBalascio et al. (2005) to interpolate the “modern” ELA surface across the Brooks Range. They used an AAR of 0.58, which results in ELA estimates that are a few tens of meters lower compared to our AAR value of 0.48. Their study focused on ELA lowering during the late Wisconsin for which the position of “modern” ELA is secondary. A least-squares linear regression fit to our ELA data shows a gradient of 1.2 m km−1 (R2 = 0.71; p < 0.01) for an east-west transect along the range crest (). This ELA gradient is also consistent with the glaciation thresholds for Brooks Range glaciers shown by CitationPorter et al. (1983).
Our ELA estimates for “modern” glaciers differ from previous measurements, probably due to differences in the reference period. Between 1976 and 1979, ELAs measured on three glaciers in the central Brooks Range (CitationEllis and Calkin, 1982; CitationCalkin et al., 1985) were about 120 m higher than the average “modern” ELA of 60 glaciers near Atigun Pass calculated in this study. In 1975, a pronounced increase in summer temperature occurred in Alaska (CitationKelly et al., 1982; CitationSerreze et al., 2000). The modern glacier positions that we used were reached by 1970 as inferred from aerial photographs and U.S. Geological Survey topographic maps, prior to the abrupt warming of the mid 1970s. The glaciers instrumented for mass-balance studies between 1977 and 1981 (CitationEllis and Calkin, 1982, Citation1984) were probably readjusting to the warmer summer temperature. ELAs rose 100 m above the glaciers in the summer of 1977 and remained at the head of the glaciers during the summers of 1978 and 1979 (CitationEllis and Calkin, 1982). Thus, our estimates most likely represent an average over several years, whereas the direct measurements in the late 1970s captured the inter-annual variability.
The difference between the ELAs of “modern” and LIA glaciers (ΔELA) shows that ELAs of the 114 study glaciers were lower by an average of 51 ± 29 m during the LIA maximum (; Appendix). This value assumes an AAR of 0.58 for LIA glaciers and 0.48 for “modern” glaciers. If instead the AARs for the “modern” and LIA glaciers were equal, then the estimated ΔELA would decrease to 26 m, and this value is relatively insensitive to actual AAR, assuming only that the AAR was the same for modern and LIA. Conversely, if the AAR values differed by 0.2 (“modern” AAR = 0.38), for example, then the ΔELA would increase by 27 m (to 78 m). Our ΔELA estimate is probably a maximum value because the elevations inferred for the reconstructed LIA glaciers were based on the “modern” glacier topography. Because the surfaces of the glaciers were higher during the LIA, our ELA estimates for the LIA underestimate the true altitude, and therefore the ΔELA values are probably too large.
Linear-regression analysis () shows essentially parallel trends in ELA for both “modern” and LIA ELAs (i.e., ΔELA was uniform across the Brooks Range), suggesting generally similar climatic conditions and moisture flow paths during the LIA maximum and “modern.” This is true for both the northeastern sector of the range, which is more strongly influenced by its proximity to the Arctic Ocean, and for the central Brooks Range, where Pacific-derived storms dominate (see discussion below).
Discussion
Little Ice Age Climate Inferred from Δela Values
The average ΔELA of 51 ± 29 m for LIA maximum glaciers in the Brooks Range is considerably less than for many other high-latitude regions. For example, ΔELA estimates between 100 and 400 m have been reported for the LIA in western Norway (e.g., CitationDahl and Nesje, 1992), Baffin Island, Canada (CitationLocke and Locke, 1977), and Iceland (CitationMackintosh et al., 2002). Spatial variability in climate change might explain the range of LIA ΔELA estimates for these regions. Differences in the reference period used to calculate “modern” glacier ELAs might also help to explain the discrepancy. Regardless, the ΔELA (51 m) determined in this study is unexpectedly small relative to most previously reported estimates, and suggests either that summer temperature did not lower as much as in other regions, or that a paucity of cold-season accumulation limited the growth of LIA glaciers in the Brooks Range.
The temperature difference associated with an ELA shift of 51 m can be inferred if we assume that changes in ELA are controlled only by temperature and by applying an environmental lapse rate. Recent measurements on McCall Glacier (Matt Nolan, unpublished data; CitationKlok et al., 2006) indicate that the mean annual lapse rate on the glacier surface matches the expected free-air adiabatic lapse rate of 6 °C km−1, but that the average summer lapse rate is only 2 °C km−1; on time scales of hours to days the rate can vary widely and include negative values. CitationRabus and Echelmeyer (1998) measured a lapse rate at the glacier of around 6 °C km−1 using ice temperatures at 10 m depth as a proxy for mean annual air temperature. This gradient has remained consistent since 1972 when similar measurements were made (CitationRabus and Echelmeyer, 2002). Other evidence suggests that lapse rates in the central Brooks Range are higher: (1) summer temperatures measured between 1975 and 1978 at four Haul Road climate stations (CitationHaugen, 1979) show a lapse rate of 9 °C km−1, and (2) short-term weather data from the Grizzly Glacier show a lapse rate of 12 °C km−1 (CitationCalkin et al., 1985).
To estimate the temperature decrease associated with an average ELA lowering of 51 m during the LIA maximum, we assume that the ELA is controlled by ablation-season temperature only and apply the range of measured local environmental lapse rates in the Brook Range (2–12 °C km−1). This approach suggests a temperature reduction of between 0.1 and 0.6 °C (e.g., 2 °C km−1 × 51 m = 0.1 °C).
This range of temperature lowering is less than has been inferred based on tree-ring and other paleoclimate evidence. The proxy climate record closest to the Brooks Range is based on a white spruce (Picea glauca) tree-ring series from across northern Alaska, south of the Brooks Range (CitationJacoby et al., 1999; recently reinterpreted and expanded by CitationD'Arrigo et al., 2006). The record spans the last 300 yr and indicates that summer temperatures during the coldest two-decade interval, centered on a.d. 1690, were about 0.8 °C lower than during the reference period of a.d. 1960–1970; similar cooling took place around a.d. 1830. More pronounced cooling of between 1.3 and 2.0 °C has been inferred for the LIA in central Alaska (CitationHu et al., 2001; CitationClegg et al., 2005). Taken together, these values are consistent with the 1.0 to 1.5 °C LIA cooling estimated for elsewhere in the Arctic (e.g., CitationBradley and Jones, 1993).
Considering the widespread evidence for LIA warm-season temperature reduction of about 1 °C at northern high latitudes, we expect glaciers to have responded commensurately. If temperature was the only variable controlling mass balance, and assuming an environmental lapse rate of 6 °C km−1, then a 1 °C temperature reduction implies a ΔELA of about 170 m (i.e., 6 °C−1 km × 1 °C), or about three times more than determined in this study. To reconcile this discrepancy, and assuming that our ΔELA values are robust, then some other variable must have inhibited the expansion of LIA glaciers in the Brooks Range. A decrease in cold-season precipitation is one explanation, although we cannot rule out the possibility that factors related to radiation, including cloud cover, also influenced the mass balance.
The various combinations of accumulation-season precipitation and ablation-season temperature at the ELA of glaciers have been investigated using several approaches. These include mass/energy-balance modeling (e.g., CitationOerlemans and Fortuin, 1992), and empirical relations derived from climate data at the ELA of instrumented glaciers (e.g., CitationOhmura et al., 1992), among others. As discussed by CitationSeltzer (1994), these approaches converge on the conclusion that a 1 °C change in mean ablation-season temperature is accommodated by a change in mean annual accumulation of about 300 mm at the ELA of glaciers from a range of climates. At polar latitudes, however, where precipitation receipts are low, a 1 °C temperature change is offset by a smaller change in precipitation, that is, the relation between temperature and accumulation at the ELA is exponential (CitationLeonard, 1989; CitationMiller and de Vernal, 1992; CitationLie et al., 2003; CitationBraithwaite et al., 2006). Quantifying the extent to which the high elevations of the Brooks Range were drier than present during the LIA is difficult because the relation between these variables is not well constrained for Brooks Range glaciers. Furthermore, little is known about the present-day distribution of precipitation in the range to compare with LIA estimates.
We suggest that cold-season accumulation in the Brooks Range was reduced during the LIA. In contrast, other proxy climate records from lower elevations in northern Alaska (CitationHu et al., 2001; CitationMann et al., 2002b; CitationClegg et al., 2005) indicate increased moisture during this period. Possible explanations for this difference are a seasonal bias in the proxy climate records, or the difference in the measure of precipitation being estimated (effective versus absolute moisture). The difference might also reflect the spatial heterogeneity in precipitation patterns that are expected across Beringia as atmospheric circulation patterns shifted (e.g., CitationEdwards et al., 2001).
Atmospheric Circulation During The Little Ice Age
The climate of the Brooks Range is spatially variable. The range forms a physical border between Alaska's continental climate regime to the south and arctic climate to the north. South-to-southwesterly winds bring moisture from the north Pacific inland, and are responsible for high snowfall years in the instrumental record north of the Brooks Range, where shifts in zonal flow significantly impact annual precipitation (CitationStone et al., 2002). CitationL'Heureux et al. (2004), however, inferred that anomalous southerly flow may lead to drying of the region through a rain shadow effect. Moisture availability in the Brooks Range might also be affected by changes in atmospheric circulation related to the Arctic Oscillation (AO) (CitationSerreze et al., 2000). In the negative-index mode of the AO, positive surface pressures over the Arctic Ocean drive the anti-cyclonic Beaufort Gyre. As suggested by CitationStone et al. (2002), high atmospheric pressure over northern Alaska tends to increase northerly flow that reduces precipitation along the North Slope by blocking inland flow of moisture-bearing winds from the North Pacific. Recent studies (e.g., CitationStone et al., 2002; CitationL'Heureux et al., 2004) highlight the importance of the AO on moisture distribution in the Arctic, but have found no significant correlation between the AO index and precipitation along the North Slope in northern Alaska.
The boundary between the cold surface air over the Arctic Ocean and warmer air to the south determines the position of the Arctic front, which oscillates with the seasons (CitationSerreze et al., 2001), and influences the moisture distribution in the northern Brooks Range (CitationRabus and Echelmeyer, 1998). The front is well developed in northern Alaska during summer where it coincides with the northern flank of the Brooks Range and the zone of maximum precipitation. The relation between temperature and precipitation in northern Alaska is not simple, however. CitationCurtis et al. (1998) suggested that decreased cloud cover (and thus decreased storm frequency) is often associated with warmer temperatures, which might explain why recent warming in northern Alaska has coincided with decreased annual precipitation, while annual precipitation has increased over most of the Arctic during the 20th century (CitationSerreze et al., 2000). Nonetheless, the cold air north of the Arctic front is drier than to the south, and the southward displacement of the Arctic front would therefore coincide with the advection of cooler and drier air masses southward into the Brooks Range.
Conclusion
This study provides new glacial-geologic evidence suggesting that precipitation did not increase, and most liked decreased in the Brooks Range as glaciers attained their maximum LIA positions. Our reconstructions indicate that glacier expansion during the LIA was relatively minor compared with LIA advances of other high-latitude mountains, with an ELA lowering of only about 51 ± 29 m. Previously published proxy climate records from central and northern Alaska indicate that warm-season temperatures were about 1 °C lower during the Little Ice Age, which should have lead to an ELA lowering of about 170 m, assuming that temperature change was the only control on ELA. This did not occur, and we therefore hypothesize that glacier expansion was suppressed because precipitation decreased. We suggest that a prolonged southward shift of the Arctic front over the Brooks Range could have resulted in a reduction in accumulation on the glaciers. This finding provides an alternative perspective to previous paleoclimate reconstructions elsewhere in Alaska, which indicate increased moisture during the LIA, and suggests that more research is required to resolve this apparent discrepancy.
Acknowledgments
Nicholas Balascio assisted in the field and helped with data processing. Gordon Jacoby provided temperature reconstructions from northern Alaska tree-ring data. We thank the anonymous reviewers of earlier versions for their constructive input. This study was funded by NSF grants (OPP-9977972 and OPP-9977974), and graduate student grants from Geological Society of America and Sigma Xi.
Related Research Data
References Cited
- Balascio, N. L. , D. S. Kaufman , and W. F. Manley . 2005. Equilibrium-line altitudes during the last glacial maximum across the Brooks Range, Alaska. Journal of Quaternary Science 20:821–838.
- Benn, D. I. , A. O. Lewis , H. A. Osmaston , G. O. Seltzer , S. C. Porter , and B. Mark . 2005. Reconstruction of equilibrium-line altitudes for tropical and sub-tropical glaciers. Quaternary International 138-139:8–21.
- Bradley, R. S. and P. D. Jones . 1993. ‘Little Ice Age’ summer temperature variations: their nature and relevance to recent global warming trends. The Holocene 3:367–376.
- Braithwaite, R. J. , S. C B. Raper , and K. Chutko . 2006. Accumulation at the equilibrium-line altitude of glaciers inferred from a degree-day model and tested against field observations. Annals of Glaciology 43:329–334.
- Calkin, P. E. and J. M. Ellis . 1980. A lichenometric dating curve and its application to Holocene glacier studies in the central Brooks Range, Alaska. Arctic and Alpine Research 12:245–264.
- Calkin, P. E. , J. M. Ellis , L. A. Haworth , and P. E. Burns . 1985. Cirque glacier regime and Neoglaciation, Brooks Range, Alaska. Zeitschrift fur Gletscherkunde und Glazialgeologie 21:371–378.
- Clegg, B. F. , W. Tinner , A. Henderson , C. Bigler , and F. S. Hu . 2005. Spatial manifestation of the Little Ice Age in Alaska. EOS Transactions of the American Geophysical Union 86 52:abstract PP31A-1513.
- Curtis, J. , G. Wendler , R. Stone , and E. Dutton . 1998. Precipitation decrease in the western Arctic with special emphasis on Barrow and Barter Island, Alaska. International Journal of Climatology 18:1687–1707.
- D'Arrigo, R. , R. Wilson , and G. Jacoby . 2006. On the long-term context of late 20th century warming. Journal of Geophysical Research 111:D03103, doi: 10.1029/2005JD006352.
- Dahl, S. O. and A. Nesje . 1992. Paleoclimate implications based on the equilibrium-line altitude depressions of reconstructed Younger Dryas and Holocene cirque glaciers in inner Nordfjord, western Norway. Palaeogeography, Palaeoclimatology, and Palaeoecology 94:87–97.
- Dahl, S. O. and A. Nesje . 1996. A new approach of calculating Holocene winter precipitation by combining glacier equilibrium-line altitudes and pine-tree limits; a case study from Hardangerjøkulen, central southern Norway. The Holocene 6:381–398.
- Detterman, R. L. , A. L. Bowsher , and T. Dutro . 1958. Glaciation on the Arctic Slope of the Brooks Range, northern Alaska. Arctic 11:43–61.
- Dyurgerov, M. 2002. Glacier mass balance and regime: data of measurements and analysis. Boulder University of Colorado, INSTAAR Occasional Paper no. 55.
- Edwards, M. E. , C. J. Mock , B. P. Finney , V. A. Barber , and J. Bartlein . 2001. Potential analogues for paleoclimatic variations in eastern interior Alaska during the past 14,000 yr: atmospheric-circulation controls of regional temperature and moisture responses. Quaternary Science Reviews 20:189–202.
- Ellis, J. M. and P. E. Calkin . 1979. Nature and distribution of glaciers, neoglacial moraines, and rock glaciers, east-central Brooks Range, Alaska. Arctic and Alpine Research 11:403–420.
- Ellis, J. M. and P. E. Calkin . 1982. 1977–1981: an interval of descending ELA's and cooling temperatures, central Brooks Range, Alaska. Geological Society of America Programs with Abstracts 14 7:483.
- Ellis, J. M. and P. E. Calkin . 1984. Chronology of Holocene glaciation, central Brooks Range, Alaska. Geological Society of America Bulletin 95:897–912.
- Ellis, J. M. , T. D. Hamilton , and P. E. Calkin . 1981. Holocene glaciation of the Arrigetch Peaks, Brooks Range, Alaska. Arctic 34:158–168.
- Evison, L. H. , P. E. Calkin , and J. M. Ellis . 1996. Late-Holocene glaciation and twentieth-century retreat, northeastern Brooks Range, Alaska. The Holocene 6:17–24.
- Hamilton, T. D. 1979. Surficial geologic map of Chandler Lake Quadrangle, Alaska. U.S. Geological Survey Miscellaneous Field Studies Map MF-1121, scale 1: 250,000.
- Hamilton, T. D. 1981. Surficial geologic map of Survey Pass Quadrangle, Alaska. U.S. Geological Survey Miscellaneous Field Studies Map MF-1320, scale 1: 250,000.
- Hamilton, T. D. 1986. In Hamilton, T. D. , K. M. Reed , and R. M. Thorson . Late Cenozoic glaciation of the central Brooks Range. Glaciation in Alaska—The geologic record Alaska Geological Society. 9–49.
- Haugen, R. K. 1979. Climatic investigation along the Yukon River to Prudhoe Bay Haul Road, Alaska, 1975–78. Informal etract from final Federal Highway Administration Contract Report, Environmental investigations along the Yukon River to Prudhoe Bay Haul Road, Alaska. Hanover, New Hampshire U.S. Army Corps of Engineers Cold Regions Research and Engineering Laboratory.
- Hu, F. S. , E. Ito , T. A. Brown , B. B. Curry , and D. R. Engstrom . 2001. Pronounced climatic variation in Alaska during the last two millennia. Proceedings of the National Academy of Sciences 98:10552–10556.
- Innes, J. L. 1985. Lichenometry. Progress in Physical Geography 9:187–254.
- Jacoby, G. C. , K. W. Workman , and R. D. D'Arrigo . 1999. Laki eruption of 1783, tree rings, and disaster for northwest Alaska Inuit. Quaternary Science Reviews 18:1365–1371.
- Kelly, P. M. , P. D. Jones , C. B. Sear , B. S G. Cherry , and R. K. Tavakol . 1982. Variations in surface air temperatures: Part 2. Arctic regions, 1881–1980. Monthly Weather Review 110:71–83.
- Klok, L. , M. Nolan , and M. van den Drocke . 2006. Analysis of meteorological data and the surface energy balance of McCall Glacier, Alaska. Journal of Glaciology 51:451–461.
- L'Heureux, M. L. , M. E. Mann , B. I. Cook , B. E. Gleason , and R. S. Vose . 2004. Atmospheric circulation influences on seasonal precipitation patterns in Alaska during the latter 20th century. Journal of Geophysical Research 109:D06106, doi: 10.1029/2003JD003845.
- Leffingwell, EdeK. 1919. The Canning River region, northeastern Alaska. U.S. Geological Survey Professional Paper 109.
- Leonard, E. M. 1989. Climate change in Colorado Rocky Mountains: estimates based on modern climate at late Pleistocene equilibrium lines. Arctic and Alpine Research 21:245–255.
- Lie, Ø , S. O. Dahl , and A. Nesje . 2003. Theoretical equilibrium-line altitudes and glacier buildup sensitivity in southern Norway based on meteorological data in a geographical information system. The Holocene 13:373–380.
- Locke, C. W. and W. W. Locke . 1977. Little ice age snow-cover extent and paleoglaciation thresholds: north-central Baffin Island, NWT, Canada. Arctic and Alpine Research 9:291–300.
- Lowell, T. V. 2000. As climate changes, so do glaciers. Proceedings of National Academy of Sciences 97:1351–1354.
- Luckman, B. H. and R. J H. Wilson . 2005. Summer temperatures in the Canadian Rockies during the last millennium; a revised record. Climate Dynamics 24:131–144.
- Mackintosh, A. N. , A. J. Dugmore , and A. L. Hubbard . 2002. Holocene climatic changes in Iceland: evidence for modeling glacier length fluctuations at Sólheimajökull. Quaternary International 91:39–52.
- Mann, D. H. , D. M. Peteet , R. E. Reanier , and M. L. Kunz . 2002a. Responses of an Arctic landscape to late glacial and early Holocene climatic changes: the importance of moisture. Quaternary Science Reviews 21:997–1021.
- Mann, D. H. , P. A. Heiser , and B. P. Finney . 2002b. Holocene history of the great Kobuk sand dunes, northwestern Alaska. Quaternary Science Reviews 21:709–731.
- Miller, G. H. and A. de Vernal . 1992. Will greenhouse warming lead to northern hemisphere ice-sheet growth. Nature 355:244–246.
- Moberg, A. , D. M. Sonechkin , K. Holmgren , N. M. Datsenko , and W. Karlén . 2005. Highly variable northern hemisphere temperatures reconstructed from low- and high-resolution proxy data. Nature 433:613–617.
- Nesje, A. and S. O. Dahl . 2003. The ‘Little Ice Age’—Only temperature. The Holocene 13:139–145.
- Oerlemans, J. 2005. Extracting a climate signal from 169 glacier records. Sciencexpress: doi: 10.1126/science.1107046.
- Oerlemans, J. and J. P F. Fortuin . 1992. Sensitivity of glaciers and small ice caps to greenhouse warming. Science 258 5079:115–117.
- Ohmura, A. , P. Kasser , and M. Funk . 1992. Climate at the equilibrium line of glaciers. Journal of Glaciology 6:391–398.
- Orvig, S. 1961. McCall Glacier, Alaska: meteorological observations 1957–1958. Arctic Institute of North America Paper 8.
- Overpeck, J. , K. Hughen , D. Hardy , R. Bradley , R. Case , M. Douglas , B. Finney , K. Gajewski , G. Jacoby , A. Jennings , S. Lamoureux , G. Lasca , G. MacDonals , J. Moore , M. Retelle , S. Smith , A. Wolfe , and G. Zielinski . 1997. Arctic environmental changes of the last four centuries. Science 278:1251–1256.
- Polissar, P. J. , M. B. Abbottt , A. P. Wolfe , M. Bezada , V. Rull , and R. S. Bradley . 2006. Solar modulation of Little Ice Age climate in the tropical Andes. Proceedings of the National Academy of Sciences 103:8937–8942.
- Porter, S. C. and G. H. Denton . 1967. Chronology of Neoglaciation in the North American Cordillera. American Journal of Science 265:177–210.
- Porter, S. C. , K. L. Pierce , and T. D. Hamilton . 1983. In Porter, S. C. Late Wisconsin mountain glaciation in the western United States. Late Quaternary Environments of the United States. Minneapolis, Minnesota University of Minnesota Press. 71–111.
- Rabus, B. T. and K. A. Echelmeyer . 1998. The mass balance of McCall Glacier, Brooks Range, Alaska, U.S.A.; its regional relevance and implications for climate change in the Arctic. Journal of Glaciology 44:333–351.
- Rabus, B. T. and K. A. Echelmeyer . 2002. Increase of 10 m ice temperature: climate warming or glacier thinning. Journal of Glaciology 48:279–286.
- Seltzer, G. O. 1994. Climatic interpretation of alpine snowline variations on millennial time scales. Quaternary Research 41:154–159.
- Serreze, M. C. and C. M. Hurst . 2000. Representation of mean arctic precipitation from NCEP-NCAR and ERA reanalyses. Journal of Climate 13:182–201.
- Serreze, M. C. , J. E. Walsh , F. S. Chapin , T. Osterkamp , M. Dyurgerov , V. Romanovsky , W. C. Oechel , J. Morison , T. Zhang , and R. Barry . 2000. Observational evidence of recent change in the northern high-latitude environment. Climate Change 46:159–207.
- Serreze, M. C. , A. H. Lynch , and M. P. Clark . 2001. The arctic frontal zone as seen in the NCEP-NCAR reanalysis. Journal of Climate 14:1550–1567.
- Sikorski, J. 2004. Winter accumulation at the equilibrium line of Little Ice Age glaciers. Flagstaff Northern Arizona University. 118. M.S. thesis.
- Solomina, O. and P. E. Calkin . 2003. Lichenometry as applied to moraines in Alaska, U.S.A., and Kamchatka, Russia. Arctic, Antarctic, and Alpine Research 35:129–143.
- Stone, R. S. , E. G. Dutton , J. M. Harris , and D. Longenecker . 2002. Earlier spring snowmelt in northern Alaska as an indicator of climate change. Journal of Geophysical Research 107. doi: 10.1029/2000JD000286.
- U.S. Geological Survey 1998. Standards for digital line graphs. National Mapping Program Technical Instructions. version 07/98.
- Wiles, G. C. , R. D. D'Arrigo , R. Villalba , P. E. Calkin , and D. J. Barclay . 2004. Century-scale solar variability and Alaskan temperature change over the past millennium. Geophysical Research Letters 31:L15203, doi: 10.1029/2004GL020050.
APPENDIX
APPENDIX Coordinates, physical parameters, and equilibrium-line altitudes (ELAs) for both extant and LIA glaciers in the Brooks Range, Alaska. Listed from west to east.