Abstract
Variability in the vascular plant species composition of four stages of primary succession was investigated on 39 glacier forelands in the Jotunheim and Jostedalsbreen regions of south-central Norway. The relative frequencies of species were recorded in the pioneer zone adjacent to the glacier snout, in vegetation on terrain ages of c. 70 years and c. 250 years, and in mature vegetation outside the foreland (approximately 10,000 years since deglaciation). Sørensen dissimilarity, non-metric multidimensional scaling, and cluster analysis were used to compare the relative variability in species composition of these four stages and to identify patterns of succession within four altitudinal belts. Indicator species analysis identified characteristic species within each stage. Variation partitioning was used to quantify the relative influence of altitude and continentality on species composition.
Variability increased between pioneer and later successional stages at all but the highest altitudes, which showed no significant difference in variability between stages. The results suggest that up to an altitude of around 1600 m succession on glacier forelands follows a divergent trajectory: above this altitude little successional change occurs. Rate of successional change also varies with altitude: below about 1000 m, in the sub-alpine belt, the transition from pioneer vegetation to birch woodland occurs within 70 years; above about 1600 m in the high-alpine belt, herbaceous pioneer vegetation can persist indefinitely; at intermediate altitudes, the dwarf-shrub and snowbed vegetation types of the low- and mid-alpine belts develop within c. 250 years. The explanatory power of altitude and continentality on compositional variation and the relative importance of altitude increased with successional stage.
Introduction
The most important characteristic of primary succession in defining the trajectory and rate of change between pioneer and mature stages is variability in species composition (CitationGlenn-Lewin et al., 1992; CitationMatthews, 1992; CitationWalker and del Moral, 2003). This paper measures for the first time, within and between a large sample of glacier forelands, the relative variability of four successional stages. The main aim is to investigate whether successional trajectories and rates on these glacier forelands exhibit an interpretable pattern. A broad-scale, regional approach is used to address this aim. The main factors investigated are the altitudinal and continentality (oceanic-continental) gradients in relation to relative within-stage dissimilarity.
The approach taken in this paper is consistent with a geoecological model of succession, which assumes that the establishment of vegetation on recently deglaciated terrain is a component of the developing landscape (CitationTroll, 1971, Citation1972; CitationMatthews, 1992; CitationLöffler, 2003). In other words, biotic and abiotic factors are both expected to change along a successional trajectory. It was not possible, within the constraints of the project, to collect local-scale environmental data. However, an attempt was made to minimize local environmental variation as far as possible.
SUCCESSIONAL TRAJECTORIES
Successional trajectories are commonly defined in terms of changes in the relative variability of vegetation over time (CitationGlenn-Lewin et al., 1992; CitationMatthews, 1992; CitationWalker and del Moral, 2003). Relative variability may be defined as a measure of the extent to which similarities in vegetation composition between sites within the same successional stage increase or decrease as succession proceeds. Convergence of the vegetation to a common structure would therefore entail a decrease in relative variability over time. Whether vegetation converges towards a common structure determined by environmental factors remains an important question in community ecology (CitationFukami et al., 2005). Successional convergence, in which vegetation becomes more homogeneous with time, has been attributed to factors which limit the pool of initial colonizers (e.g. CitationRydin and Borgegard, 1988), decreasing microsite heterogeneity (e.g. CitationMori et al., 2008), abiotic stress (e.g. CitationHatton and West, 1987), or competitive dominance of later colonizers (e.g. CitationSuter et al., 2007; CitationDolezal et al., 2008). Divergent trajectories, in which vegetation becomes increasingly variable as succession proceeds, have been attributed to stochastic processes affecting initial colonizers (e.g. CitationDrake, 1990), priority effects (e.g. CitationInouye and Tilman, 1995), environmental heterogeneity (e.g. CitationMatthews and Whittaker, 1987; Citationdel Moral et al., 2010), and differences in initial conditions (e.g. Citationdel Moral, 2007). Lack of species dominance and vegetative proliferation have also been identified as an explanation of the relative variability of mature vegetation in alpine tundra (CitationBurrows, 1990). Evidence from a grassland experiment has found that apparent trajectories may be partly dependent on the scale of observation, with species composition diverging and species traits converging (CitationFukami et al., 2005).
Studies on glacier forelands have shown that divergent pathways appear to be associated with relatively severe environments and convergence with relatively strong biotic controls (CitationMatthews, 1992). For example, divergent pathways were identified on Storbreen glacier foreland, southern Norway, (CitationMatthews, 1979a, Citation1992, Citation1999) with multiple mature communities developing despite similar initial conditions, a pattern attributed to recurrent disturbance and abiotic stress. CitationJones and del Moral (2005) also found a relatively homogeneous pioneer stage on the foreland of Coleman Glacier, Washington, compared to the mature vegetation, suggesting successional divergence. However, there is evidence of convergent patterns on some glacier forelands (e.g. CitationFægri, 1933; CitationArcher, 1973; CitationBirks, 1980; CitationWardle, 1980; CitationVetaas, 1994).
THE EFFECTS OF ALTITUDE ON SUCCESSION
Documented effects of altitudinal factors on vegetation succession include a decrease in species diversity with elevation (CitationAustrheim, 2002; CitationBruun et al., 2006) and decreasing variability of vegetation with elevation (CitationDlugosch and del Moral, 1999; Citationdel Moral and Ellis, 2004). These patterns are attributed to severe abiotic stress leading to less successful colonizations at higher elevations. The interrelationship between the influences of regional, altitudinal and local topographic gradients on alpine vegetation in Norway have been extensively analyzed by CitationLöffler (2003) and CitationLöffler and Finch (2005). CitationMatthews (1992) summarized the results of individual studies on glacier forelands as follows: in the sub-alpine zone strong biotic controls lead to convergence; in the low- to mid-alpine zone succession is slower and strongly divergent; in the high-alpine zone concepts of convergence and divergence may have little meaning due to high levels of abiotic control. Altitude also appears to influence the rate of succession on glacier forelands, which may proceed more rapidly in the sub-alpine zone than at higher altitudes. Successional trajectories have also been reported as becoming shorter with elevation on volcanic deposits (Citationdel Moral, 2007).
Materials and Methods
LOCATION AND REGIONAL ENVIRONMENTAL CONDITIONS
The study area () includes the Jotunheim and Jostedalsbreen regions of south-central Norway, which lie between latitudes of 61° and 62°N and longitudes of 6° and 9°E. In the Jotunheim region the mean annual air temperature is −3.1 °C, with a July mean of +5.7 °C and a January mean of −10.7 °C, and the mean annual precipitation is 860 mm at an altitude of 1413 m (Sognefjell meteorological station) (CitationAune, 1993; CitationForland, 1993). The Jostedalsbreen region, to the west of Jotunheimen, includes the largest ice-cap on mainland Europe. Data from the Bjørkhaug-i-Jostedalen meteorological station (324 m) indicates a mean annual air temperature of +3.7 °C, a July mean of +13.4 °C, a January mean of −4.9 °C, and a mean annual precipitation of 1380 mm (CitationAune, 1993; CitationForland, 1993). There is therefore a gradient of oceanic to continental climatic conditions as well as the rise in altitude between the most westerly and most easterly sites sampled.
Figure 1 Location of the glacier forelands sampled: inset shows southern Norway. See for key to numbered sites.
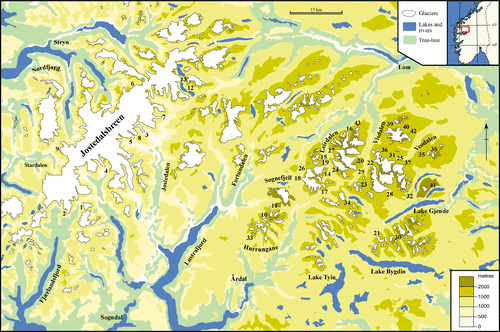
Table 1 Altitude (m a.s.l.) and distance east (km) of the glacier foreland study sites. Note that forelands 4, 35, 39, and 42 were omitted from the analyses as data were not available for all four successional stages.
The glacier forelands studied have an altitudinal range of 80 to 1860 m a.s.l. Sites sampled within the Jotunheim region lie mainly above the tree-line, which occurs at 1100–1200 m, whereas the majority of glacier forelands around Jostedalsbreen occur below the tree-line, which lies at about 850 m. The altitudinal range of typical vegetation within the study area can also be described in terms of alpine belts (e.g. CitationDahl, 1986, Citation1987; CitationMoen, 1987). The glacier forelands around Jostedalsbreen are therefore mainly within the boreal and sub-alpine birch belts, while those in Jotunheimen are predominantly within the low-alpine (1100–1450 m) and mid-alpine (1450–1800 m) belts.
DATA COLLECTION
A chronosequence approach was used to identify sites at four stages of succession on 39 glacier forelands (), the relative simplicity of ecosystems found on recently deglaciated terrain and the sampling methods used rendering site-specific conditions less of a confounding factor. The four successional stages () consisted of: (1) pioneer vegetation on the most recently deglaciated ground (up to about 20 years since deglaciation); (2) early-successional vegetation associated with the 1930 moraine (approximately 70 years since deglaciation); (3) late-successional vegetation associated with the a.d. 1750 moraine (approximately 250 years since deglaciation); and (4) mature vegetation on ground outside the foreland boundary (deglaciated for approximately 10,000 years). Direct evidence of terrain age was available for about half of the glacier forelands where moraines have been dated using a combination of methods including historical evidence and lichenometry (CitationBickerton and Matthews, 1992, Citation1993; CitationMatthews, 2005). At those forelands not dated by these methods, analogue ‘1930’ and ‘1750’ moraines were generally recognizable on geomorphological grounds.
Figure 2 (a) to (c) Vegetation associated with dated moraines on Storbreen glacier foreland, and (d) mature vegetation outside the foreland.
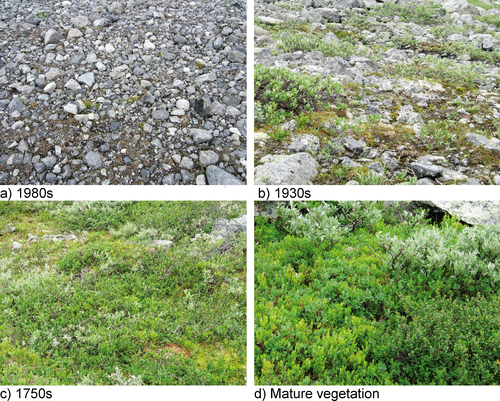
The shoot frequency of vascular plant species was recorded using transects of contiguous 2 × 0.5 m2 quadrats aligned at right angles to present and former positions of the glacier snout. The presence of each species in a quadrat was recorded until 100 species occurrences had been recorded within each stage, thus providing a measure of the relative local frequency of each species within each successional stage. This resulted in a larger number of quadrats from the sparsely vegetated pioneer stage than from the more densely vegetated mature vegetation. In other words, sample size was geared to vegetation complexity rather than surface area. Where possible, transects were located to minimize site-specific environmental variation, on ground with an even, stable surface, avoiding stream courses, areas with a high concentration of cobbles and boulders, and major topographic variations. Data collection was confined to vascular plants. Although cryptogams form an important component of the vegetation, detailed research on the Storbreen glacier foreland (CitationCrouch, 1993) has shown that the major vegetation patterns and successional trajectories can be investigated effectively based on the vascular plant species alone.
Nomenclature conforms with CitationLid and Lid (1994).
DATA ANALYSIS
All data analysis was carried out using PC-ORD Version 4.33 (CitationMcCune and Mefford, 1999b). In order to assess the relative variability of vegetation within each successional stage at different altitudes, the glacier forelands were first divided into four altitudinal groups of approximately equal numbers of sites (9–11 forelands). This resulted in the following four altitudinal “belts”: <1000 m, 1100–1480 m, 1500–1600 m, and 1620–1860 m. These groups do not correspond exactly with the commonly recognized zonation of alpine vegetation. Therefore, the pioneer and mature stages were also analyzed according to three altitudinal belts: below 1000 m (boreal and sub-alpine), 1100–1480 m (low-alpine), and 1500–1860 m (mid-alpine plus one high-alpine site).
The Sørensen similarity proportion coefficient (also known as the Bray-Curtis or Czekanowski coefficient) converted to percentage dissimilarity was used to characterize changes in the relative variability of vegetation along a chronosequence and according to altitudinal zone. This measure of dissimilarity was chosen because it retains higher sensitivity in heterogeneous data sets and gives lower weight to outliers compared to Euclidean distance (CitationMcCune and Grace, 2002). It has also performed well in comparisons with other distance measures (CitationFaith et al., 1987).
A combined ordination of sites from all four stages was carried out to provide a visual representation of the relative variability within each stage and the similarity between stages in terms of species composition. Non-metric multidimensional scaling (NMS) is a method of indirect gradient analysis in which sites are mapped in reduced ordination space according to the rank order of compositional distances between them. NMS therefore has the advantage over other ordination methods of using ranked rather than absolute distances, which improves its ability to extract information from non-linear relationships. This method also overcomes the inherent limitation of dissimilarity coefficients in expressing large distances when sites with no species in common have a fixed maximum distance. (See CitationKruskal and Wish [1978] and CitationMather [1976] for a description of the method and CitationMcCune and Grace [2002] for a description of the computational procedure.)
NMS was performed with 40 runs with real data, 50 randomized runs, a maximum of 400 iterations and an instability criterion of 10−4 (CitationMcCune and Mefford, 1999a). Randomization of the data with a Monte Carlo test allowed assessment of whether the NMS ordination axes have lower stress than expected by chance. Stress levels below approximately 20% were considered to provide a satisfactory quantitative solution (CitationClarke, 1993), with higher levels within this range providing a qualitative guide to interrelationships between sites.
Detrended correspondence analysis (DCA) (CitationHill and Gauch, 1980) was also carried out for comparison with NMS. How well the relationships between sites in the solution represent their relationships in the original dissimilarity matrix is assessed by calculating a coefficient of determination (r 2) between distances in ordination space and distances in the original data (CitationMcCune and Grace, 2002). This is used to evaluate each ordination, to help assess the optimum number of axes required, and to compare NMS ordinations with those obtained from DCA (although, as some have noted, the meaning of this type of comparison is uncertain).
The most useful NMS ordination diagram was rotated to obtain maximum correlation between axis 1 and successional stage. This enabled the position of sites on axis 1 to be used as a measure of the rate of succession in each altitudinal belt. Centroids were plotted to indicate the mean ordination values for each stage, and confidence ellipses based on two standard deviations (which tend to enclose 95% of the sites in a particular group) were plotted to provide a graphical display of relative variability. Arrows linking the centroids of each stage indicate relative movement along axis one between successional stages.
Cluster analysis (CitationWishart, 1969; CitationPost and Sheperd, 1974) provided an additional measure of relative variability, the number of vegetation units within each successional stage giving an indication of variability. Hierarchical, polythetic, agglomerative classification (cluster analysis) is a particularly useful complement to NMS ordination because, unlike other methods of classification, it can be based on any distance measure. It can therefore be performed using the same proportion coefficient so that the results are directly comparable with the NMS ordination. Ward's minimum variance method (CitationWard, 1963) and the unweighted pairs group average technique (UWPGA) (CitationWilliams et al., 1966) are the most often used but CitationKent (2006) criticizes use of the former as it is implicitly based on the squared Euclidean distance coefficient. However, the flexible beta linkage method is considered to produce similar results to Ward's method and is compatible with semi-metric distance coefficients when β = −0.25 (CitationLance and Williams, 1967; CitationMcCune and Grace, 2002)
Sites were clustered into four vegetation units, and indicator species analysis (CitationDufrêne and Legendre, 1997) was used to identify the most frequent and constant species within each unit. This was primarily for descriptive purposes rather than for identification of vegetation communities in a phytosociological sense. In addition, indicator species analysis was used to detect how far succession has proceeded towards the species composition of the mature vegetation beyond the a.d. 1750 terminal moraine, thus providing an additional measure of the rate of succession.
The relative influence of altitude and continentality on species composition were analyzed using variation partitioning. This technique clarifies the extent to which these two variables (otherwise confounded by the regional topography) covary. Variation partitioning was carried out using CCA within Canoco 4.54 software (Citationter Braak and Šmilauer, 2006). The technique is described in CitationØkland and Eilertsen (1994) and CitationLepš and Šmilauer (2003). It should be emphasized that this method is used to partition explanatory variables rather than to provide a measure of the amount of total inertia explained by these variables, as recommended by CitationØkland (1999).
Results
SØRENSEN DISSIMILARITY
shows the mean Sørensen dissimilarity for the four successional stages within each altitudinal belt. The lowest altitudinal belt (<1000 m) shows no significant change in variability between the first three stages but a significant difference between pioneer and mature stages. This indicates a divergent trajectory, but not until relatively late in the successional process. However, the broad confidence intervals for the first three stages make it difficult to detect differences, and the high within-stage variability suggested by these confidence intervals could be a result of some sites diverging more rapidly than others.
Figure 3 Mean Sørensen dissimilarity (between-site variability) and 95% confidence intervals for four successional stages on glacier forelands in four altitudinal zones.
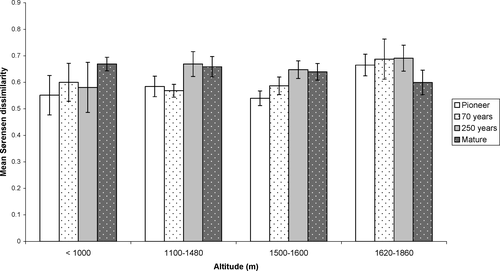
The 1100–1480 m and 1500–1600 m altitudinal zones show no significant difference in mean Sørensen dissimilarity between the pioneer and 70-year stages but a significant increase between the pioneer and the 250-year stages (followed by no further change). Divergence therefore appears to be beginning earlier and possibly ceasing earlier at these altitudes. For the highest altitudinal belt (>1600 m), there is no significant difference in variability between stages, suggesting parallel trajectories or little successional development.
The sites were also analyzed according to a closer approximation to recognized vegetation belts. In order to have a large enough sample, boreal and sub-alpine sites remain grouped together (the <1000 m group), and the one high-alpine site was analyzed with the mid-alpine forelands (forming a 1500–1860 m group). The remaining sites are situated within the low-alpine belt (1100–1480 m). Thus, the main difference in this analysis was the amalgamation of the two higher altitudinal groups. No significant difference in variability was found between any of the successional stages in the mid- to high-alpine belt: i.e. analysis according to established vegetation belts did not alter the findings.
ORDINATION
Coefficients of determination were calculated for both NMS and DCA ordinations, and the NMS ordination was considered more useful due to its higher r 2 value (NMS cumulative r 2 = 0.63 for 2 axes, 0.82 for 3 axes; DCA cumulative r 2 = 0.26 for 2 axes, 0.31 for 3 axes). A single NMS ordination of all four stages of succession on glacier forelands was used to show the relationships between stages in terms of their species composition. This ordination is plotted as four separate diagrams, each representing an altitudinal belt, in . Stress for the two-dimensional NMS ordination is 20% (p = 0.03) with an instability of 10−4 after 75 iterations. After rotation to obtain maximum correlation between axis 1 and successional stage, r = 0.79 (p < 0.01). The confidence ellipses, enclosing sites within each successional stage, clarify the degree of clustering at each stage, while the arrows represent the movement of the centroid for each stage along axis 1.
Figure 4 Non-metric multidimensional scaling of glacier foreland sites from four successional stages within each altitudinal belt: ellipses indicate ±2 standard deviations from each stage centroids; arrows connect the centroids of the four stages; stress = 20% (p = 0.03); and instability = 10−4 after 75 iterations. The ordination has been rotated to obtain maximum correlation between axis 1 and successional stage, r = 0.792 (p < 0.01).
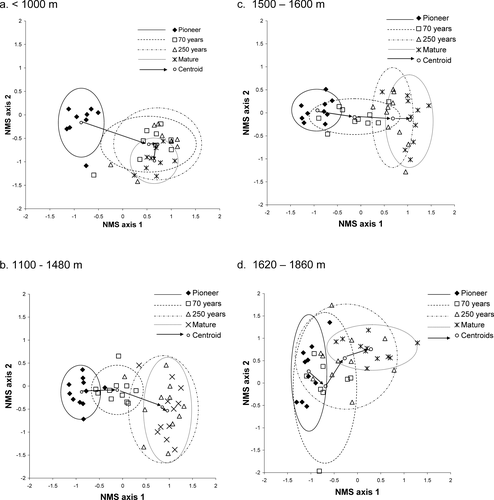
is particularly important in substantiating that, below 1000 m, the greatest successional change (movement along axis 1) occurs early in succession (between the pioneer and 70-year stages) with very little subsequent movement along this axis. The figure also appears to show evidence of early divergence followed by late convergence. This was not detectable from mean within-stage dissimilarities, perhaps due to the broad confidence intervals ().
shows that, for the 1100 to 1480 m belt, the greatest movement along axis 1 occurs between the 70- and 250-year stages. It also shows greatest divergence between these two stages. In contrast, there is little movement along axis one between the 250-year and mature stage centroids.
In the 1500 to 1600 m belt (), mean movement along axis 1 is large between the pioneer and 70-year stages and also between the 70- and 250-year stages, with the greatest variability in the 70-year stage occurring along axis 1. This suggests relatively high variability in the degree of successional development during the 70-year stage. Distance along axis 1 between the 250-year and mature stage centroids is greater than in the two lower zones, suggesting later successional development. However, in both these intermediate altitudinal belts divergence appears to occur in mid-succession.
shows a less clear pattern at the highest altitudes (1620–1860 m) with less overall movement along axis 1 between pioneer and mature stages compared with lower altitudinal zones. This indicates less successional development.
CLUSTER ANALYSIS AND INDICATOR SPECIES ANALYSIS
Cluster analysis combined with indicator species analysis allows further assessment of the species composition of sites, relative variability within each stage, and the rate of succession. The four-group level of clustering was chosen to define broad vegetation units and allow an assessment of the relationship between stages in terms of their characteristic species ( and ). All but one of the pioneer sites belong to a single vegetation unit, with Poa alpina and Oxyria digyna as the key species (hereafter referred to as the Poa-Oxyria unit) (). Other significant indicator species for this group are Deschampsia alpina, Cerastium alpinum, Trisetum spicatum, and Ranunculus glacialis. Sites in the three later stages are distributed between at least three vegetation units; the Poa-Oxyria unit; the Betula-Vaccinium unit (characterized by Betula pubescens and Vaccinium myrtillus); the Salix-Luzula unit (characterized by Salix herbacea and Luzula arcuata); and the Juncus-Hieracium unit (characterized by Juncus trifidus and Hieracium alpinum). Additional indicator species for the Juncus-Hieracium vegetation unit include characteristic shrubs of the low-alpine belt, e.g. Betula nana, Empetrum nigrum, and Vaccinium vitis-idaea ().
Table 2 The distribution of the four vegetation units (cluster analysis groups) in relation to successional stage.
Table 3 Significant indicator species and their indicator values for the four vegetation units (cluster analysis groups).
Arranging the four vegetation units along successional trajectories () reveals the pattern of development in relation to altitude. Below 1000 m, early development to birch woodland (Betula-Vaccinium) occurs within 70 years. Between 1100 and 1600 m, vegetation at the 70-year stage is predominantly characterized as either Poa-Oxyria or Salix-Luzula, while at the 250-year and mature stages the vegetation is either characterized by the Salix-Luzula or the Juncus-Hieracium units, with the latter being more common by the mature stage. At sites above 1600 m, Salix-Luzula vegetation does not develop before the 250-year stage, with pioneer vegetation persisting into the mature stage on the three highest forelands. , a schematic summary of the successional trajectories and rates, illustrates the tendency for the early-successional stage in the low-alpine belt to form a later stage in the mid-alpine belt, and for faster attainment of relatively mature vegetation at lower altitudes within an overall divergent framework.
Figure 5 Schematic summary of regional successional trajectories and rates in relation to altitude: full arrows indicate directional change; dashed arrows indicate no further directional change. Note that numerical values for altitude and time are approximate and that low- and mid-alpine trajectories in particular are affected by small-scale topographic variation and associated habitats, such as snowbed distribution and exposure. Successional stages along each trajectory approximate to the numbered vegetation units defined in this paper.
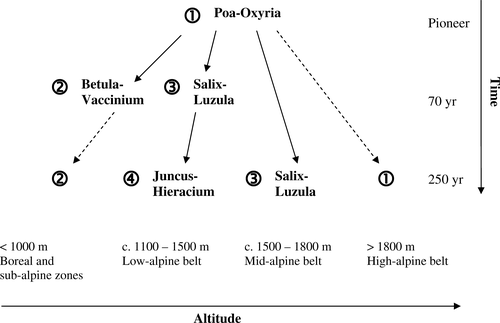
Table 4 The distribution of the four vegetation units (cluster analysis groups) in relation to altitude and successional stage: 1 = Poa-Oxyria; 2 = Betula-Vaccinium; 3 = Salix-Luzula; 4 = Juncus-Hieracium.
Variation partitioning of each of the four stages () shows that the relative contributions of altitude and continentality (distance east) to the total variation in the data set is substantial. The results confirm that the overall variation in the data increases as succession proceeds (from 2.9 in the pioneer stage to 4.1 in mature vegetation). Furthermore, the influence of altitude increased consistently from 0.09 to 0.24 between the pioneer and mature stages, whereas the influence of continentality showed little change during succession (0.12 to 0.16). The relatively high component shared between altitude and continentality (0.21–0.39) reflects the regional topography.
Table 5 The relative contributions of altitude and continentality to compositional variation at each successional stage. All values are significant at p < 0.02.
Discussion
REGIONAL VARIATION IN THE TRAJECTORY OF SUCCESSION
In the lowest altitudinal group, below 1000 m (corresponding approximately with the boreal and sub-alpine birch belt in the Jostedalsbreen area), mean Sørensen dissimilarity indicates that the mature vegetation is significantly more variable than the pioneer stage, suggesting appreciable successional divergence. A divergent pathway due to the presence of woody species, which can establish early and gain dominance, is consistent with the interpretation of successional processes at Glacier Bay, Alaska (CitationFastie, 1995). However, convergence has also been identified on sub-alpine glacier forelands (CitationFaegri, 1933), and successional convergence between 70-year-old and 250-year-old moraines on a foreland at 700 m a.s.l. (CitationVetaas, 1994) was attributed to the establishment of B. pubescens. If variability is measured in terms of the number of standard deviations from the mean, however, the pattern in could be interpreted as evidence of later convergence. The picture within this altitudinal zone is therefore somewhat ambiguous. Divergence clearly occurs within the chronosequence but evidence for the exact stage at which it occurs is not clear, and the broad confidence intervals for the Sørensen dissimilarity within the first three successional stages suggest a lack of consistency in the patterns observed at individual forelands.
In the literature there are two conflicting views regarding the effects of altitudinal influences on successional pathways. For example, CitationWalker and del Moral (2003) found that convergence is likely where there are few dispersal limitations and homogeneous initial conditions. Convergence would therefore tend to occur below the tree-line, supported by the effects of canopy development and competitive dominance by trees and shrubs. Recent research (CitationAnthelme et al., 2007) supports this view, identifying a convergent trajectory in sub-alpine vegetation due to the effect of a single dominant species. However, CitationMatthews (1979a, Citation1979b) hypothesized that divergence could occur at relatively low altitudes due to lower environmental stress, which is partially consistent with the findings of this study. It is possible that human impact on some of the low-altitude forelands could be contributing to these patterns.
In the 1100–1480 m and 1500–1600 m zones, both analytical methods (using Sørensen dissimilarity and standard deviation) show a significant increase in variability between the pioneer and the 250-year stages, which does not subsequently increase further ( and ). This provides a clear indication of divergence between these two stages in the low- and mid-alpine zones. CitationMatthews' (1979a) use of multiple discriminant analysis to assess the relationship between within-group and between-group variability on Storbreen foreland (1380 m) also found evidence of successional divergence within this altitudinal zone. The position of centroids along NMS axis 1 () suggests, moreover, slower successional development than in the sub-alpine zone.
In the highest altitudinal zone (1620–1860 m), mean within-stage Sørensen dissimilarity shows no significant change with increasing terrain age (), suggesting a parallel trajectory or little successional change. The latter is supported by less of an increase in NMS axis 1 scores between pioneer and mature stages than at lower altitudes (). Previous research has found that the effect of adverse environmental factors at high altitudes can result in vegetation failing to progress beyond the pioneer stage (CitationSvoboda and Henry, 1987). This is attributed to environmental conditions acting in opposition to the biological forces and relatively low species richness weakening interactions. Stress tolerance therefore becomes the major factor influencing survival. The concept of autosuccession (CitationMuller, 1952; CitationMatthews, 1979b), whereby additional species colonize during succession but are not replaced, may also be applicable here. If there is little or no replacement change, then species composition and Sørensen dissimilarity will show no significant change with increasing terrain age.
The general pattern suggests that divergent succession occurs on glacier forelands in all but the highest altitudinal zone where there is no clear tendency to either convergence or divergence. Within the lower three altitudinal zones, within-stage variability is fairly constant. However, pioneer-stage variability is greater in the highest altitude zone than at 1100 to 1600 m, possibly linked to the effects of disturbance associated with the freezing and thawing of the active layer above permafrost.
The overall findings are consistent with a geoecological model of primary succession (CitationMatthews, 1992), characterized by relatively homogeneous pioneer vegetation limited by the availability of ‘safe sites’ for establishment of seedlings (CitationHarper et al., 1961) in the generally harsh environment with intense disturbance adjacent to glaciers (CitationRobbins and Matthews, 2009). Subsequent divergence of vegetation occurs with increasing distance from the glacier due to topographic variation (CitationCutler et al., 2008), decreasing intensity and frequency of disturbance, and generally more favorable conditions for establishment despite greater competition. The fact that later colonizing species are more sensitive to environmental factors may mean that their narrower niche width results in increasing heterogeneity (CitationLepš and Rejmanek, 1991). At higher altitudes, there is less difference between pioneer and mature vegetation zones due to less of a change in environmental conditions with distance from the glacier and the smaller species pool. The tendency for vegetation to diverge can be due to weak biotic interactions in early succession, so that abiotic and chance effects have relatively greater influence (Citationdel Moral, 2007).
RATES OF SUCCESSION
The results of NMS ordination and cluster analysis show rapid successional development within the lowest altitudinal zone from pioneer vegetation to birch woodland, with little subsequent change. Similar, relatively rapid rates of succession at low altitudes have been identified in a variety of other habitats (CitationPrach et al., 2007).
In the 1100–1480 m and 1500–1600 m zones, examination of the distances between successional stage centroids on the NMS diagrams () confirms that the greatest differences in centroid scores along axis 1 (interpreted as successional change) occurs between the 70- and 250-year stages. Examination of the differences between vegetation units also confirms this (). The vegetation units identified suggest succession from pioneer species towards mature vegetation typical of areas of late-lying snow, with subsequent development to dwarf shrubs or grassy heaths (cf. CitationMatthews, 1978a, Citation1978b; CitationDahl, 1986, Citation1987).
Cluster and indicator species analyses of sites in the highest altitudinal zone show a relatively late development from pioneer Poa-Oxyria vegetation to Salix-Luzula vegetation (). An early study of mature arctic tundra vegetation (CitationGriggs, 1934) concluded that it most closely resembles that of the pioneer stage in temperate zones, the extreme climate with its associated physical disturbances preventing the vegetation from reaching a stable equilibrium. The “problem of Arctic vegetation” that Griggs refers to is whether the concept of succession is applicable at all, especially in the High Arctic, which is the latitudinal equivalent to the high-alpine belt. However, it is also clear that, within the low- to mid-alpine belts, vegetation on a number of glacier forelands has not reached the composition of mature vegetation within 250 years of succession.
Patterns identified in relation to successional rate and trajectory on glacier forelands point to the influence of regional factors on primary successional processes. However, while it was possible to identify consistent patterns in successional rate and trajectory in relation to altitude, the results of variation partitioning suggest that continentality is also a significant factor. The influence of fine-scale meso- and micro-environmental factors must also be important (CitationLöffler, 2003). Although data collection attempted to minimize variation in local environmental factors, these are also an important component of the geoecological model of succession and will be assessed in future work.
Conclusions
This study provides the first analysis of successional patterns at a regional scale using species data from a large number of glacier forelands at a range of altitudes. It has therefore revealed new insights that were not possible from previous site-specific studies.
On glacier forelands up to approximately 1600 m, transformation of the pioneer plant community generally follows divergent successional trajectories. This is reflected in the increase in mean dissimilarity between sites during the transition from a single pioneer community to more variable mature vegetation. This general finding suggests that the physical environmental characteristics of recently deglaciated terrain are prevalent over the biotic interactions necessary for successional convergence to occur.
Above 1600 m, successional pathways are neither convergent nor divergent. On the three highest forelands sampled, there is little change in the pioneer vegetation after 250 years, and it is arguable whether succession is occurring.
Relatively slow rates of successional change on the highest altitude forelands contrast with the rapid changes in species composition that occur within the first 70 years below 1000 m. At altitudes of 1100–1600 m the greatest change in vegetation composition tends to occur between the 70- and 250-year stages.
Assessment of the respective contributions of altitude and continentality to the variation in the data indicates the increasing influence of altitude as a regional-scale environmental factor on the vegetation as succession proceeds. It also reflects their covariance within the study area and points to the importance of micro- and meso-scale factors in determining successional patterns.
The unique combination of analytical techniques applied in this study provides a useful means of measuring and assessing relative variability in vegetation composition during succession. Sørensen dissimilarity provided a method of quantifying the relative variability within each successional stage. NMS ordination of the sites enabled visualization of relative variability in relation to altitudinal belts and successional stages. The general patterns observed were confirmed by cluster analysis of the sites which, when combined with indicator species analysis, provided an objective method of characterizing each stage in terms of key species. Finally, variation partitioning enabled quantification of the relative influence of regional environmental factors—altitude and continentality—on the successional patterns detected.
Acknowledgments
Thanks to Robert Cook, Alexander Fuller, Geraint Owen, and Paul Richards for fieldwork assistance; the University of Wales and the Jotunheimen Research Trust for financial support; and Anna Ratcliffe for producing the map. This paper is Jotunheimen Research Expeditions Contribution No. 173.
Related Research Data
References Cited
- Anthelme, F. , J. C. Villaret , and J. J. Brun . 2007. Shrub encroachment in the Alps gives rise to the convergence of sub-alpine communities on a regional scale. Journal of Vegetation Science 18:355–362.
- Archer, A. C. 1973. Plant succession in relation to a sequence of hydromorphic soils formed on glacio-fluvial sediments in the alpine zone of the Ben Ohau Range, New Zealand. New Zealand Journal of Botany 11:221–348.
- Aune, B. 1993. Temperatur normaler, normalperiode 1961–1990, Rapport 02/93. Oslo Den Norske Meteorologiske Instituut.
- Austrheim, G. 2002. Plant diversity patterns in semi-natural grasslands along an elevational gradient in southern Norway. Plant Ecology 161:193–205.
- Bickerton, R. H. and J. A. Matthews . 1992. On the accuracy of lichenometric dates: an assessment based on the ‘Little Ice Age’ moraine sequence of Nigardsbreen, southern Norway. The Holocene 2:227–237.
- Bickerton, R. H. and J. A. Matthews . 1993. ‘Little Ice Age’ variations in outlet glaciers from the Jostedalsbreen ice-cap, southern Norway: a regional lichenometric-dating study of ice-marginal moraine sequences and their climatic significance. Journal of Quaternary Science 8:45–66.
- Birks, H. J. B. 1980. The present flora and vegetation of the moraines of the Klutlan Glacier, Yukon Territory, Canada. Quaternary Research 14:60–86.
- Bruun, H. H. , J. Moen , R. Virtanen , J. A. Grytnes , L. Oksanen , and A. Angerbjorn . 2006. Effects of altitude and topography on species richness of vascular plants, bryophytes and lichens in alpine communities. Journal of Vegetation Science 17:37–46.
- Burrows, C. J. 1990. Processes of Vegetation Change. London Unwin. 551 pp.
- Clarke, K. R. 1993. Non-parametric multivariate analyses of changes in community structure. Australian Journal of Ecology 18:117–143.
- Crouch, H. J. 1993. Plant distribution patterns and primary succession on a glacier foreland: a comparative study of cryptogams and higher plants. In Miles, J. and D. W. H. Walton . (eds.). Primary Succession on Land. Oxford Blackwell. 133–145.
- Cutler, N. A. , L. R. Belyea , and A. J. Dugmore . 2008. The spatiotemporal dynamics of a primary succession. Journal of Ecology 96:231–246.
- Dahl, S. O. 1986. Zonation in arctic and alpine tundra and fellfield ecobiomes. In Polunin, N. (ed.). Ecosystem Theory and Application. Chichester John Wiley and Sons.
- Dahl, S. O. 1987. Alpine-subalpine plant communities of South Scandinavia. Phytocoenologia 15:455–484.
- del Moral, R. 2007. Limits to convergence of vegetation during early primary succession. Journal of Vegetation Science 18:479–488.
- del Moral, R. and E. E. Ellis . 2004. Gradients in compositional variation on lahars, Mount St. Helens, Washington, USA. Plant Ecology 175:273–286.
- del Moral, R. , J. M. Saura , and J. N. Emenegger . 2010. Primary succession trajectories on a barren plain, Mount St. Helens, Washington. Journal of Vegetation Science DOI: 10.1111/j.1654-1103.2010.01189.x.
- Dlugosch, K. and R. del Moral . 1999. Vegetational heterogeneity along elevational gradients. Northwest Science 73:12–18.
- Dolezal, J. , K. Homma , K. Takahashi , M. P. Vyatkina , V. Yakubov , V. P. Vetrova , and T. Hara . 2008. Primary succession following deglaciation at Koryto Glacier valley, Kamchatka. Arctic, Antarctic, and Alpine Research 40:309–322.
- Drake, J. A. 1990. The mechanics of community assembly and succession. Journal of Theoretical Biology 147:213–233.
- Dufrêne, M. and P. Legendre . 1997. Species assemblages and indicator species: the need for a flexible asymmetrical approach. Ecological Monographs 61:345–366.
- Fægri, K. 1933. Über die Längenvariationen einiger Gletscher des Jostedalsbre und die dadurch bedingten Pflanzensukzessionen. Bergens Museums Årbok 1933, Naturvidenskapelig rekke 1–255.
- Faith, D. P. , P. R. Minchin , and L. Belbin . 1987. Compositional dissimilarity as a robust measure of ecological distance. Vegetatio 69:57–68.
- Fastie, C. L. 1995. Causes and ecosystem consequences of multiple pathways of primary succession at Glacier Bay, Alaska. Ecology 76:1899–1916.
- Forland, E. J. 1993. Nedbornnormaler normalperiode 1961–90, Rapport 39/93. Oslo Den Norske Meteorologiske Institutt.
- Fukami, T. , T. M. Bezemer , S. R. Mortimer , and W. H. van der Putten . 2005. Species divergence and trait convergence in experimental plant community assembly. Ecology Letters 8:1283–1290.
- Glenn-Lewin, D. C. , R. K. Peet , and T. T. Veblen . 1992. Plant Succession: Theory and Prediction. London Chapman and Hall.
- Griggs, R. F. 1934. The problem of arctic vegetation. Journal of the Washington Academy of Sciences 24:153–175.
- Harper, J. L. , J. N. Clatworthy , I. H. McNaughton , and G. S. Sagar . 1961. The evolution of closely related species living in the same area. Evolution 15:209–227.
- Hatton, T. J. and N. E. West . 1987. Early seral trends in plant community diversity on a recontoured surface mine. Vegetatio 73:21–29.
- Hill, M. O. and H. G. Gauch . 1980. Detrended correspondence analysis: an improved ordination technique. Vegetatio 42:47–58.
- Inouye, R. S. and D. Tilman . 1995. Convergence and divergence of old-field vegetation after 11 yr of nitrogen addition. Ecology 76:1872–1887.
- Jones, C. C. and R. del Moral . 2005. Patterns of primary succession on the foreland of Coleman Glacier, Washington, USA. Plant Ecology 180:105–116.
- Kent, M. 2006. Numerical classification and ordination methods in biogeography. Progress in Physical Geography 30:399–408.
- Kruskal, J. B. and M. Wish . 1978. Multidimensional Scaling. Beverley Hills Sage Publications. 93 pp.
- Lance, G. N. and W. T. Williams . 1967. A general theory of classification sorting strategies. I. Hierarchical systems. Computer Journal 9:373–380.
- Lepš, J. and M. Rejmanek . 1991. Convergence or divergence—What should we expect from vegetation succession? Oikos 62:261–264.
- Lepš, J. and P. Šmilauer . 2003. Multivariate Analysis of Ecological Data Using CANOCO. Cambridge Cambridge University Press. 269 pp.
- Lid, J. and D. T. Lid . 1994. Norsk Flora. Oslo Det Norske Samlaget.
- Löffler, J. 2003. Micro-climatic determination of vegetation patterns along topographical, altitudinal and oceanic-continental gradients in the high mountains of Norway. Erdkunde 57:232–246.
- Löffler, J. and O-D. Finch . 2005. Spatio-temporal gradients between high mountain ecosystems in central Norway. Arctic, Antarctic, and Alpine Research 37:499–513.
- Mather, P. M. 1976. Computational Methods of Multivariate Analysis in Physical Geography. London J. Wiley. 532 pp.
- Matthews, J. A. 1978a. Plant colonisation patterns on a gletschervorfeld, southern Norway: a mesoscale geographical approach to vegetation change and phytometric dating. Boreas 7:155–178.
- Matthews, J. A. 1978b. An application of non-metric multidimensional scaling to the construction of an improved species plexus. Journal of Ecology 66:157–173.
- Matthews, J. A. 1979a. A study of the variability of some successional and climax plant assemblage-types using multiple discriminant analysis. Journal of Ecology 67:255–271.
- Matthews, J. A. 1979b. Vegetation of the Storbreen Gletschervorfeld, Jotunheimen, Norway, 2. Approaches involving ordination and general conclusions. Journal of Biogeography 6:133–167.
- Matthews, J. A. 1992. The Ecology of Recently-Deglaciated Terrain. Cambridge Cambridge University Press.
- Matthews, J. A. 1999. Disturbance regimes and ecosystem response on recently-deglaciated substrates. In Walker, L. R. (ed.). Ecosystems of Disturbed Ground. Amsterdam Elsevier. 17–37.
- Matthews, J. A. 2005. ‘Little Ice Age’ glacier variations in Jotunheimen, southern Norway: a study in regionally controlled lichenometric dating of recessional moraines with implications for climate and lichen growth rates. Holocene 15:1–19.
- Matthews, J. A. and R. J. Whittaker . 1987. Vegetation succession on the Storbreen glacier foreland, Jotunheimen, Norway—A review. Arctic and Alpine Research 19:385–395.
- McCune, B. and J. B. Grace . 2002. Analysis of Ecological Communities. Gleneden Beach, Oregon MjM Software Design.
- McCune, B. and M. J. Mefford . 1999a. PC-ORD Version 4: Multivariate Analysis of Ecological Data. User's Guide. Gleneden Beach, Oregon MjM Software.
- McCune, B. and M. J. Mefford . 1999b. PC-ORD. Multivariate Analysis of Ecological Data. Version 4.33. Gleneden Beach, Oregon MjM Software.
- Moen, A. 1987. The regional vegetation of Norway; that of central Norway in particular. Norsk Geografisk Tidsskrift 41:179–225.
- Mori, A. S. , T. Osono , M. Uchida , and H. Kanda . 2008. Changes in the structure and heterogeneity of vegetation and microsite environments with the chronosequence of primary succession on a glacier foreland in Ellesmere Island, high arctic Canada. Ecological Research 23:363–370.
- Muller, C. H. 1952. Plant succession in arctic heath and tundra in northern Scandinavia. Bulletin of the Torrey Botanical Club 79:296.
- Økland, R. H. 1999. On variation explained by ordination and constrained ordination axes. Journal of Vegetation Science 10:131–136.
- Økland, R. H. and O. Eilertsen . 1994. Canonical Correspondence Analysis with variation partitioning: some comments and an application. Journal of Vegetation Science 5:117–126.
- Post, W. M. and J. D. Sheperd . 1974. Hierarchical Agglomeration. Madison University of Wisconsin.
- Prach, K. , P. Pysek , and V. Jarosik . 2007. Climate and pH as determinants of vegetation succession in Central European man-made habitats. Journal of Vegetation Science 18:701–710.
- Robbins, J. A. and J. A. Matthews . 2009. Pioneer vegetation on glacier forelands in southern Norway: emerging communities? Journal of Vegetation Science 20:889–902.
- Rydin, H. and S. O. Borgegard . 1988. Primary succession over sixty years on hundred-year old islets in Lake Hjalmaren, Sweden. Vegetatio 77:159–168.
- Suter, M. , D. Ramseier , S. Guesewell , and J. Connolly . 2007. Convergence patterns and multiple species interactions in a designed plant mixture of five species. Oecologia 151:499–511.
- Svoboda, J. and G. H. R. Henry . 1987. Succession in marginal arctic environments. Arctic and Alpine Research 19:373–384.
- ter Braak, C. J. F. and P. Šmilauer . 2006. Canoco for Windows. Version 4.54. Wageningen Biometris—Plant Research International.
- Troll, C. 1971. Landscape ecology (geoecology) and biogeocenology—A terminological study. Geoforum 8:43–46.
- Troll, C. 1972. Geoecology and world-wide differentiation on high-mountain ecosystems. In Troll, C. (ed.). Geoecology of the High-Mountain Regions of Eurasia. Wiesbaden Franz Steiner Verlag. 1–16.
- Vetaas, O. R. 1994. Primary succession of plant assemblages on a glacier foreland—Bødalsbreen, southern Norway. Journal of Biogeography 21:297–308.
- Walker, L. R. and R. del Moral . 2003. Primary Succession and Ecosystem Rehabilitation. Cambridge Cambridge University Press.
- Ward, J. H. 1963. Hierarchical groupings to optimize an objective function. American Statistical Association Journal 58:236–244.
- Wardle, P. 1980. Primary succession in Westland National Park and its vicinity. New Zealand Journal of Botany 18:221–232.
- Williams, W. T. , J. M. Lambert , and G. N. Lance . 1966. Multivariate methods in plant ecology. V. Similarity analysis and information analysis. Journal of Ecology 54:427–445.
- Wishart, D. 1969. An algorithm or hierarchical classifications. Biometrics 25:165–170.