Abstract
The aim of this research was to determine how changes in soil moisture and temperature influence ecosystem C fluxes in the context of changing grazing regimes in subalpine grasslands in the Pyrenees. We (i) measured CO2 fluxes in the field in cattle- and sheep-grazed areas, and (ii) compared responses of CO2 and CH4 fluxes from soil turf samples from cattle- and sheep-grazed areas to changes in soil temperature and moisture. The cattle-grazed area showed greater ecosystem respiration and gross ecosystem photosynthesis than the sheep-grazed areas. With respect to the temperature and moisture treatments, the two areas responded in a similar way: Soil moisture was the strongest driver of soil respiration rates; although temperature also increased CO2 effluxes from the soils, the effects were transient. The greatest effluxes of CO2 were found in soils incubated at elevated temperature and 80% soil moisture content. Methane fluxes were only influenced by the moisture treatment, with the greatest methane oxidation rates found at 40% soil moisture content. We conclude that regional changes in moisture availability resulting from climate change are likely to be the most important driver of soil respiration and methane fluxes in these grazed subalpine ecosystems.
Introduction
Soil carbon (C) storage in alpine areas can be substantial (>25 kg m-2), and this stored C may be particularly vulnerable to climate change given the cold climate and the fact that climate change is likely to be drastic in many alpine systems (CitationGarcia-Pausas et al., 2007). Climatic warming in European mountain regions is far stronger than anywhere else (CitationIPCC, 2007; CitationBeniston, 2006; CitationAuer et al., 2007; CitationRebetez and Reinhard, 2008), and according to Nogués-Bravo et al. (Citation2007) climate warming by 2085 will range between 2.9 and 5.4 °C in low-latitude European mountains. In addition to changes in warming, there are also predictions for important changes in precipitation within mountain ranges with increased drought predicted in parts of the Pyrenees (CitationLopez-Moreno et al., 2008). Such changes have direct implications for ecosystem C storage since water deficit (CitationHolst et al., 2008) and low temperatures are well known to limit microbial activity (CitationLloyd and Taylor, 1994). It is therefore likely that the responses of the ecosystem C storage to increased levels of drought in alpine ecosystems will be driven on one hand by decreased microbial activity and hence lower rates of decomposition of soil organic matter due to moisture deficit; and on the other hand by increased microbial activity and decomposition rates due to elevated temperature (CitationLloyd and Taylor, 1994; CitationSjögersten and Wookey, 2002a).
Methane oxidation by high-affinity methanotrophic bacteria in mesic to dry soils is an important sink of atmospheric methane (CitationBodelier and Laanbroek, 2004). The main constraint of methane oxidation is soil moisture, since water-filled pores act as a diffusivity barrier (CitationSmith et al., 2000; CitationSaari et al., 2004a): Very dry soil conditions, however, may limit microbial activity (CitationBodelier and Laanbroek, 2004). In addition, elevated temperature can increase methane oxidation rates but to a lesser extent than soil moisture (CitationSaari et al., 2004a). Overall methane oxidation is a less temperature sensitive process than soil respiration (CitationSmith et al., 2000; CitationSaari et al., 2004a; CitationHolst et al., 2008). However, methane oxidation in alpine soils has been shown to be stimulated by climate warming and may provide a negative feedback on climate change (CitationSjögersten and Wookey, 2002b).
An important feature of alpine areas is that they are often grazed by large herbivores which have been shown to impact ecosystem C storage (CitationSchuman et al., 1999; CitationGanjegunte et al., 2005) and fluxes (CitationStark et al., 2002; CitationWelker et al., 2004). For example, moderate grazing tends to stimulate photosynthetic activity due to the stimulation of tillering in grazing-tolerant species (CitationLeCain et al., 2002). Grazing has also been found to increase soil respiration rates (CitationStark et al., 2002) and impact C dynamics through its effects on plant species composition through selective foraging and trampling (CitationSebastià et al., 2008a; CitationOlofsson et al., 2009). Herbivore-driven changes in species composition has been shown to alter litter quantity and quality resulting in enhanced decomposition rates (CitationBardgett et al., 1998; CitationOlofsson and Oksanen, 2002), which may influence soil C storage in alpine ecosystems (CitationGarcia-Pausas et al., 2007).
To explore the relative importance of changes in soil moisture and temperature, and interactions between climate warming and grazing regimes in mountain areas, we chose a grazed subalpine grassland in the southeastern Pyrenees as our study system. This area has been grazed over millennia and has seen a recent shift from sheep to cattle grazing which has had clear impacts on the vegetation composition (CitationSebastià et al., 2008a). Furthermore, the region is predicted to experience a 4–5 °C increase in temperature and a minimum precipitation decrease of 30% during summer under the A2 IPCC scenario predictions (CitationLopez-Moreno et al., 2008).
The aim of this paper is to test the hypothesis that across two areas under differing grazing systems (cattle and sheep grazed) C fluxes do not differ in their response to changes in temperature and moisture conditions. Hence, first we quantified net ecosystem exchange of carbon (NEE), ecosystem respiration (Re), and gross ecosystem photosynthesis (GEP) in the field, together with plant biomass and soil chemical properties in alpine grasslands. Second, we carried out incubations of soil turf samples from the cattle- and sheep-grazed areas under two temperature and three moisture levels reflecting the climate change predictions for the region and the current range of soil moisture conditions.
Methods
FIELD SITES AND SAMPLING
The field sites were in a subalpine grassland in the eastern part of the Spanish Pyrenees (42°18′N and 2°02′E), at 1900–2000 m a.s.l. The mean annual and summer temperature in the area is 6.5 and 14.6 °C, respectively, whilst the mean annual and summer precipitation is 1194.4 and 296.0 mm, respectively (CitationNinyerola et al., 2000). Traditionally, these grasslands were mainly grazed by sheep but change in livestock type has occurred in part of the study area within the last 10 years, shifting from sheep to cattle grazing. The vegetation in both cattle and sheep grazed areas was grass dominated, with Festuca nigrescens as the main species, accompanied by Agrostis capillaris, Avenula pratensis, Koeleria macrantha, and Poa pratensis. In sheep-grazed areas, vegetation was enriched by Deschampsia flexuosa, Poa bulbosa, and particularly Nardus stricta, which was the dominant species locally (CitationSebastià et al., 2008a). Other graminoids were also common, such as Carex and Luzula species. Similar legume and non-legume forb species (Lotus corniculatus, Trifolium pratense, Myosotis sylvatica, and Ranunculus montanum) were found in both cattle- and sheep-grazed plots, in different proportions, as found by Sebastià et al. (Citation2008a). For a detailed description of vegetation, plant diversity, and soil at these grassland sites, see Sebastià (Citation2004) and Sebastià and Puig (Citation2008).
To assess the impact of the dominant herbivore, i.e. cattle vs. sheep grazing, we established plots on either side of fence lines separating the cattle- from the sheep-grazed areas, resulting in a set of plots in two distinct areas hereafter referred to as cattle- and sheep-grazed areas, respectively. The plots were distributed over a 3 km × 1 km area with a minimum distance between plots of 70 m. For the study plots, we chose relatively flat areas (to avoid areas strongly affected by erosion) covered by mesic grassland communities and used plant species composition to aid with the plot selection, avoiding sites with species indicating xeric conditions, including Helianthemum nummularium and Globularia cordifolia (see CitationSebastià, 2004). The reason for this was to reduce confounding effects arising from variation in soil moisture content.
The experimental setup does not allow for a full separation of edaphic influences from changes in the dominant herbivore over the last 10 years. Hence the results should be interpreted mainly as an indication of the overall variation in C fluxes across grazed subalpine landscapes; however, it is clear that the recent shifts in dominant herbivore has impacted the species composition of the vegetation at these sites (CitationSebastià et al., 2008a).
From these sites we collected data on standing biomass, soil chemistry, and CO2 efflux on two occasions, once in June (preceding maximum biomass usually reached in July) and then again in October (onset of autumn) in 2008. In June we selected three plots from each of the two areas (i.e. six plots in total) and carried out measurements in three 0.5 × 0.5 m subplots (selected randomly) within each plot for the CO2 flux measurement and four subplots for the vegetation analysis. The data from each subplot were subsequently averaged to the plot level and the plot average was then used for all data analysis (i.e., n = 3 in each of the sheep- and cattle-grazed areas).
In October we extended the sampling scheme to nine plots in each of the cattle- and sheep-grazed areas (i.e., total number of plots were 18), the three plots sampled previously in June in each area were included in the expanded sampling scheme. This allowed us to capture a greater amount of the natural variability in biomass and C fluxes in the two areas. In addition to repeating the measurements carried out in June we collected turf samples of soil and vegetation for a laboratory incubation experiment (see below).
SOIL CHEMISTRY
Using a stainless steel corer, soil samples (5 × 5 cm) were collected from three randomly selected subplots (different from those used for the CO2 flux measurements) from each of the plots in June. The soils were separated into 0–10 cm and 10–20 cm layers in the field. In the laboratory, the fresh soil samples, both from 0–10 cm and from 10–20 cm, were separately sieved to 2 mm to remove gravel and roots. The sieved soil was oven dried at 60 °C until a constant weight was reached. Soil pH was measured using a potentiometer in a 1:2.5 soil:water ratio. Soil organic matter content (using the Walkley-Black method) was obtained from potentiometrical titration. The total C and N concentration was analyzed with a Carlo Erba elemental analyzer. The extractable potassium and magnesium were determined using an ICP-OES spectrophotometer following extraction of 5 g of soil in ammonium acetate. Phosphorous was determined by extraction of 5 g of soil in NaHCO3 and colorimetric analysis using a UV-VIS spectrophotometer.
PLANT BIOMASS ESTIMATION AND CO2 FLUX MEASUREMENTS IN THE FIELD
Aboveground plant biomass was determined by clipping the vegetation just above the soil surface from a 10 cm × 10 cm area in each of the plots. The vegetation samples were sorted into living and dead leaf material and oven-dried at 60 °C. The belowground biomass was determined in a 5 cm × 5 cm area in each plot down to 20 cm depth; roots were separated from the mineral soil, washed, and oven-dried at 60 °C. Standing litter at the end of the growing season was determined at the October sampling occasion.
Ecosystem CO2 fluxes were measured in the field on two occasions at contrasting phenological stages of the vegetation to provide background information for the laboratory incubation experiment (note that the aim was not to quantify the ecosystem C balance) and explore differences in the CO2 exchange between cattle- and sheep-grazed areas. The CO2 fluxes estimated in June are expected to reflect the period of maximum GEP, the October data illustrates CO2 fluxes at senescence and coincided temporally with the soil sampling for the incubation experiment (see below).
CO2 fluxes were measured with custom-built cuvettes (30 cm diameter, 12 L volume) clamped to steel rings inserted into the soil, and each attached to an EGM-4 Infra Red Gas Analyzer using an open dynamic system (IRGA; PP Systems, Hitchin, U.K.; see CitationSjögersten et al., 2006, for details). Measurements were carried out between 10:00 h and 18:00 h over two and three days in June and October, respectively, reflecting a range of light and temperature conditions. Both net ecosystem exchange (NEE) and ecosystem respiration (Re) were measured on each plot in the following sequence: the system was allowed to equilibrate for 5 min, NEE data was collected for 10 min, a hood was placed over the cuvette to exclude light and stop photosynthesis, the system was allowed 5 min to equilibrate, and then Re was measured for 10 min. To obtain an estimation of gross ecosystem photosynthesis (GEP), the mean plot Re fluxes were subtracted from the mean plot NEE fluxes for each measurement period. Negative CO2 flux values indicate uptake of CO2 from the atmosphere. Photosynthetically active radiation (PAR), evaporation rates, and air temperature were recorded simultaneously.
TEMPERATURE AND MOISTURE INCUBATIONS
Nine turf samples of 10 cm × 30 cm were taken to 10 cm depth from each of the sampling plots after the CO2 flux measurement were finished from each of the cattle- and sheep-grazed areas in October (i.e., 18 turf samples in total). In the laboratory these were split into 6 pieces (10 cm × 4 cm × 5 cm) and randomly allocated among treatments. The remaining sample was used for moisture determinations. The experimental temperature and moisture conditions were chosen to reflect summer climate warming prediction for the area under a range of naturally occurring moisture conditions. The treatments included three moisture levels, 20, 40, and 80% soil moisture content on a dry weight basis and two temperature treatments, ambient growing season temperatures (10 °C) and the climate change predictions for the area by 2090 (15 °C) (CitationLopez-Moreno et al., 2008) in a fully factorial design. The moisture levels were based on the minimum moisture levels (ca. 20%) recorded in mountain soils in the area during the summer of 2008 (Nuria Altimir, personal communication), the moisture content at sampling in October 2008 (ca. 40%), and the approximate moisture content in the field in June 2008 (ca. 80%), reflecting the range of moisture conditions occurring naturally in the area. The gravimetric moisture content of each sample was determined for each turf sample and moisture levels were adjusted to 20, 40, and 80% by either addition of deionized water or by allowing the turf samples to dry out until the required moisture level was reached. The senescing vegetation was left on the turf samples to minimize disturbance.
The turf samples were allowed to equilibrate for one week after the application of the treatment, thereafter an initial sampling was carried out (in November 2008) to assess the C fluxes at the start of the experiment. The samples were then incubated at the two temperatures for three months after which a final sampling (in February 2009) was carried out to test how the treatments impacted on CO2 and CH4 fluxes over the incubation period.
CO2 and CH4 fluxes from the turf samples were measured using 1.5 L air tight Kilner jars with suba seals fitted as sampling ports. Two samples were collected; first an initial air sample was taken followed by a further air sample taken after 30 min. Mixing of the air was ensured at each sampling time. The 30 min sampling interval was chosen after initial testing had shown a linear response of the gas concentrations for both CO2 and CH4 over this time period. The samples were kept in the dark throughout the experiment. Air samples were analyzed on a gas Chromatograph (Shimadzu, Milton Keynes, U.K.) with a 1 mL sample loop and a molecular sieve column. Concentrations of CH4 and CO2 were determined using a flame ionization detector and a thermal conductivity detector, respectively.
DATA ANALYSIS
Data were analyzed statistically using Genstat v. 11 (http://www.vsn.com). The field data (i.e. biomass and CO2 fluxes) were analyzed in a mixed model using residual maximum likelihood (REML) to estimate the partitioning of the variance. In the mixed model we used grazing regime as the fixed effect and plot as the random effect. The repeated measures term was modeled using auto regression (1) allowing for heterogeneity over time. The results from the laboratory-based climate change experiment were analyzed using analysis of variance (ANOVA). In the ANOVA we used dominant herbivore (i.e. the two different areas), temperature, and moisture as fixed effects and plot as a block effect in the model. Throughout the text we reported means ± standard error (SE).
Results
PLANT BIOMASS
The standing plant biomass and litter did not differ significantly between cattle- and sheep-grazed areas (F1,15 = 0.01, P > 0.05; and F1,16 = 2.21, P > 0.05, respectively) (). The belowground biomass was substantially greater than the aboveground biomass (df = 5, t = -6.23, P < 0.01) and the shoot to root ratios were 0.044 ± 0.004 and 0.008 ± 0.034 in cattle- and sheep-grazed areas, respectively. There was no relationship between above- and belowground biomass at either of the sites.
TABLE 1 Plant and litter biomass in cattle- and sheep-grazed areas measured in June (n = 3) and October (n = 9). Mean and ± SE are shown.
Soil moisture content at the sampling occasions was comparable between cattle- and sheep-grazed areas, i.e. no significant site differences were found between areas either in June (F1,4 = 0.01, P > 0.05) or in October (F1,14 = 0.45, P > 0.05). In June soil moisture content was on average 81.6 ± 10.3 and 82.6 ± 1.9% in cattle- and sheep-grazed areas, respectively. In October soils were considerably drier than in June, 44.2 ± 1.8 and 47.5 ± 3.1%, respectively.
Similarly, soil temperature did not differ significantly (F1,15 = 1.21, P > 0.05) between cattle- and sheep-grazed areas. Soil temperature at 5 cm depth was 11.4 ± 0.5 and 10.9 ± 0.2 °C in cattle and sheep grazed areas in June and 11.7 ± 0.4 and 11.2 ± 0.7 °C in October, respectively.
SOIL CHEMISTRY
Soil organic matter (SOM) content was quite high in the surface soils and did not differ substantially between cattle- (117 mg g-1) and sheep- (134 mg g-1) grazed areas (). The soil C-to-N ratio in the soil surface was 12.2 and 13.2 in cattle- and sheep-grazed areas, respectively. The soils were slightly acidic, with slightly higher pH in the cattle-grazed areas, and had generally low P and K availability ().
FIELD CO2 FLUXES
Both Re (F1,16 = 5.16, P < 0.05) and GEP (F1,15 = 4.97, P < 0.05) were significantly greater in cattle- than in sheep-grazed areas () after the models had been corrected for PAR (F1,9 = 20.07, P = 0.001) and air temperature (F1,8 = 9.74, P < 0.05), respectively (). The aboveground plant biomass did not significantly contribute to the model either for Re or GEP, hence the significant effect of grazing regime on Re and GEP cannot be attributed to aboveground biomass. As both Re and GEP were greater at the cattle-grazed site, NEE did not differ significantly between areas grazed by cattle or sheep (F1,13 = 0.82, P > 0.05) (). In June, the grassland ranged from moderate uptake of CO2 in some plots to being close to a balance in others, -0.7 ± 0.8 and -0.02 ± 0.6 µmol CO2 m-2 s-1, in cattle- and sheepgrazed areas, respectively. In October the area was a net source of CO2, 0.5 ± 0.9 and 1.1 ± 0.3 µmol CO2 m-2 s-1, in cattle- and in sheep-grazed areas, respectively. There was a negative relationship between NEE and biomass in June accounting for 63.1% of the variance (F1,4 = 9.56, P < 0.05) () with greater CO2 uptake in plots with higher biomass, but this pattern did not persist into autumn, i.e. October sampling (F1,16 = 0.09, P > 0.05). The relationship between NEE and biomass in June was not driven directly by either GEP or Re but by a balance between the two; there was no significant relationship between biomass and GEP in either June (F1,4 = 2.60, P > 0.05) or October (F1,16 = 0.19, P > 0.05). Similarly, there was no significant relationship between Re and biomass in June (F1,4 = 1.25, P > 0.05) or October (F1,16 = 0.68, P > 0.05). There was no significant relationship between belowground biomass and NEE, Re, or GEP (F1,4 = 1.79, P > 0.05; F1,4 = 1.40, P > 0.05; F1,4 = 1.90, P > 0.05, for NEE, Re, or GEP, respectively). Furthermore, there was no relationship between any of the soil chemistry parameters () and NEE, Re, or GEP (P > 0.3 in all cases).
TABLE 2 Total elemental and extractable nutrients in surface (0–10 cm) and deeper (10–20 cm) soils at the cattle- and sheep-grazed areas. Mean ± SE and the F and P statistic for the comparison between cattle- and sheep-grazed areas are shown (n = 3). SOM = soil organic matter.
TEMPERATURE AND MOISTURE INCUBATIONS
Similarly as for the field measurements of Re, there was a tendency of higher CO2 effluxes in the incubation experiment from the cattle-grazed areas than from sheep-grazed areas (F1,16 = 3.12, P = 0.09). Higher moisture content and temperatures generally increased the CO2 efflux during the initial sampling occasion, F1,60 = 6.79, P < 0.05; and F2,60 = 6.71, P < 0.05 for temperature and moisture, respectively (). After three months incubation only the moisture effect remained significant (F2,73 = 42.31, P < 0.001; , Parts b and d). A positive interaction between the temperature and moisture treatments at both sampling periods clearly demonstrates that increases in temperature have a strong impact on CO2 efflux only when moisture levels are relatively high (F2,60 = 6.12, P < 0.05 and F2,73 = 3.03, P < 0.05 at the initial and three month sampling, respectively). The elevated temperature under the 80% soil moisture treatment increased the CO2 efflux by 250 and 110% at the initial sampling, and 590 and 320% after three month incubation in cattle- and sheep-grazed areas, respectively. The temperature treatment on its own did not have a strong impact on the CO2 efflux.
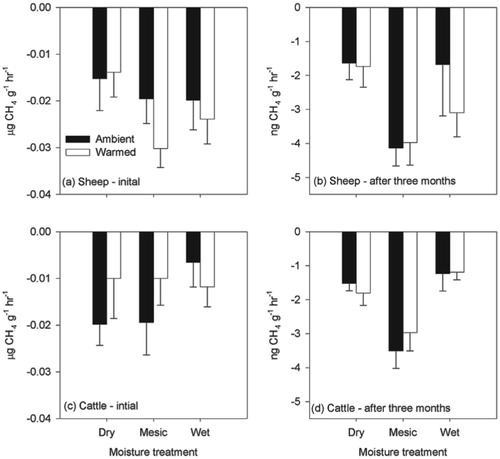
The incubation experiment also showed that these upland soils were net sinks of methane (). Methane fluxes were significantly altered only by the moisture treatments, F2,77 = 2.56, P < 0.05 and F2,80 = 13.87, P < 0.001, for the initial and after three month incubation sampling occasions, respectively. The highest uptake rates of methane occurred at the intermediate moisture level (i.e. 40% soil moisture content, close to field conditions), with the methane uptake rates being lower under drier and wetter soil conditions. Methane uptake rates did not differ significantly between cattle- and sheep-grazed areas.
FIGURE 1. Fluxes of CO2 from cattle- and sheep-grazed areas in June (n = 3) and October (n = 9). (a) Net ecosystem exchange of CO2, (b) gross ecosystem photosynthesis, and (c) ecosystem respiration. Mean and SE are shown. Positive values indicate efflux of CO2 and negative values uptake.
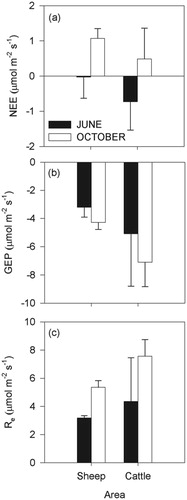
FIGURE 2. Regressions between (a) net ecosystem exchange of CO2 (NEE) and aboveground plant biomass in June 2008; (b) gross ecosystem photosynthesis (GEP) and photosynthetically active radiation (PAR) over the two measurement periods (i.e. June and October); and (c) ecosystem respiration (Re) and air temperature over the two measurement periods. Apart from the plant biomass, values shown are means from 10 records over a 10 min measurement series. Positive values indicate efflux of CO2 and negative values uptake.
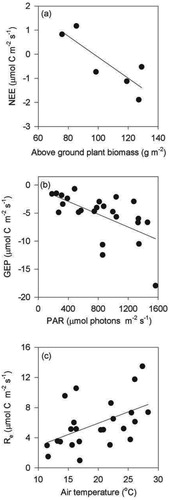
FIGURE 3. Soil respiration rates from soil turf samples incubated in the laboratory under contrasting moisture and temperature regimes from (a) sheepgrazed areas initial analysis, (b) sheep areas after 3 months' incubation, (c) cattle areas initial analysis, and (d) cattle-grazed areas after 3 months' incubation. Mean and SE are shown (n = 9). Positive values indicate efflux of CO2.
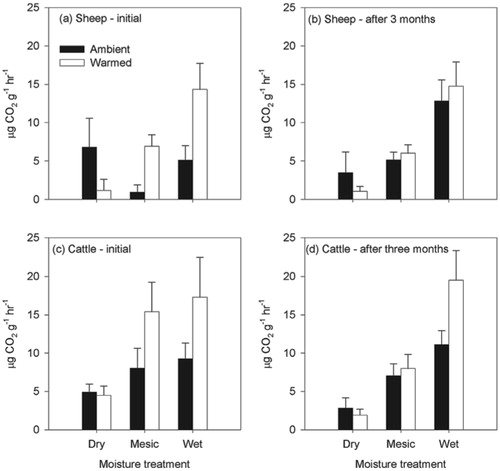
FIGURE 4. Methane fluxes from soil turf samples incubated in the laboratory under contrasting moisture and temperature regimes from (a) sheep areas initial analysis, (b) sheep areas after 3 months' incubation, (c) cattle areas initial analysis, and (d) cattle areas after 3 months' incubation. Mean and SE are shown (n = 9). Negative values indicate net oxidation of CH4. Note the different scales in the graphs with the initial (a and c) data compared to the data after three months (b and d). Negative values indicate uptake of CH4.
Discussion
There was a general trend for greater GEP, Re, and Rs rates in cattle-grazed than in sheep-grazed areas suggesting that the activity of the vegetation and the microbial community was stimulated at the cattle-grazed site. Since there were no significant differences in either soil temperature and moisture or soil C or nutrient status between cattle- and sheep-grazed areas, we speculate that the increased GEP, Re, and Rs in cattle-grazed areas may be driven by changes in the nutrient cycling resulting from the shift in herbivore type driven by (i) changes in the species composition and their decomposition rate and hence nutrient availability, and/or (ii) greater input of feces and trampling caused by cattle (CitationBardgett, 1998; CitationGüsewell et al., 2003; CitationOlofsson et al., 2004; CitationVendramini et al., 2007). Alternatively, the greater C turnover found in the cattlegrazed area might also be driven by the shifts in plant species composition resulting from the change from sheep to cattle grazing (CitationSebastià et al., 2008a). Given that both GEP and Re were increased in the cattle-grazed area, there was no net difference in NEE of CO2 between the two areas.
Our incubation study demonstrates that although increased temperature enhanced CO2 efflux from soils incubated at high moisture levels, this was not the case under the low moisture situation (which reflects both the drier soil conditions during summer (Nuria Altimir, personal communication) (CitationLopez-Moreno et al., 2008). This suggests that climate warming and increased drought (CitationLopez-Moreno et al., 2008) during the summer is likely to reduce CO2 losses from soils in subalpine grasslands in the eastern Pyrenees, and that soil moisture will provide a strong control of the impact of temperature on soil respiration as discussed by Sjögersten and Wookey (Citation2002a) and Borken and Matzner (Citation2008). Given the naturally occurring variation in moisture in the region, we suggest that the greatest increases in soil respiration in response to climate change in these ecosystems are likely to occur during periods of high soil moisture, e.g. spring and autumn. The impact of temperature appeared to be more transient than that of soil moisture, i.e. the effect of the elevated temperature treatment on soil respiration rates had diminished at the end of the incubation period (three months) whilst higher moisture still resulted in elevated CO2 efflux. Conant et al. (Citation2008) also found reduced effects of elevated temperature on soil respiration with time as labile C in a grassland soil was consumed but the lower CO2 efflux at higher temperature may also be related to reduced root inputs over the three months (CitationBahn et al., 2006, Citation2008). Clearly vegetation responses to changes in temperature and moisture conditions need to be considered in parallel with soil responses before any conclusions on the overall impacts of climate change on the ecosystem C balance on these subalpine grasslands; indeed, elevated temperature has been found to enhance NPP at least in the short term (CitationSebastià, 2007).
We found no differences in CH4 oxidation between sheep-and cattle-grazed areas, suggesting that the current change in land use in the area is not impacting on the CH4 oxidation. However, grazing has been shown to increase CH4 oxidation rates in situations where high grazing pressure leads to soil degradation and drier soil conditions (CitationWang et al., 2010). Levels of CH4 oxidation similar to those we found after three months in the lowest moisture treatment were found in native grassland soils at similar moisture levels (1.1 ng CH4 g-1 hr-1; CitationDijkstra et al., 2010) whilst considerably lower levels of CH4 oxidation were found in pastures established ca. 25 years ago (0.044 ng CH4 g-1 hr-1; CitationJacinthe and Lal, 2005). In our study, soil moisture was a strong driver also of methane oxidation rates. The greatest methane oxidation rates were found at intermediate soil moisture levels (40%) where the methanotrophic bacteria are not limited by moisture deficit and the diffusion of air into the soil is not severely reduced by water in the soil pores (CitationSaari et al., 2004a; CitationHolst et al., 2008; CitationMenyailo et al., 2008; CitationWang et al., 2010). The increased drought predicted in the area (CitationLopez-Moreno et al., 2008) might therefore reduce the methane sink strength in these soils. The substantial drop in methane oxidation rates (by several orders of magnitude) over the three month incubation period is interesting as it suggests that the activity of the vegetation is important for maintaining methanotrophic activity in these soils, possibly through inputs of labile carbon into the soil (CitationGoldman et al., 1995) or plant uptake of NH4+, since NH4+ in the soil can inhibit CH4 oxidation (CitationSmith et al., 2000; CitationSaari et al., 2004b).
Conclusions
Our results suggest that the current change in land management from sheep to cattle grazing has limited effects on net CO2 and CH4 fluxes. However, cattle grazing appeared to increase the turnover of CO2, with potential implications for ecosystem C storage in the longer term. Our findings suggest that the climate warming predicted in the Pyrenees will be a stronger driver of C fluxes than the current changes in grazing practice, indeed drier soil conditions may reduce CO2 losses from the soil system due to moisture deficit as well as reducing the CH4 sink strength in soils.
Acknowledgments
This work was funded by the University of Nottingham and the projects from the Spanish Ministry of Science and Innovation CARBOAGROPAS (CGL2006-13555-CO3-01/BOS), OBAMA (CGL2009-13425-C02-01 /BOS), and MONTES (Consolider-Ingenio CSD2008-000). We are grateful for field and laboratory support from Daniel Ventura and CTFC staff. Dr. Brian Atkinson provided a much appreciated internal review on the manuscript.
Related Research Data
References Cited
- Auer, I. , Böhm, R. , Jurkovic, A. , et al., 2007: HISTALP—Historical instrumental climatological surface time series of the Greater Alpine Region. International Journal of Climatology , 27: 17–46.
- Bahn, M. , Knapp Garajova, Z. , Fahringer, N. P. , and Cernusca, A. , 2006: Root respiration in temperate mountain grasslands differing in land use. Global Change Biology , 12: 995–1006.
- Bahn, M. , Rodeghiero, M. , Anderson-Dunn, M. , Dore, S. , Gimeno, C. , Drösler, M. , Williams, M. , Ammann, C. , Beminger, F. , Flechard, C. , Jones, S. , Balzarolo, M. , Kumar, S. , Newesely, C. , Priwitzer, T. , Raschi, A. , Siegwolf, R. , Susiluoto, S. , Tenhunen, J. , Wohlfahrt, G. , and Cernusca, A. , 2008: Soil respiration in European grasslands in relation to climate and assimilate supply. Ecosystems , 11: 1352–1367.
- Bardgett, R. D. , Wardle, D. A. , and Yeates, G. W. , 1998: Linking above- and below-ground interactions: how plant responses to foliar herbivory influence soil organisms. Soil Biology and Biochemistry , 30: 1867–1878.
- Beniston, M. , 2006: Mountain weather and climate: a general overview and a focus on climatic change in the Alps. Hydrobiologia , 562: 3–16.
- Bodelier, P. L. E. , and Laanbroek, H. J. , 2004: Nitrogen as a regulatory factor of methane oxidation in soils and sediments. FEMS Microbial Ecology , 47: 265–277.
- Borken, W. , and Matzner, E. , 2008: Reappraisal of drying and wetting effects on C and N mineralization and fluxes in soils. Global Change Biology , 15: 808–824.
- Conant, R. T. , Drijber, R. A. , Haddix, M. L. , Parton, W. J. , Paul, E. A. , Plante, A. F. , Six, J. , and Steinweg, J. M. , 2008: Sensitivity of organic matter decomposition to warming varies with its quality. Global Change Biology , 14: 868–877.
- Dijkstra, F. A. , Morgan, J. A. , LeCain, D. R. , and Follett, R. F. , 2010: Microbially mediated CH4 consumption and N2O emission is affected by elevated CO2, soil water content and decomposition of semi arid grassland species. Plant and Soil , 329: 269–281.
- Ganjegunte, G. K. , Vance, G. F. , Preston, C. M. , Schuman, G. E. , Ingram, L. J. , Stahl, P. D. , and Welker, J. M. , 2005: Soil organic carbon composition in a northern mixed-grass prairie: effects of grazing. Soil Science Society of America Journal , 69: 1746–1756.
- Garcia-Pausas, J. , Casals, P. , Camarero, L. , Huguet, C. , Sebastià, M. T. , Thompson, R. , and Romanya, J. , 2007: Soil organic carbon storage in mountain grasslands of the Pyrenees: effects of climate and topography. Biogeochemistry , 82: 279–289.
- Goldman, M. B. , Groffman, P. M. , Pouyat, R. V. , McDonnell, M. J. , and Pickett, S. T. A. , 1995: CH4 uptake and N availability in forest soil along a rural to urban gradient. Soil Biology and Biochemistry , 27: 281–286.
- Güsewell, S. , Jewell, P. L. , and Edwards, P. J. , 2003: Effects of heterogeneous habitat use by cattle on nutrient availability and litter decomposition in soils of an Alpine pasture. Plant and Soil , 268: 135–149.
- Holst, J. , Liu, C. , Yao, Z. , Bruggemann, N. , Zheng, X. , Giese, M. , and Butterbach-Bahl, K. , 2008: Fluxes of nitrous oxides, methane and carbon dioxide during freezing-thawing cycles in an Inner Mongolian steppe. Plant and Soil , 308: 105–117.
- IPCC , 2007: Climate change 2007: the physical science basis. In Solomon, S. , Qin, D. , Manning, M. , et al. (eds.), The Physical Science Basis. Contribution of Working Group I to the Fourth Assessment Report of the Intergovernmental Panel on Climate Change. Cambridge: Cambridge University Press.
- Jacinthe, P. A. , and Lal, R. , 2005: Labile carbon and methane uptake as affected by tillage intensity in a Mollisol. Soil Tillage Research , 80: 35–45.
- LeCain, R. D. , Morgan, J. A. , Schuman, G. E. , Reeder, J. D. , and Hart, R. H. , 2002: Carbon exchange and species composition of grazed pastures and exclosures in the shortgrass steppe of Colorado. Agriculture, Ecosystems and Environment , 93: 421–435.
- Lloyd, J. , and Taylor, J. A. , 1994: On the temperature-dependence of soil respiration. Functional Ecology , 8: 315–323.
- Lopez-Moreno, J. I. , Goyette, S. , and Beniston, M. , 2008: Climate change prediction over complex areas: spatial variability of uncertainties and predictions over the Pyrenees from a set of regional climate models. International Journal of Climatology , 28: 1535–1550.
- Menyailo, O. V. , Hungates, B. A. , Abraham, W. R. , and Conrad, R. , 2008: Changing land use reduces soil CH4 uptake by altering biomass and activity but not composition of high affinity methanotrophs. Global Change Biology , 14: 2405–2419.
- Ninyerola, M. , Pons, X. , and Roure, J. M. , 2000: A methodological approach of climatological modelling of air temperature and precipitation through GIS techniques. International Journal of Climatology , 20: 1823–1841.
- Nogués-Bravo, D. , Araujo, M. B. , Errea, M. P. , and Martinez-Rica, J. P. , 2007: Exposure of global mountain systems to climate warming during the 21st century. Global Environmental Change , 17: 420–428.
- Olofsson, J. , and Oksanen, L. , 2002: Role of litter decomposition for the increased primary production in areas heavily grazed by reindeer: a litterbag experiment. Oikos , 96: 507–515.
- Olofsson, J. , Stark, S. , and Oksanen, L. , 2004: Reindeer influence on ecosystem processes in the tundra. Oikos , 105: 386–396.
- Olofsson, J. , Oksanen, L. , Callaghan, T. , Hulme, P. E. , Oksanen, T. , and Suominen, O. , 2009: Herbivores inhibit climate-driven shrub expansion on the tundra. Global Change Biology , 15: 2681–2693.
- Rebetez, M. , and Reinhard, M. , 2008: Monthly air temperature trends in Switzerland 1901–2000 and 1975–2004. Theoretical and Applied Climatology , 91: 27–34.
- Saari, A. , Smolander, A. , and Martikainen, P. J. , 2004a: Methane consumption in a frequently nitrogen-fertilized and limed spruce forest soil after clear-cutting. Soil Use and Management , 20: 65–73.
- Saari, A. , Rinnan, R. , and Martikainen, P. J. , 2004b: Methane oxidation in boreal forest soils: kinetics and sensitivity to pH and ammonium. Soil Biology and Biochemistry , 36: 1037–1046.
- Schuman, G. E. , Reeder, J. D. , Manley, J. T. , Hart, R. H. , and Manley, M. A. , 1999. Impact of grazing management on the carbon and nitrogen balance of a mixed-grass rangeland. Ecological Applications , 9: 65–71.
- Sebastià, M. T. , 2004: Role of topography and soils in grassland structuring at the landscape and community scales. Basic and Applied Ecology , 5: 331–346.
- Sebastià, M. T. , 2007: Plant guilds drive biomass response to global warming and water availability in subalpine grassland. Journal of Applied Ecology , 44: 158–167.
- Sebastià, M. T. , and Puig, L. , 2008: Complex vegetation responses to soil disturbances in mountain grassland. Plant Ecology , 199: 77–88.
- Sebastià, M. T. , deBello, F. , Puig, L. , and Taull, M. , 2008a: Grazing as a factor structuring grassland in the Pyrenees. Applied Vegetation Science , 11: 215–223.
- Sjögersten, S. , and Wookey, P. A. , 2002a: Climatic and resource quality controls on soil respiration across a forest-tundra ecotone in Swedish Lapland. Soil Biology and Biochemistry , 34: 1633–1646.
- Sjögersten, S. , and Wookey, P. A. , 2002b: Spatio-temporal variability and environmental controls of methane fluxes at the forest-tundra ecotone in the Fennoscandian mountains. Global Change Biology , 8: 885–894.
- Sjögersten, S. , van der Wal, R. , and Woodin, S. J. , 2006: Small-scale hydrological variation determines landscape CO2 fluxes in the High Arctic. Biogeochemistry , 80: 205–216.
- Smith, K. A. , Dobbie, K. E. , Ball, B. C. , Bakken, R. L. , Sitaula, B. K. , Hansen, S. , Mcdonald, J. A. , Skiba, U. , Klemedtsson, L. , Klemedtsson, L. , Degorska, A. , and Orlanski, P. , 2000: Oxidation of atmospheric methane in Northern European soils, comparison with other ecosystems, and uncertainties in the global terrestrial sink. Global Change Biology , 6: 791–803.
- Stark, S. , Strommer, R. , and Tuomi, J. , 2002: Reindeer grazing and soil microbial processes in two suboceanic and two subcontinental tundra heaths. Oikos , 97: 69–78.
- Vendramini, J. M. B. , Silveira, M. L. A. , Dubeux, J. C. B., Jr. , and Sollenberger, L. E. , 2007: Environmental impacts and nutrient recycling on pastures grazed by cattle. Revista Brasileira de Zootecnia , 36: 139–149.
- Wang, J. , Wang, G , Hu, H. , and Wu, Q. , 2010: The influence of degradation of the swamp and alpine meadows on CH4 and CO2 fluxes on the Qinghai-Tibetan Plateau. Environmental Earth Sciences , 60: 537–548.
- Welker, J. M. , Fahnestock, J. T. , Henry, G. H. R. , O'Dea, K. W. , and Chimner, R. A. , 2004: CO2 exchange in three high Canadian High Arctic ecosystems: response to long-term experimental warming. Global Change Biology , 10: 1981–1995.