Abstract
To better understand the basic characteristics of the land surface energy budget, nearly 7 years of continuous measurements at the Qomolangma Station for Atmospheric and Environmental Observation and Research, Chinese Academy of Sciences (QOMS/CAS) (28.21°N, 86.56°E, 4276 m a.s.l.) have been analyzed systematically. Seasonal and annual variations of micrometeorological measurements and land surface energy balance were analyzed. The general nature of the diurnal variation of the surface winds on the north of Mt. Everest is represented by a maximum in the afternoon and a constant wind speed in the early morning, which is controlled not only by the significant glacier wind but also by the local mountain-valley circulation and upper-level wind. Surface albedo decreases with increasing soil moisture content, showing the typical exponential relation between surface albedo and soil moisture. The data set disclosed that the high soil moisture in summer is coordinated with low albedo. The ratio between sensible heat and net radiation (H/Rn) can be as high as 0.49 when the soil is dry. The ratio (H/Rn) decreases to 0.14 with the increasing of soil moisture. On the contrary, the ratio between latent heat flux and net radiation (LE/Rn) is increased when soil moisture is rising. The highest ratio (LE/ Rn) can be as high as 0.5 when soil moisture changes between 15% and 20%. After defining the effects of different soil moisture level on partitioning of surface available energy into sensible and latent heat fluxes, we can qualify how much the sensible heating is decreasing and the latent heating is increasing in this region under current plateau environment changes of warming and moistening.
Introduction
The Himalaya Range is located on the southern edge of the Tibetan Plateau and includes more than 100 mountain peaks exceeding 7200 m. It forms an arc 2400 km long, running from west to east. As the south barrier of the plateau with a large area of high mountains directly pierces Earth's middle troposphere, it has great influence on that region's weather and climate (CitationYe and Gao, 1979; CitationGao, 1981; CitationBollasina and Benedict, 2004; CitationUeno et al., 2008; CitationZhou et al., 2008; CitationZhong et al., 2009; CitationZou et al., 2009). Based on model simulations, Boos and Kuang (Citation2010) suggested that these mountains are more important in producing the South Asian summer monsoon than the Tibetan Plateau. However, long time monitoring of meteorological elements is still rare in this region (CitationMoore and Semple, 2004). The lack of quantitative understanding of interactions between the huge mountains and the atmosphere makes it difficult for us to analyze and model the energy and water exchange in this region. While several studies have been conducted on the land-surface processes over regions of the Tibetan Plateau (CitationTanaka et al., 2001; CitationGu et al., 2005; CitationMa et al., 2005; CitationLi et al., 2006; CitationYao et al., 2011), few have focused on the mountains.
The highest mountain in the world, Mt. Everest, is situated in the Himalaya Range area. This area is an ideal environment for observing mass and energy exchanges between the mountain and free atmosphere (CitationSun et al., 2007; CitationZhong et al., 2009). However, there are only rare reports on the annual variation of albedo and surface energy fluxes with soil moisture content in this area.
The weather and climate conditions of the region are of considerable interest for both scientific and recreational purposes (CitationMoore and Semple, 2004). High-altitude observations are important for model physics evaluation and improvement (CitationBollasina and Benedict, 2004). In 1960s, Bishop et al. (Citation1966) measured solar radiation on glaciers of Mt. Everest. Ueno et al. (Citation2008) reported a stepwise onset of monsoon on the southern slope of Mt. Qomolangma. The turbulent heat exchange on the northern slope of Mt. Everest was studied (CitationZhong et al., 2009; CitationZou et al., 2009). The glacier winds along the northern slope of Mt. Everest were also studied (CitationYe and Gao, 1979; CitationSong et al., 2007; CitationZou et al., 2008). Barros et al. (Citation2004) described the linkage between rainfall, local circulation, and topography around Mt. Everest. Yang et al. (Citation2011) presented spatial and temporal variations of air temperatures and relative humidity on the north slope of Mt. Everest. Moore and Semple (Citation2004) and Xie et al. (Citation2008) compared the observations with reanalysis data on Mt. Everest. However, Bollasina and Benedict (Citation2004) still pointed out that land-atmosphere interactions over Himalaya needed to be paid particular attention. This study is intended to document the diurnal characteristics of meteorological measurements, albedo, soil moisture, precipitation events, and land surface energy partitioning on the north of Mt. Everest, using the data set of a permanent observation station. The station is located on a north flat area of Mt. Everest (see ). The objectives of this paper are threefold: (1) to study the seasonal variations of surface-layer parameters and fluxes, (2) to investigate the local circulations and precipitation phenomena, and (3), as a typical station with a surface sandy soil and gravels, to depict the impacts of soil moisture on the albedo and the surface energy distribution.
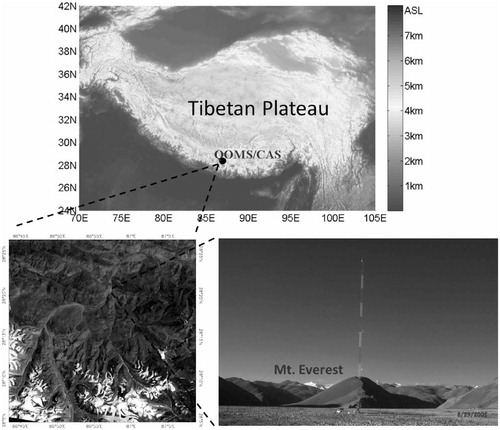
FIGURE 1. The landscape of the Tibetan Plateau and environment around the QOMS/CAS station. The bottom right picture is taken facing south.
Site and Measurements
A comprehensive observation and research station on the north slope of Himalaya was established by the Institute of Tibetan Plateau Research (ITP), the Chinese Academy of Sciences, in August 2005 (CitationMa et al., 2009). The Qomolangma Station for Atmospheric and Environmental Observation and Research, Chinese Academy of Sciences (QOMS/CAS), is located at 28°21.63′N, 86°56.93′E, at an elevation of 4276 m, and 30 km away from Mt. Everest. The station has been kept in operation for almost 7 years and collects atmospheric and environmental data continuously.
A 40 m planetary boundary layer (PBL) tower was set up. The terrain around the tower is fairly flat. Sensors of wind speed and direction (014A-L, Met One), air temperature, and relative humidity (HMP45C, Vaisala) at five levels (1.0, 2.0, 4.0, 10.0, and 20.0 m) are installed on the PBL tower, with signals recorded at 10-min intervals by a data logger (CR23X, Campbell). The surface radiation monitoring system consists of upward and downward pyranometers (CM21, Kipp & Zonen) for outgoing and incoming shortwave radiation; and upward and downward pyrgeometers (CG4, Kipp & Zonen) for outgoing and incoming long-wave radiation. Other measurements including precipitation gauges (TE525MM-L, Young), vertical profiles of soil temperature and soil moisture, and soil heat flux were also installed. The soil temperature was measured at depths of 0, 10, 20, 40, 80 and 160 cm using temperature probes (Campbell Scientific Inc., Model 109). The soil moisture content was measured at depths of 10, 20, and 30 cm using a water content reflectometer-Time Domain Reflectometry (TDR) system (Campbell Scientific Inc., probe type CS616). The soil heat flux was measured using two Hukseflux soil heat flux plates (Campbell Scientific Inc., Model HFP01) buried at a depth of 10 cm. An open path eddy covariance turbulent measurement system (CSAT3; LI 7500) was set up at 3.1 m height. It keeps continuously working at a sampling frequency of 10 Hz. The half hour sensible (H) and latent heat flux (LE) is computed from the original high frequency turbulent data processed by TK2 software (CitationMauder and Foken, 2004). The soil heat flux at the surface (G) is calculated by adding the measured flux at 10 cm depth to the energy stored in the layer above the heat flux plates (CitationFoken, 2008).
The meteorological and soil observation data were measured every 10 min. All the data sets were then resampled to 30 min by the nearest interpolation method. The land surface around the station is covered by sand and gravels with sparse vegetation, which is a typical landscape on the north slope of Mt. Everest.
Results
SEASONAL AND DIURNAL VARIATION
A year of air temperature, humidity, wind speed, and wind direction at 10 m height is shown in . The x-axis is the day of the year and the y-axis is the time of day. Air temperature showed a significant seasonal variation. The air temperatures are found to vary in the range of – 20.4 to 26.1 °C. The difference between the highest air temperature and lowest air temperature was 46.5 °C. The variation of humidity near the surface indicates quite well the physical processes regulating the moisture content of the air at the ground. The diurnal variation in relative humidity (RH) is out of phase with the temperature variation. High water vapor content are observed at nighttime during the monsoon, which is associated with the night heavy rains during this season (see ), as pointed out by Liu et al. (Citation2002). Low values of water vapor content are observed at daytimes. The diurnal variability of water vapor content is greater during monsoon.
Before noon time, the wind is dominated by weak south wind, then changes to north at around 10:00–11:00 local time (LT). After 2–4 h of north wind, the wind direction returns back to south in summer monsoon time and southwest in winter. The most popular wind section is southwest and northeast, which is also consistent with the alignment of the small valley in which the station is located. In later afternoon, the wind becomes strongest of the whole day, and then declines to a low value in the morning. In wintertime, the north slope of Mt. Everest region was controlled by the westerly. From December to the following middle of April, most wind during 14:00–22:00 LT comes from southwest, which is a synthesis of westerly and south glacier wind. The southeast wind of later afternoon is a synthetic result of the East Asia monsoon and persistent glacier wind. The north up-valley wind at summer noontime lasts for 5 h, from 11:00 to 16:00. The north wind at winter noontime continues only 2 h. The total wind speed at 10 m height is shown in . Generally, the calm periods are observed before 14:00. The wind speed is not stronger than 5 m s-1 before 14: 00. The wind speed becomes higher from 14:00 to 21:00. The temperature difference in the afternoon between glaciers and land surface down slope becomes stronger, then evokes abovementioned stronger down-slope glacier wind (CitationSong et al., 2007). In the meantime, local mountain and valley wind circulation can also strengthen the south glacier wind at daytime, and weaken it at nighttime.
Monthly mean air temperature has a large seasonal variation. It reaches a maximum of 12.3 °C in July. The lowest monthly mean air temperature was recorded in January with a value of – 3.2 °C (). The humidity is highest in August, when the wind speed is the lowest (). The pressure has a first peak in September and a second peak in April (). The highest surface pressure presents during late fall. The pressure of February is the lowest.
As several studies have pointed out that the surface heat transfer is closely related to monsoon activity (CitationTanaka et al., 2001; CitationZou et al., 2009), here we further test the relationship between surface radiation and monsoon activity on the north slope of Mt. Everest. One year was divided into four periods: JFM (January-March), AMJ (April—June), JAS (July-September), and OND (October— December). To investigate the diurnal variation of the radiation components, we used a composite analysis method. The seasonal means of diurnal variation of the four radiation components: (1) downward shortwave radiation (hereafter, DSR), (2) upward shortwave radiation (USR), (3) downward long-wave radiation (DLR), and (4) upward long-wave radiation (ULR) are shown in for January 2007 to December 2008. Diurnal variation for all four radiation components was significant except for DLR. The distributions of DSR and USR are symmetrical with maximum values at 15:00 LT. DSR and ULR of AMJ monsoon onset period are higher than other three seasons. The monsoon onset period has a stronger solar radiation and higher upward long-wave radiation even than the monsoon active period (JAS).
Figure 5 shows comparisons of mean diurnal cycles of net radiation (Rn), sensible heat flux (H), latent heat flux (LE), and ground heat flux (G) in four seasons. H and G were the two main consumers of surface energy. All components exhibited distinct diurnal cycles. The range of the diurnal cycle of Rn increased from winter to summer and decreased from summer to winter, implying that the diurnal variation of Rn was significant in summer and weak in winter. H in AMJ was the largest of the four seasons. AMJ is the monsoon break period. The sensible heat flux in the monsoon break period is larger than that in the active period (JAS). This result was also reported by other studies, such as Zou et al. (Citation2009). G of AMJ is also the highest among the four seasons. The amplitude of G can be comparable to H during JFM and OND.
THE IMPACTS OF SOIL MOISTURE ON ALBEDO
The surface albedo is one of the most important parameters to reflect the land surface characteristics. Land surface albedo is calculated from measurements of the shortwave radiation components, as the ratio of the total upward solar radiation (the reflected solar radiation) and the total downward solar radiation reaching the surface. Here the half hourly average data sets were used. The incoming and outgoing shortwave radiation fluxes were measured using two pyrgeometers at a height of 1.5 m. The monthly average albedo is the lowest in July and August, about 0.25 (which is not shown). In the wintertime, it is around 0.33, which is the highest value of monthly average.
Surface albedo is strongly influenced by solar elevation angle and surface conditions, such as soil moisture, vegetation cover, roughness, and so on. As our research area is a flat bare landscape, the influence of vegetation can be eliminated. In order to study the influence of the soil moisture on surface albedo, it is necessary to first examine the influence of solar zenith angle on surface albedo (CitationWang et al., 2005; CitationGuan et al., 2009). Here we chose observations from 1 May to 30 September without snow events. The solar zenith angle can be calculated from the longitude and latitude of the site, Julian day, and mean measurement time. The results show that solar zenith angle has little influence on the surface albedo when the solar zenith angle varies below 30°. Therefore, when the solar zenith angle varies from 0° to 30°, the surface albedo was used to study its variation with top soil moisture (). , shows that the top soil moisture increases sharply at the end of June. The corresponding precipitation is shown by bars. The soil moisture coordinates very well with every rain event. Soil moisture in shallow layers is strongly affected by precipitation. Meantime, the observed albedo dropped during each rain event.
FIGURE 2. Diurnal and seasonal variations of (a) temperature, (b) relative humidity, (c) wind direction, (d) wind speed, and (e) water vapor content in the year of 2007.
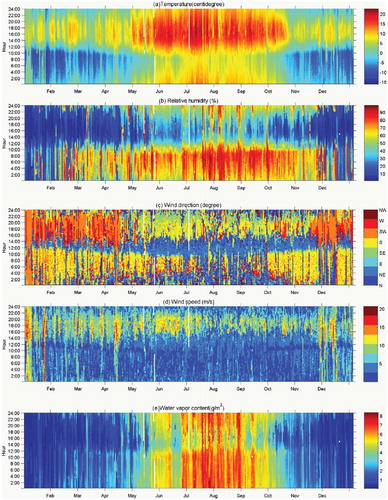
FIGURE 3. Monthly average of (a) air temperature, (b) relative humidity, (c) wind speed, and (d) pressure at QOMS/CAS. Vertical bars in these figures represent the standard deviations from the mean.
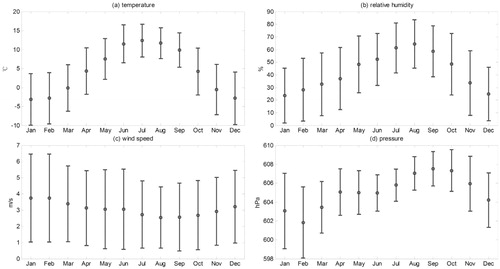
FIGURE 4. Seasonal means of diurnal variation of (a) downward shortwave radiation (DSR), (b) downward long-wave radiation (DLR), (c) upward shortwave radiation (USR), and (d) upward long-wave radiation (ULR) at QOMS/CAS. JFM (January-March), AMJ (April—June), JAS (July-September), OND (October-December).
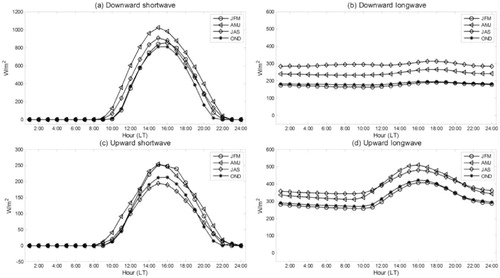
FIGURE 5. Diurnal cycle of the seasonal mean of (a) net radiation (Rn), (b) latent heat flux (LE), (c) sensible heat flux (H), and (d) ground heat flux (G) at QOMS/CAS, JFM (January-March), AMJ (April-June), JAS (July-September), OND (October-December).
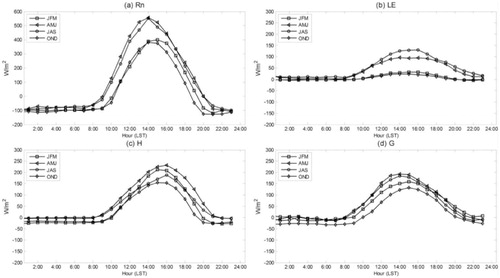
FIGURE 6. Variation of (a) albedo and (b) soil moisture (black) with precipitation (gray) from 1 June to 30 September 2007 at QOMS/CAS.
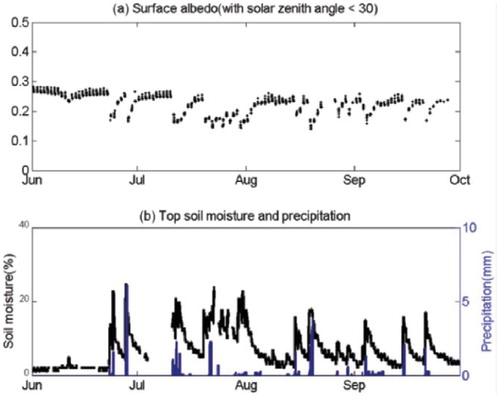
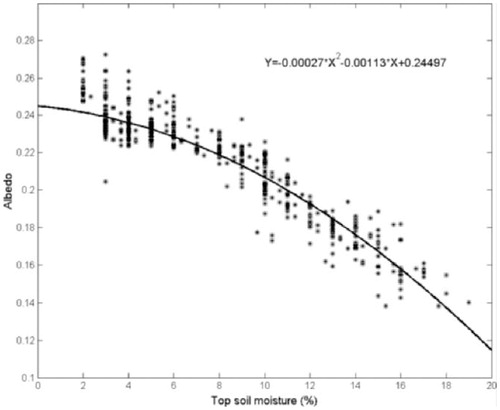
Figure 7 shows the relationship between surface albedo and surface soil moisture content (volume per volume) in the top soil. One can see that albedo decreases with increasing soil moisture, with the data fitting the following equation:
Soil moisture (SM) is the key parameter not only in controlling variation of albedo, but also influencing the ratio of net radiation partitioning into latent and sensible heat fluxes. In the next section, we will focus on the latter.
FIGURE 7. The scatter plot and fitting line between top soil moisture and albedo from June to September 2008.
THE IMPACTS OF SOIL MOISTURE ON THE LAND-ATMOSPHERE ENERGY EXCHANGE
Soil moisture has been shown to play an important role in the occurrence of climate extremes (CitationJung et al., 2010; CitationHirschi et al., 2011). The role of soil moisture on the weather and climate change is accomplished by adjusting the land-air energy and water exchanges. In order to evaluate the influence of soil moisture variations on the surface energy flux, we divide top SM into different levels: level 1 (red), 0–2.7%; level 2 (green), 2.7–6.1%; level 3 (blue), 6.1–9.5%; level 4 (gray), 9.5–12.9%; and level 5 (pink), 12.9–16.3%. Based on the SM level, we plot both sensible heat flux and latent heat flux scatter points with net radiation (). The turbulent heat fluxes from 10:00 to 16:00 were used here, due to stronger heat and water coupling between the land-surface and the air during daytime. Taking the points distribution into account, linear fitting lines were used. The difference in the intercepts of the five fitting lines is relatively small. The ratio of H/Rn on SM level 1 can be as high as 0.41, then it gradually decreases to 0.13 at SM level 5. The scatter points of LE and Rn demonstrate that the slope between LE and Rn is rising, when the soil moisture changes from level 1 to level 5 and becomes wet. The ratio of LE and Rn is increased from 0.17 to 0.5 by rising soil moisture from level 1 to level 5. The Evaporative Fraction (EF) (CitationNichols and Cuenca, 1993), which characterizes the partition of the surface energy budget, is defined as the ratio between the latent heat flux and available energy at the surface.
FIGURE 8. (a) scatter points between sensible heat flux (H) and net radiation (Rn), (b) scatter points between latent heat flux (LE) and net radiation (Rn) , (c) scatter points between LE and H + LE. Each soil moisture level is labeled with different color. Level 1, red color, 0–2.7% soil moisture; level 2, green, 2.7–6.1% soil moisture; level 3, blue, 6.1-9.5% soil moisture; level 4, yellow, 9.5–12.9% soil moisture; level 5, pink, 12.9–16.3% soil moisture.
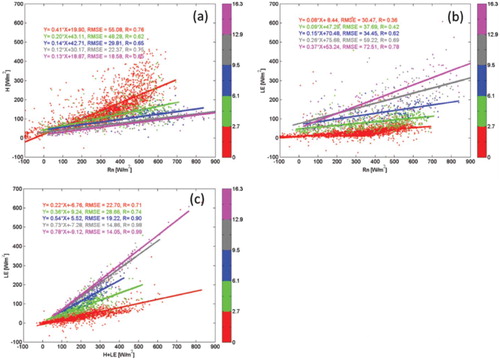
LE scatter points with LE + H are drawn in . EF increases with rising of the soil moisture content. The intercepts of five linear lines in , are small and have little difference. Thus EF of each soil moisture level is taken as the corresponding slope value. EF is increased from 0.22 on SM level 1 to 0.78 on level 5. The slopes of level 4 and 5 have little discrepancy. The high EF on levels 4 and 5 suggest that the soil was saturated, and a large part of available energy at the surface was used for evaporation.
We pick out the slopes of the fitting lines in and the SM level, and plot them in . It shows that the ratio of sensible heat flux and net radiation (H/Rn) decreases from 0.55 to a lowest value of 0.14 when soil moisture increased from zero to 15% (). On the contrary, the ratio of latent heat flux and net radiation (LE/Rn) increases from 0.10 to 0.40 when soil moisture increased from zero to 15% (). The scatter points in , were fitted by the following exponential functions:
FIGURE 9. (a) Scatter plot and spline fitting functions between the ratio of sensible heat flux (H) and net radiation (Rn) and soil moisture level, (b) scatter plot and spline fitting functions between the ratio of latent heat flux (LE) and net radiation (Rn) and soil moisture level, and (c) scatter plot and spline fitting functions between evaporative fraction (LE/[H + LE]) and soil moisture.
![FIGURE 9. (a) Scatter plot and spline fitting functions between the ratio of sensible heat flux (H) and net radiation (Rn) and soil moisture level, (b) scatter plot and spline fitting functions between the ratio of latent heat flux (LE) and net radiation (Rn) and soil moisture level, and (c) scatter plot and spline fitting functions between evaporative fraction (LE/[H + LE]) and soil moisture.](/cms/asset/ddecdc74-d549-4ab2-a0a9-ac37dba13e70/uaar_a_11957629_f0012.jpg)
These two equations give us a regional estimation of the soil moisture variations effects on the surface energy, under the current plateau climatic environment. As scientists have disclosed, the thawing process of frozen soil is accelerating (CitationYang et al., 2010). The thawing will increase the soil moisture in a short time. Researchers have discussed that increasing soil moisture will decrease sensible heat flux and strengthen latent heat effects, but without dependable observational results. These results give us a quantitative estimation of the influence of top soil moisture on the land-atmosphere heat and water exchanges, which are jointly dominated by sensible and latent heat fluxes. The soil moisture-induced variations of energy and water exchanges may cause alternations of the energy and water circle around the plateau.
When the soil is dry, the evaporative fraction is typically 0.2, demonstrating that only 20% of the energy transferred from the surface to the atmosphere is via latent heating (). In contrast, the evaporative fraction is ∼0.8 when the soil is wet. A more gradual increasing of EF sensitivity with a decrease in soil moisture was shown in the picture. This also suggests that accuracy in the measurement of soil moisture is most critical within the drier portion of the range of variability of soil moisture (CitationDirmeyer et al., 2000).
STATISTICS OF PRECIPITATION EVENT
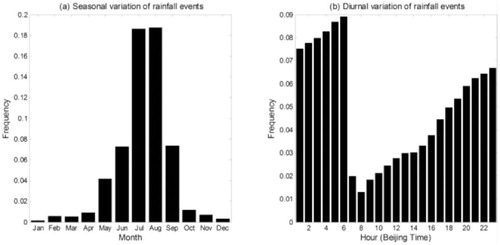
Precipitation was unevenly distributed throughout the year, with more than 90% of annual precipitation falling from May through September. The highest monthly precipitation events happened in July and August (). Precipitation frequency exhibited pronounced daily variability with an increasing trend from morning to late afternoon and evening, with a maximum value around 06:00 h. Precipitation from midnight through early morning was frequently observed in the central Tibetan Plateau (CitationSingh and Nakamura, 2009; CitationUeno et al., 2009) and southeastern Tibetan Plateau (CitationChen et al., 2012). The study by Higuchi et al. (Citation1982) of the south slope of Himalaya stated that the precipitation frequency in valley concentrated during the evening up to midnight; our observations shows precipitation frequency peaks in the early morning. Huang and Chan (Citation2011) also reported that diurnal rainfall variation over southeast China is frequently characterized by a major peak in the afternoon and a minor peak in the early morning. They concluded that the land-sea differential radiative heating/cooling are the major reasons for the early morning peak rainfall. Yang et al. (Citation2008) discussed the impacts of latitude, altitude, atmospheric circulation, water vapor transportation, and other variables on the distribution of summer monsoon precipitation. Both Liu et al. (Citation2009) and Fujinami et al. (Citation2005) pointed out that the diurnal variations of summertime precipitation over the Tibetan Plateau are related to orographically induced regional circulations. Due to differential elevations between the Himalaya mountains and nearby flat areas, the daytime solar heating or nighttime infrared radiative cooling can generate remarkable horizontal temperature gradients, leading to mountain-plain circulation and thus diurnal rainfall variations. The substantial inhomogeneity in the landscape around Mt. Everest may therefore produce a unique regional diurnal rainfall characteristic, which is related with the diurnal variations of local atmospheric circulation. The examination of the diurnal rainfall variation provides a basis for further understanding orographical and heterogeneous land-surface impacts on convection in the future.
FIGURE 10. Statistical histograms of rainfall events: (a) seasonal variation by month, (b) diurnal variation using Beijing Time.
Discussions and Conclusions
Most of the meteorological parameters measured on the north side of Mt. Qomolangma undergo dramatic seasonal and annual variations. The study of Zhou et al. (Citation2008) showed the importance of the local wind system in the Himalayas to the vertical air exchange between the surface and upper atmosphere. The local circulation in this region is also included in this paper. The glacial winds from Mt. Qomolangma significantly influence the local circulations on the north slope (CitationChen et al., 2007; CitationSong et al., 2007; CitationSun et al., 2007; CitationZou et al., 2008). Due to its distinctive meteorological circumstance, a prevalent nocturnal rainfall happens on the north slope of Mt. Qomolangma. Liu et al. (Citation2009) attributed the observed nighttime rainfall peak to the reversed daily alterations of convergence-divergence patterns in the vicinity of the plateau edges. This pattern is possibly associated with local thermally forced wind systems caused by the effects of the mountain ranges.
Surface albedo was lowest during the wet season due to the wet soil. The energy components changed seasonally and showed dramatic diurnal variations. Sensible heat flux and ground heat flux are the two main consumers of available energy in winter and spring. Soil moisture is one of the most important factors affecting the partitioning of available energy into sensible and latent heat fluxes between the ground surface and the atmosphere. It is found that the variation of the evaporative fraction over typical Tibetan bare soil is a function of soil moisture. A relationship between different soil moisture levels and normalized surface turbulent energy fluxes was also suggested by our observations.
A large area of permafrost and seasonally frozen soil is widely distributed on the 2.5 million km2 area of the Tibet Plateau (CitationYang et al., 2010). The Tibet Plateau is one of Earth's most sensitive areas to global change (CitationLiu and Chen, 2000). The Tibet Plateau currently trends towards warm and wet conditions (CitationLi et al., 2010; CitationZhong et al., 2011). The seasonally frozen soil and permafrost on the Tibet Plateau have already been impacted by global warming (CitationZhao et al., 2004; CitationYang et al., 2010). The thawing process will lead to dramatic changes in the soil's physical properties, i.e. soil water dynamics, which in turn exert a profound influence on the entire energy and water exchange (CitationTanaka et al., 2003). Matthew (Citation2010) estimated that the soil moisture anomalies over the Tibetan Plateau increased at the rate of 0.03 to 0.13% per year. According to our equation, between soil moisture and albedo over the Qomolangma region, a 0.08% anomaly of soil moisture will cause an albedo variation of 0.0008, in the case of 15% soil moisture. The annual shortwave radiation can be taken as 300 W/m2. The net radiation will have an anomaly of 0.24 W/m2. The value of H/Rn and LE/Rn at 15% soil moisture is about 0.21 and 0.47, respectively; Finally, shortwave radiation will cause sensible and latent heat flux anomalies of 0.05 and 0.11 W/m2 separately. Using Equations 1, 3, and 4, impacts of soil moisture anomalies δ(SM) on the surface energy partitioning (δ(LE) and δ(H)) can be connected by the following differential analysis: δ(SM) δ δ(albedo) → δ(net radiation) → δ(LE) and δ(H). Even though the soil moisture-net radiation feedback proposed by Eltahir (Citation1998) was not taken into account and the derived empirical formulas are limited to local scale, our results bridge the gap between increasing soil moisture and the partitioning of energy fluxes at the land surface into sensible and latent heat flux, thus helping us to understand the water cycles changes in terms of soil moisture's climatic effects. In the future, we need more comprehensive observational data set on the plateau to validate our result, which is still limited to the Qomolangma region.
This paper shows quantitative measurement of water and energy exchange between the north slope of Mt. Qomolangma and the middle tropospheric atmosphere over it. The knowledge of these quantities is necessary for studies of the climate change in this region. Both the unique representativeness of the north area of Mt. Qomolangma and the high quality of the measurements have meant that the data set at QOMS/CAS site will be used for verification of global climate and weather models at this region.
Acknowledgments
This paper was prepared under the auspices of the Chinese National Key Programme for Developing Basic Sciences (2010 CB951701), the National Natural Science Foundation of China (40825015 and 40810059006), and Knowledge Innovation Project of CAS (KZCX2-YW-QN309). Xuelong Chen is supported by the ‘CAS-KNAW Joint PhD Training Programme.’ The authors thank all members of QOMS/CAS for their great assistance in the field observation of this research. We thank anonymous reviewers for their insightful comments.
Related Research Data
References Cited
- Barros, A. P. , Kim, G. , Williams, E. , and Nesbitt, S. W. , 2004: Probing orographic controls in the Himalayas during the monsoon using satellite imagery. Natural Hazards Earth System Science , 4: 29–51.
- Bishop, B. C , Ångström, A. K. , Drummond, A. J. , and Roche, J. J. , 1966: Solar radiation measurements in the High Himalayas (Everest region). Journal of Applied Meteorology , 5: 94–104.
- Bollasina, M. , and Benedict, S. , 2004: The role of the Himalayas and the Tibetan Plateau within the Asian monsoon system. Bulletin of the American Meteorological Society , 85: 1001–1004.
- Boos, W. R. , and Kuang, Z. , 2010: Dominant control of the South Asian monsoon by orographic insulation versus plateau heating. Nature , 463: 218–222.
- Chen, H. , Yuan, W. , Li. J. , and Yu, R. , 2012: A possible cause for different diurnal variations of warm season rainfall as shown in station observations and TRMM 3B42 data over the southeastern Tibetan Plateau. Advances in Atmospheric Sciences , 29: 193–200.
- Chen, X. , Ma, Y. , Sun, F. , Li, M. , and Wang, S , 2007: The rainy season character of troposphere at Mt. Qomolangma region. Plateau Meteorology , 26: 1280–1286.
- Dirmeyer, P. A. , Zeng, F. J. , Ducharne, A. , Morrill, J. C. , and Koster, R. D. , 2000: The sensitivity of surface fluxes to soil water content in three land surface schemes. Journal of Hydrometeorology, 1: 121–134.
- Eltahir, E. A. B. , 1998: A Soil moisture-rainfall feedback mechanism: 1. Theory and observations. Water Resources Research , 34: 765–776.
- Foken, T. , 2008: Measuring technique. Chaptero in Micrometeorology. Berlin: Springer Press, 179–222.
- Fujinami, H. , Nomura, S. , and Yasunari, T , 2005: Characteristics of diurnal variations in convection and precipitation over the southern Tibetan Plateau during summer. SOLA , 1: 49–52.
- Gao, D. , 1981: Some heating effects of Mt Qomolangma (Everest) on the atmosphere. Bulletin of the American Meteorological Society, 62: 560–560.
- Gu, S. , Tang, Y. , Cui, X. , Kato, T. , Du, M. , Li, Y. , and Zhao, X , 2005: Energy exchange between the atmosphere and a meadow ecosystem on the Qinghai-Tibetan Plateau. Agricultural and Forest Meteorology , 129: 175–185.
- Guan, X. , Huang, J. , Guo, N. , Bi, J. , and Wang, G , 2009: Variability of soil moisture and its relationship with surface albedo and soil thermal parameters over the Loess Plateau. Advances in Atmospheric Sciences , 26: 692–700.
- Higuchi, K. , Ageta, Y. , Yasunari, T. , and Inoue, J. , 1982: Characteristics of precipitation during the monsoon season in high-mountain areas of the Nepal Himalaya. In Glen, J. W. (ed.), Hydrological Aspects of Alpine and High-Mountain Areas. IAHS Publication 138: 21–30.
- Hirschi, M. , Seneviratne, S. I. , Alexandrov, V. , Boberg, F. , Boroneant, C. , Christensen, O. B. , Formayer, H. , Orlowsky, B. , and Stepanek, P. , 2011: Observational evidence for soil-moisture impact on hot extremes in southeastern Europe. Nature GeoScience, 4: 17–21.
- Huang, W. , and Chan, J. C. L. , 2011: Maintenance mechanisms for the early-morning maximum summer rainfall over southeast China. Quarterly Journal of the Royal Meteorological Society , 137: 959–968.
- Jung, M. , Reichstein, M. , Ciais, P. , Seneviratne, S. I. , Sheffield, J. , Goulden, M. L. , Bonan, G. , Cescatti, A. , Chen, J. , de Jeu , R., Dolman , A. A. , Eugster, W. , Gerten, D. , Gianelle, D. , Gobron, N. , Heinke, J. , Kimball, J. , Law, B. E. , Montagnani, L. , Mu, Q. , Mueller, B. , Oleson, K. , Papale, D. , Richardson, A. D. , Roupsard, O. , Running, S. , Tomelleri, E. , Viovy, N. , Weber, U. , Williams, C. , Wood, E. , Zaehle, S. , and Zhang, K. , 2010: Recent decline in the global land evapotranspiration trend due to limited moisture supply. Nature , 467: 951–954.
- Li, L. , Yang, S. , Wang, Z. , Zhu, X. , and Tang, H. , 2010: Evidence of warming and wetting climate over the Qinghai-Tibet Plateau. Arctic, Antarctic, and Alpine Research , 42: 449–457.
- Li, M. , Ma, Y. , Ma, W. , Hu, Z. , Ishikawa, H. , Su, Z. , and Sun, F. , 2006: Analysis of turbulence characteristics over the northern Tibetan Plateau area. Advances in Atmospheric Sciences , 23: 579–585.
- Liu, L. , Feng, J. , Chu, R. , Zhou, Y. , and Ueno, K. , 2002: The diurnal variation of precipitation in monsoon season in the Tibetan Plateau. Advances in Atmospheric Sciences , 19: 365–378.
- Liu, X. , and Chen, B. , 2000: Climatic warming in the Tibetan Plateau during recent decades. International Journal of Climatology , 20: 1729–1742.
- Liu, X. , Bai, A. , and Liu, C. , 2009: Diurnal variations of summertime precipitation over the Tibetan Plateau in relation to orographicallyinduced regional circulations. Environmental Research Letters , 4: 045203, http://dx.doi.Org/10.1088/1748-9326/4/4/045203 .
- Ma, Y. , Fan, S. , Ishikawa, H. , Tsukamoto, O. , Yao, T. , Koike, T. , Zuo, H. , Hu, Z. , and Su, Z. , 2005: Diurnal and inter-monthly variation of land surface heat fluxes over the central Tibetan Plateau area. Theoretical and Applied Climatology , 80: 259–273.
- Ma, Y. , Wang, Y. , Wu, R. , Hu, Z. , Yang, K. , Li, M. , Ma, W. , Zhong, L. , Sun, F. , Chen, X. , Zhu, Z. , Wang, S. , and Ishikawa, H. , 2009: Recent advances on the study of atmosphere-land interaction observations on the Tibetan Plateau. Hydrological Earth System Sciences, 13: 1103–1111.
- Matthew, O. , 2010: Characterization of the effects of climate variation on land surface temperature and soil moisture through stochastic analysis of long term SSM/I observations over the Tibetan Plateau. Enschede, The Netherlands: International Institute for Geo-information Science and Earth Observation, University of Twente, 67 pp.
- Mauder, M. , and Foken, T. , 2004: Documentation and Instruction Manual of the Eddy Covariance Software Package TK2. Bayreuth: Arbeitser-Gebnisse.
- Moore, G. W. K. , and Semple, J. L. , 2004: High Himalayan meteorology: weather at the South Col of Mount Everest. Geophysical Research Letters , 31: L18109, http://dx.doi.org/10.1029/2004GL020621 .
- Nichols, W. E. , and Cuenca, R. H. , 1993: Evaluation of the evaporative fraction for parameterization of the surface energy balance. Water Resources Research , 29: 3681–3690.
- Singh, P. , and Nakamura, K. , 2009: Diurnal variation in summer precipitation over the central Tibetan Plateau. Journal of Geophysical Research , 114: D20107, 15 pp., http://dx.doi.org/10.1029/2009JD011788 .
- Song, Y. , Zhu, T. , Cai, X. , Lin, W. , and Kang, L. , 2007: Glacier winds in the Rongbuk Valley, north of Mount Everest: 1. Meteorological modeling with remote sensing data. Journal of Geophysical Research , 112: D11101, http://dx.doi.org/10.1029/2006JD007867 .
- Sun, F. , Ma, Y. , Li, M. , Ma, W. , Tian, H. , and Metzger, S. , 2007: Boundary layer effects above a Himalayan valley near Mount Everest. Geophysical Research Letters, 34: http://dx.doi.org/10.1029/ 2007GL029484 .
- Tanaka, K. , Ishikawa, H. , Hayashi, T. , Tamagawa, L. , and Ma, Y. , 2001: Surface energy budget at Amdo on the Tibetan Plateau using GAME/ Tibet IOP98 data. Journal of the Meteorological Society of Japan , 79: 505–517.
- Tanaka, K. , Tamagawa, I. , Ishikawa, H. , Ma, Y. , and Hu, Z. , 2003: Surface energy budget and closure of the eastern Tibetan Plateau during the GAME-Tibet IOP 1998. Journal of Hydrology , 283: 169–183.
- Ueno, K. , Toyotsu, K. , Bertolani, L. , and Tartari, G. , 2008: Stepwise onset of monsoon weather observed in the Nepal Himalaya. Monthly Weather Review , 136: 2507–2522.
- Ueno, K. , Takano, S. , and Kusaka, H. , 2009: Nighttime precipitation induced by a synoptic-scale convergence in the central Tibetan Plateau. Journal of the Meteorological Society of Japan , 87: 459–472.
- Wang, K. , Wang, P. , Liu, J. , Sparrow, M. , Haginoya, S. , and Zhou, X. , 2005: Variation of surface albedo and soil thermal parameters with soil moisture content at a semi-desert site on the western Tibetan Plateau. Boundary-Layer Meteorology , 116: 117–129.
- Xie, A. , Ren, J. , Qin, X. , and Kang, S. , 2008: Pressure and temperature feasibility of NCEP/NCAR reanalysis data at Mt. Everest. Journal of Mountain Science , 5: 32–37.
- Yang, M. , Yao, T. , Gou, X. , and Wang, H. , 2008: Precipitation distribution along the Qinghai-Xizang (Tibetan) Highway, summer 1998. Arctic, Antarctic, and Alpine Research , 40: 761–769.
- Yang, M. , Nelson, F. E. , Shiklomanov, N. I. , Guo, D. , and Wan, G. , 2010: Permafrost degradation and its environmental effects on the Tibetan Plateau: a review of recent research. Earth-Science Reviews, 103: 31–44.
- Yang, X. , Zhang, T. , Qin, D. , Kang, S. , and Qin, X. , 2011: Characteristics and changes in air temperature and glacier's response on the north slope of Mt. Qomolangma (Mt. Everest). Arctic, Antarctic, and Alpine Research , 43: 147–160.
- Yao, J. , Zhao, L. , Gu, L. , Qiao, Y. , and Jiao, K. , 2011: The surface energy budget in the permafrost region of the Tibetan Plateau. Atmospheric Research , 102: 394–407.
- Ye, D. , and Gao, Y. , 1979: The Meteorology of the Qinghai-1 Xizang (Tibet) Plateau. Beijing: Science Press (in Chinese).
- Zhao, L. , Ping, C.-L. , Yang, D. , Cheng, G. , Ding, Y. , and Liu, S. , 2004: Changes of climate and seasonally frozen ground over the past 30 years in Qinghai-Xizang (Tibetan) Plateau, China. Global and Planetary Change, 43: 19–31.
- Zhong, L. , Ma, Y. , Su, Z. , Lu, L. , Ma, W. , and Lu, Y. , 2009: Landatmosphere energy transfer and surface boundary layer characteristics in the Rongbu Valley on the northern slope of Mt. Everest. Arctic, Antarctic, and Alpine Research, 41: 396–405.
- Zhong, L. , Su, Z. , Ma, Y. , Salama, M. S. , and Sobrino, J. A. , 2011: Accelerated changes of environmental conditions on the Tibetan Plateau caused by climate change. Journal of Climate , 24: 6540–6550.
- Zhou, L. , Zou, H. , Ma, S. , and Li, P. , 2008: Study on impact of the South Asian summer monsoon on the do wn-valley wind on the northern slope of Mt. Everest. Geophysical Research Letters , 35: L14811, http://dx.doi.org/10.1029/2008GL034151 .
- Zou, H. , Zhou, L. , Ma, S. , Li, P. , Wang, W. , Li, A. , Jia, J. , and Gao, D. , 2008: Local wind system in the Rongbuk Valley on the northern slope of Mt. Everest. Geophysical Research Letters , 35: L13813, http://dx.doi.org/10.1029/2008GL033466.
- Zou, H. , Ma, S. , Zhou, L. , Li, P. , and Li, A. , 2009: Measured turbulent heat transfer on the northern slope of Mt. Everest and its relation to the South Asian summer monsoon. Geophysical Research Letters, 36: http://dx.doi.org/10.1029/2008GL036984 .