Abstract
Sulfate and nitrate records from 5 ice cores spread across Svalbard were compared and revealed strong temporal similarities with previously published global estimates of SO2 and NOx anthropogenic emissions during the 20th century. A significant departure from the early century sulfate and nitrate levels was evident at all drilling sites starting from the mid-1940s. A steady increase was observed in both sulfate and nitrate profiles at most sites until the late 1960s, when the annual concentrations started to increase at a higher rate. This peak activity lasted for about a decade, and was observed to decrease steadily from the early 1980s on, when sulfate levels declined significantly and when nitrate levels finally reached sulfate levels for the first time in 20th century. The timing of these trends in Svalbard with global SO2 and NOx concentration profiles was best appraised when considering composite concentration profiles of all Svalbard ice cores for sulfate and nitrate, respectively. Composite profiles were also found to provide a convenient mean for distinguishing between the most important world source regions. Based on correlation analysis, the major pollutant sources appeared to be Western Europe and North America for both sulfate and nitrate, followed by Central Europe and former U.S.S.R. in generally similar proportions.
Introduction
Trace elements enclosed in ice cores from glaciers and ice sheets provide invaluable records of past climate conditions and have significantly contributed to a better understanding of the global environment (CitationAnklin et al., 1997; CitationStauffer et al., 2004). In particular, nitrogen and sulfur compounds have been used, in conjunction or separately, as indicators of e.g. biomass production, boreal fires, volcanic eruptivity, or anthropogenic activity (CitationLegrand, 1997; CitationLiss et al., 1997; CitationIsaksson et al., 2001; CitationAMAP, 2006; CitationMoore et al., 2006). The kinetics of reactions involving reactive nitrogen (NOx = NO + NO2) and sulfur oxides (SOx = mainly consisting of SO2) are intimately coupled and have been shown to have contributed to the buildup of excess acids (acidification) in soils, waters, and the atmosphere, at least in the course of 20th century (CitationHagen and Langeland, 1973; CitationReuss et al., 1987). Studying the dynamics and evolution of sulfur and nitrogen reactions is therefore paramount in tropospheric photochemistry and, as discussed below, this particularly applies in the Arctic.
Sulfur and nitrogen species have known at least a twofold increase since the 1940s at all studied Arctic sites, which has been mostly ascribed to the accrued rise in fossil fuel combustion and related residuals in the troposphere since then (CitationLaj et al., 1992; CitationGoto-Azuma and Koerner, 2001;). As the dominant by-products Of NOx and SOx recorded in ice cores are nitric acid (HNO3) and sulfuric acid (H2SO4), nitrate (NO3 -) and sulfate (SO4 2-) concentrations measured in polar ice cores have been recognized as useful proxies to examine the past variability of their atmospheric counterparts (CitationBarrie, 1986; CitationLegrand, 1997; CitationGoto-Azumaand Koerner, 2001). Gaseous SOx and NOx oxidize in the atmosphere forming H2SO4 and HNO3, respectively, which in turn readily condense onto pre-existing airborne particles or react with other compounds to form new particles. Authors have shown that the timing and intensity of acid anion variations differ from site to site in polar regions and depend mostly on the source and intensity of emissions and on site elevation (CitationFischer et al., 1998; CitationGoto-Azuma and Koerner, 2001; CitationRöthlisberger et al., 2002). In this regard, Svalbard archipelago has received increasing interest from environmental scientists these two last decades as it is located at the crossroads of major oceanic and atmospheric currents from the Arctic (CitationPerkin and Lewis, 1984; CitationRossby, 1996). Also, despite its remoteness from major anthropogenic polluting sources as compared to most Arctic glaciated areas, Svalbard is affected by long-range transport of contaminants from industrial areas (CitationAMAP, 2006), most of this transport occurring during winter months owing to the prevalence of stable, cold, and less reactive air masses in the Arctic during that season. Eastern and Western Europe and North America have previously been identified as the most important source regions for Svalbard, but spatial variability of timing and extent of pollution have not been fully investigated yet. Relying on improved dating models, we examine the trends in sulfate and nitrate records from 5 ice cores drilled at various sites in Svalbard and spanning at least the 20th century. The aims of this study are twofold: first, to evaluate the temporal and spatial evolutions of nitrate and sulfate in Svalbard during that time, and, second, to investigate the relationships of these evolutions with known historical anthropogenic trends.
Study Area
Between the late 1980s and the late 1990s, several ice cores extending from a few tenths to a few hundreds of meters were drilled in Svalbard by the Japanese Glaciological Programme (CitationMotoyama et al., 2008) in collaboration with the Norwegian Polar Institute in Norway (). We report here on the four deepest of these ice cores, drilled at Snøfjellafonna, Asgårdfonna, Vestfonna, and Austfonna ice caps in 1992, 1993, 1995, and 1999, respectively. We also report on the Lomonosovfonna ice core, drilled in 1997 as a collaboration between the British Antarctic Survey, the Norwegian Polar Institute, and the Universities of Lapland, Uppsala, and Utrecht (CitationIsaksson et al., 2001) (). As summarized in , these drilling sites differ mostly in altitude, surface temperature, and geographical position, and span the upper northern half of the Svalbard archipelago. These characteristics and the varying influences from the surrounding oceanic and atmospheric currents confer specific glaciological settings to these sites, thereby providing an excellent opportunity to investigate and compare local and global interactions between the atmosphere, the oceans, and the cryosphere. This variety of glaciological settings also provides the opportunity to test the representativity of single ice cores against an assemblage of them.
FIGURE 1. Location map of the Svalbard drilling sites (400 m isolines). White patches represent snow/ice-covered areas.
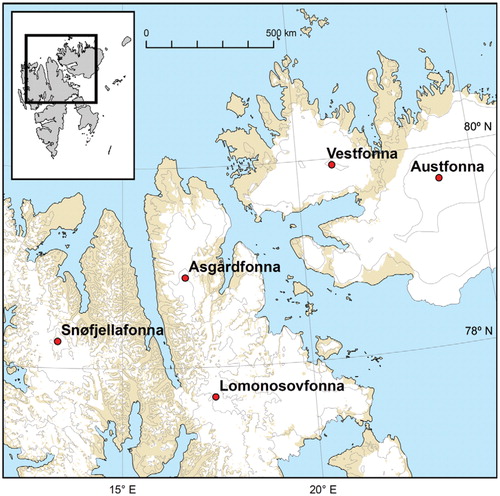
TABLE 1 Drilling site and ice core characteristics in the studied Svalbard regions.
Data and Methods
The variables measured in common between each site are Na+, K+, Ca2+, Mg2+, NO3-, Cl-, and SO4 2-, with the exception of Snøfjellafonna where only Na+, Cl-, NO3 -, and SO4 2- were measured. Water-soluble ions from the ice cores drilled by the Japanese team were all measured by ion chromatography (Dionex 500x) after meltwater pre-filtering (0.45 µm pore size). The estimated errors are lower than 5% for each ion and detection limits are inferior to 0.05 µmol.L-1. Tritium markers were measured by liquid scintillation counting (Aloka LSC-LB1). The cleaning, cutting, and sampling procedures as well as the columns and eluants used have been described in more detail in Goto-Azuma et al. (Citation1995), Watanabe et al. (Citation1997), Matoba et al. (Citation2002), and Iizuka et al. (Citation2002). The ion Chromatograph used for the Lomonosovfonna ice core consisted of a Waters 600e gradient pump, a Waters 431 conductivity detector, and a Waters 715 ultra-wisp sample processor (injector, autosampler). More details on the sampling and analytical methods for this core can be found in Jauhiainen et al. (Citation1999) and Isaksson et al. (Citation2001).
Dating of the ice cores was based on Nye's uniform vertical strain rate model (CitationNye, 1957). Radiation peaks in 137Cs (CitationPinglot et al., 1999) and in 3H (CitationMotoyama et al., 2008) resulting from nuclear testing during the 1960s, and known volcanic events (e.g. Mount St. Helens, 1980; Bezymianny, 1956; Katmai, 1912), were used as reference tie-points. Mean accumulation rates were reconstructed from the obtained chronology ().
Since our interest in this study lies primarily in atmospheric events, first, linked to anthropogenic sulfur and nitrogen activities and, second, likely to have been recorded in the snow pack (such as snowfalls or ‘Arctic haze’ events), other events that can lead to sulfur or nitrogen records without being linked to anthropogenic activity (such as major volcanic eruptions) should be discarded from our data. In Arctic regions, snow falls and ‘Arctic haze’ events happen on a daily and monthly frequency, respectively, whereas major volcanic eruptions happen on a yearly to decadal basis. In order to minimize the influence of events potentially occurring on a more than a yearly basis, we identified outliers in our chemical data as values differing by thrice the standard deviation (3σ) or more from the mean. Indeed, for a daily process, the proportion of values expected to lie outside this 3σ confidence interval is about 1/370, which corresponds to a yearly frequency. Our data sets were then averaged by year so that the effect of random events occurring at the year scale, such as e.g. volcanic eruptions, was further reduced. As will be seen further, this kind of yearly low-pass filter appeared to be the most reasonable for our purpose, given the intermediary resolution of the studied ice cores (see —the mean resolutions are given prior to yearly data binning). It should be mentioned that although δ18O data were available in the original data sets from each site, this variable was discarded from our analysis given the poor information that could be brought owing to its generally low to moderate sampling resolution (except at Lomonosovfonna, where this proxy can be considered as highly reliable).
Results and Discussion
POST-DEPOSITIONAL PROCESSES
Various authors have addressed some concern about the existence of post-depositional processes that may alter the ionic composition of Arctic surface snow, and thereafter of sampled firn and ice (e.g. CitationKoerner, 1997). These processes generally lead to eluted or truncated concentration profiles measured from ice cores, except at levels where specific compounds may get highly concentrated (e.g. in regelation layers). Both sulfate and nitrate species can be affected at or near the surface by downward relocation of species as a result of summer surface melting (e.g. CitationClausen and Langway, 1989; CitationGoto-Azuma et al., 1997), which has been reported to potentially disturb chemical stratigraphy up to a 3–5 year scale maximum in the Arctic (CitationIizuka et al., 2002; CitationMoore and Grinsted, 2009). Nitrate can in addition be specifically affected by photochemical reactions and revolatilization (e.g. CitationRöthlisberger et al., 2002), which has the effect to noticeably reduce normal concentrations, especially at sites with very low snow accumulation rates (<0.035 m w.eq.). However, two facts allowed us to lower our concerns about the altering effects of post-depositional processes on sulfate and nitrate concentrations in our study. First, having removed concentration values larger than 3σ from our data set and having then binned concentrations by year, should act as a low-pass filter on the data, thereby significantly reducing the potential impact of ion percolation and localized regelation on recorded data. Second, snow accumulation rates are significantly higher at our study sites (about an order of magnitude in general) than where major disturbances have been reported (e.g. CitationRöthlisberger et al., 2002), which should significantly hamper nitrate losses resulting from photolysis and revolatilization in surface snow.
NITRATE AND SULFATE TRENDS DURING 20TH CENTURY
Accounts Of NO3 - and SO4 2- temporal trends from Svalbard ice cores are very sparse, most related studies having focused on direct measurements of airborne pollutants (e.g. NILU programme at Ny-Ålesund [CitationAMAP, 2006]). To our knowledge, the most comprehensive accounts are from Goto-Azuma et al. (Citation1995) at Snøfjellafonna, Kekonen et al. (Citation2005) and Moore et al. (Citation2006) at Lomonosovfonna, and Matoba et al. (Citation2002) at Vestfonna. At Snøfjellafonna, both sulfate and nitrate records were shown to initiate a sharp inflexion around 1950, then a considerable increase (by a factor of 3 to 4 compared to early-century levels) in the late 1960s, and finally a significant decline after the late 1970s. At Lomonosovfonna, the reported sulfate and nitrate levels showed a slight increase from 1900 levels during the 1920s and 1930s and then a sharp rise in the 1950s. Maxima were reached in the mid-1970s, with concentrations several times larger than in the early century. Concentrations then dropped rapidly back to early century levels between the mid-1980s and the late 1990s. At Vestfonna, Matoba and colleagues have observed a significant increase in sulfate concentrations after 1945, with a maximum around 1975, immediately followed by a clear decline throughout the next decades. Nitrate concentrations showed a significant rise from 1950 (i.e. slightly later than observed for sulfate) up to 1970 (i.e. slightly earlier than the sulfate peak) and then a continued decline from the early 1970s. Both sulfate and nitrate peak concentrations at Vestfonna were reported to be 4 to 5 times higher than pre-1900 levels.
A re-analysis of the data set from Motoyama et al. (Citation2008) allowed us to determine several new temporal markers based on a combined recognition of pH, conductivity, and nss-SO4 2- peaks. Our reconsideration of sulfate and nitrate trends based on this improved dating procedure generally confirmed the trends summed up above. We complement this piece of information with the following. At Austfonna, we observed a several-fold increase in both sulfate and nitrate from the late 1940s to the late 1960s, followed by a clear decline since then (). As for the Asgårdfonna core, we noticed low, comparable concentrations of both sulfate and nitrate species during the first half of the century, with pronounced increases and more abrupt shifts from the mid-1970s (). It is only between the late 1970s and the late 1980s that Asgårdfonna levels became comparable to those observed at other sites.
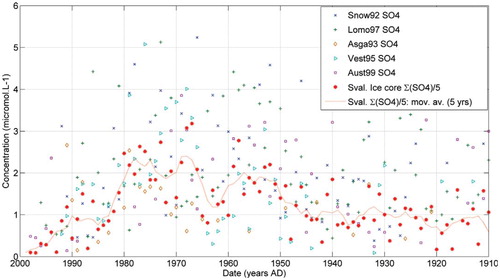
FIGURE 2. Sulfate (in red) and nitrate (in blue) annually averaged concentrations at Snøfjellafonna, Vestfonna, Lomonosovfonna, Austfonna, and Asgårdfonna sites in Svalbard. Snow92, Asga93, Lomo97, Vest95, and Aust99 refer to the Snøfjellafonna Asgårdfonna, Vestfonna, Lomonosovfonna, and Austfonna ice caps drilled in 1992, 1993, 1995, 1997, and 1999, respectively.
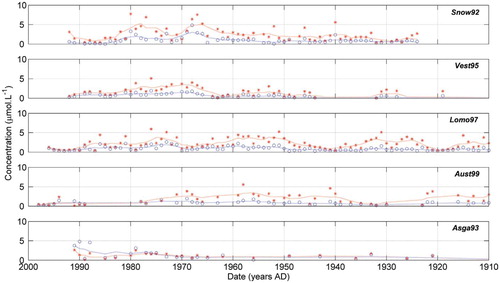
Thus, summarizing the general trends, the rise of sulfate and nitrate concentrations has become clearly visible in Svalbard after the Second World War (WWII) at all studied sites. Although the sulfate and nitrate general trends were found to be spatially consistent throughout Svalbard, some site-specific patterns could be distinguished. Insights will be gained in the next section by comparing sulfate and nitrate trends recorded in ice cores with emission estimates listed for Europe, North America, former U.S.S.R., and other regions of the world.
COMPARISON WITH EMISSION ESTIMATES
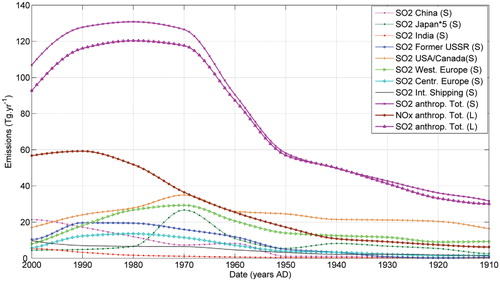
Various sets of emission estimates and scenarios have been produced for specific aerosols and other airborne contaminants in the last decades (for references on NOx and SOx, see e.g. CitationGalloway, 1989; CitationMylona, 1996; CitationBan-Weiss et al., 2008; CitationLamarque et al., 2010; CitationSmith et al., 2010). Despite being associated by nature with uncertainties, which mostly relate to the amount of primary resources consumed by a given sector of activity, to the emission factors, and to the level of abatement technologies adopted through time, continual refinement of these projections has led to the production of now invaluable tools for intercomparing environmental records in the perspective of historical anthropogenic activity. Governmental enforcements to reduce and report emissions, as well as imple- mentation of advanced technologies from most industrialized countries over recent decades, have been decisive factors in improving and ensuring a certain degree of reliability to these projections. The evolution of total anthropogenic SO2 and NOx emissions estimated during the 20th century () mostly reflects the combined evolution of petroleum combustion, coal combustion, and metal smelting activities (CitationLamarque et al., 2010; CitationSmith et al., 2010), although agricultural practices can also contribute significantly to NOx emissions (e.g. through the introduction of ammonia to soil through fertilizers [CitationGalloway et al., 2003]). Global SO2 emission trends showed a steady increase from the beginning of the century until the early 1950s, when a sharp rise occurred up to the late 1960s (CitationSmith et al., 2010). This rise can clearly be associated with the rapid economic growth and related spurt in industrialization and use of automobiles in North America and Eurasia during postWWII years. A plateau in the SO2 emission profile was then observed until the early 1990s, when emissions began to decline significantly until the end of the century. According to Smith et al. (Citation2010) and Lamarque et al. (Citation2010) data, this SO2 decline can be ascribed to the notable reduction of petroleum and coal combustion observed in industrialized countries since the late 1970s, resulting in part from the enforcement of stricter environmental policies regarding fossil fuel combustion. This enforcement led to decreased sulfate emissions in Western Europe and North America after the 1970s (CitationSmith et al., 2010). The NOx emission profile slightly differs from that of SO2 in that, first, the post-WWII increase was steadier, and, second, the plateau value is reached about 20 years later (i.e. in the early 1990s).
Sulfate and nitrate atmospheric trends after WWII have been recognized as being intimately linked to anthropogenic activity in terms of emission sources, temporal variability, and transport patterns (e.g. CitationGschwandtner et al., 1986; CitationGalloway, 1989). North America and Eurasia have commonly been considered as the most likely source regions of sulfate and nitrate aerosols for Svalbard (e.g. CitationBarrie, 1986; CitationGoto-Azuma and Koerner, 2001; CitationAMAP, 2006). A clearer assessment of the relative importance of Eurasian versus North American emissions in producing the reported sulfate and nitrate trends in our study was not directly possible from the available single profiles. Indeed, an overall correlation diagram between single Svalbard data and global emission data sorted by regions () shows generally poor relationships. One reason for the latter lies in the fact that single concentration profiles for a given species across Svalbard have themselves poor correlations between one another over the 20th century (). For example, although correlation coefficients (R) between annual SO4 2- and NO3 - profiles at each site are relatively high (0.72 to 0.90), correlation is poor to moderate amongst the various Svalbard SO4 2- profiles (R ranges from 0.17 to 0.42) and amongst the NO3 - profiles (R ranges from 0.02 to 0.47). This suggests that, despite sulfate and nitrate relationships at specific sites being quite reliable, comparing individual sulfate and nitrate profiles from site to site is not always appropriate as a result of geographical variations.
FIGURE 3. Annual emission estimates of SO2 and NOx from the principal contributing regions of the world (Tg.yr-1). S and L stand for data from Smith et al. (Citation2010) and Lamarque et al. (Citation2010), respectively. Note that the Japanese emissions are multiplied by 5 for better visualization.
A COMPOSITE SVALBARD ICE CORE RECORD
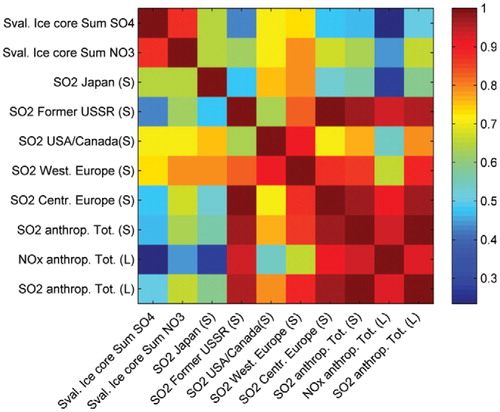
The possibility of assessing the relative contributions of Eurasian regions and North America to Svalbard sulfate and nitrate trends improved significantly when normalizing, summing, and scaling by the number of sites all Svalbard concentration profiles for sulfate and nitrate, respectively ( and ). The idea behind this was to produce a composite concentration signal from multiple local sources of input across Svalbard and, in doing so, to level out spatial variations linked to changes in source, timing, and intensity of emissions and to changes in altitude at studied sites. This averaging procedure also had the effect of smoothing biases due, on one hand, to the lack of annual data in some ice cores, and on the other, to the presence of potential summer melt layers that would not have been suitably filtered in the data. As an example of improvement, it can be seen from the general correlation diagram in that correlations of emissions from various regions of the world with the composite SO42- and NO3 - profiles are significantly higher than with single profiles. The same trend can be seen in , where the sums of annually averaged sulfate and nitrate concentrations from Svalbard have been plotted together with SO2 and NOx global emission estimates. Interestingly, our correlation study suggests a more diverse source region pattern than that previously assumed for both sulfate and nitrate Svalbard concentration profiles, in which for instance Eurasia and Western Europe were recognized as the main contributors at Snøfjellafonna and Lomonosovfonna, respectively (CitationGoto-Azuma and Koerner, 2001; CitationMoore et al., 2006). The summed Svalbard SO42 - profile shows best correlations () for the century equally with the Western European (R = 0.73) and North American (R = 0.71) SO2 profiles. The next significant best fit is with the Japanese SO2 profile (R = 0.65). Correlation with the Central European and former U.S.S.R. profiles is less strong, but still significant (R = 0.48 and 0.43, respectively). On the other hand, the summed Svalbard NO3 - () profile best correlates with the Western European SO2 profile (R = 0.79). The next best fits are comparable between the North American (R = 0.70), the Central European (R = 0.67), the Japanese (R = 0.65), and the former U.S.S.R. (R = 0.62) SO2 profiles. The Svalbard SO42- and NO3 - composite profiles are thus clearly mostly correlated with the Western European and North American SO2 and NOx emissions trends (), which suggests that these source regions are the most important for both types of anthropogenic pollutants. Notwithstanding the effect that volume of emissions can have on Svalbard SO2 and NOx budgets, this strong influence of Western European and North American regions possibly also has a great deal of bearing upon the bipartite air mass configuration over the archipelago. Svalbard air mass circulation is mostly controlled on one hand by the Icelandic low and on the other hand by the generally high pressure system over Greenland and the Arctic Ocean, which translates during winter season into air masses and associated increased cyclonic activity being favorably transported from mid-latitudes towards Svalbard (CitationEneroth et al., 2003; CitationFørland et al., 2002). This, together with the fact that anthropogenic sulfur and reactive nitrogen are more prone to be preserved in air masses and transported over long distances during winter months, leads to the assumption that Western Europe and North America may have contributed to Svalbard industrial pollution not only as a result of being major emission sources, but also because they lie along the main air mass trajectory of the lowpressure system from the southwest. Correlation trends also suggest that Central Europe and former U.S.S.R. are influential source regions for NO3 - recorded in ice cores (although it is not particularly the case for SO42-). Combined with the intensity of emissions from these regions, this influence could also be related in terms of transport pattern to the second important weather regime over Svalbard which is dominated by the intense northeasterly to easterly polar winds originating from the Barents Sea and the Siberian coasts (CitationSkeie and Grønaås, 2000). On other accounts, the fact that Svalbard ice core SO4 2-and NO3 - profiles are significantly correlated with the Japanese SO2 emission trends should be interpreted as denoting similar industrialization dynamics between Japan and Western countries (note e.g. the concomitant activity peaks between the late 1960s and early 1970s in ) rather than reflecting directly related source and transport patterns, given the large distance and difference in climate dynamics between both regions.
FIGURE 4. Pearson's correlations (significant at the 95% level) amongst the various source regions and Svalbard ice core concentrations (data years: 1910 to 1990). S and L stand for data from Smith et al. (Citation2010) and Lamarque et al. (Citation2010), respectively. Snow92, Asga93, Vest95, Lomo97, and Aust99 refer to the Snøfjellafonna, Asgårdfonna, Vestfonna, Lomonosovfonna, and Austfonna ice caps drilled in 1992, 1993, 1995, 1997, and 1999, respectively.
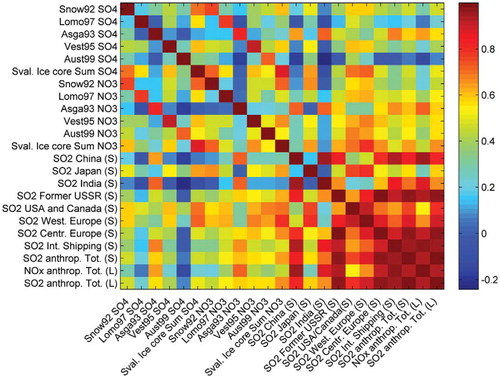
FIGURE 5. Pearson's correlations (significant at the 95% level) amongst sulfate and nitrate ice core concentrations from Svalbard (data years: 1910 to 1990).
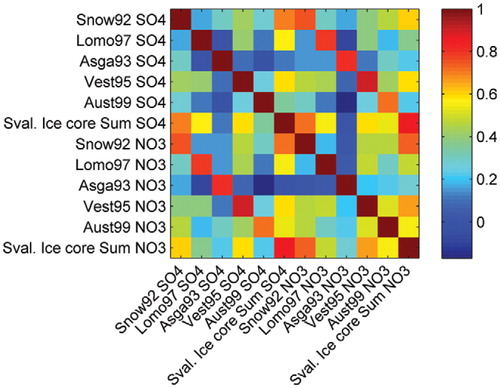
FIGURE 6. 20th century sulfate filtered, annually averaged composite profiles from 5 Svalbard sites.
In the light of the above, it thus seems clear that the main global industrialization phases throughout the 20th century were recorded in Svalbard ice cores. These global phases involve, first, prominent anthropogenic sulfate emissions from Western countries after WWII, which then showed a significant decline after the 1970s (most probably linked to the reduced SO2 emissions from the industry). Second, a significant peak in nitrate emissions was observed at the end of the 1980s while sulfate emissions had already started to decline, implying that this boost in nitrate might be related to other sources than those at the origin of SO2 emissions (and possibly linked to the considerable use during the last decades either of nitrogen-based fertilizers [CitationGalloway et al., 2003] or of diesel engine automobiles [CitationBan-Weiss et al., 2008] in North America and Eurasia). The difference in residence and oxidation times in the atmosphere for sulfur and reactive nitrogen compounds might also potentially contribute this trend. Reactive nitrogen emission data throughout the 20th century as detailed as those available for SO2 will certainly help resolving these issues in more detail in the future. One should note that atmospheric transport modeling, which is mostly based on reanalysis of meteorological data (e.g. ERA-40) and on results from air quality models (e.g. EMEP), is also likely to help identifying transport patterns and potential sources of anthropogenic atmospheric constituents. However, such data for Svalbard were available at the time of this study only for the last few decades and had variable spatial resolution through time, meaning that they lack proper accuracy for the time period discussed here. Reinvestigating previously taken ice cores or drilling new ones across Svalbard, and (re-)sampling them at sub-annual resolution (as was done e.g. in the Lomonosovfonna ice core), should therefore remain instrumental in apportioning pollution sources to the Arctic and for building new emission estimates.
FIGURE 7. 20th century nitrate filtered, annually averaged composite profiles from 5 Svalbard sites.
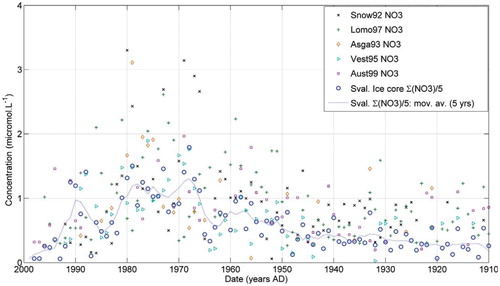
FIGURE 8. Annual emission estimates of SO2 and NOx from the principal contributing regions of the world (Tg.yr-1), compared to the composite profiles of sulfate and nitrate ice core concentrations (μmol.L-1). S and L stand for data from Smith et al. (Citation2010) and Lamarque et al. (Citation2010), respectively. Note that the Japanese emission profile is multiplied by 5 for better visualization.
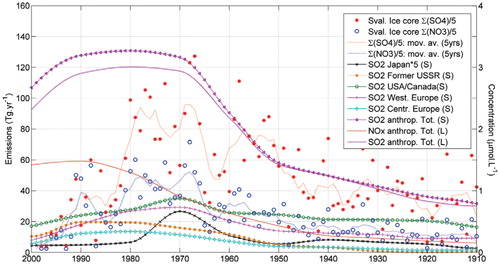
FIGURE 9. Pearson's correlation diagram (significant at the 95% level) amongst the most important source regions and composite ice core concentration profiles from Svalbard (data years: 1910 to 1990). S and L stand for data from Smith et al. (Citation2010) and Lamarque et al. (Citation2010), respectively.
Conclusion
The nature and trends of sulfate and nitrate anthropogenic emissions in 20th century were investigated from the analysis of 5 Svalbard ice cores drilled between 1992 and 1999. Given the poor amount of data available from this remote region of the Arctic, these ice cores provide invaluable archives on local sulfate and nitrate emission trends. Composite profiles produced for sulfate and nitrate, respectively, were shown to provide a better representation of global Svalbard concentration trends during 20th century than single profiles, as the influence of stochastic variations and sometimes poor ice core sampling resolution was reduced. This allowed the signal to noise ratio in composite profiles to be increased, long-term variations to be revealed, and a broad regional pattern to emerge. No overall trend was observed in either sulfate or nitrate concentrations from the turn of the 20th century to the early 1940s. The situation changed, first, when a steady increase in both compounds started after WWII and, second, when this increase set off in the late 1960s. An overall decline in concentrations was then documented from the end of the 1970s. Based on correlation analysis with published SO2 and NOx estimates from different parts of the world, Western Europe and North America were recognized as a whole as the most important contributors for both sulfate and nitrate deposition in Svalbard. Central Europe and former U.S.S.R. were nevertheless recognized as potentially equally important source regions for the recorded nitrate. Intercomparing Svalbard trends with trends from other Arctic drill sites is important, and the extent to which our method can be applied to these other sites requires testing.
Acknowledgments
We thank E. Isaksson at NPI (Norwegian Polar Institute, Tromsö); J. Moore and R. van de Wal at the Universities of Lapland and Utrecht, respectively; and Robert Mulvaney at British Antarctic Survey for the Lomonosovfonna data. R. Pettersson at LUVAL (Department of Earth Sciences, Uppsala University, Sweden) is also thanked for producing the Svalbard map. Comments from two anonymous reviewers contributed to the improvement of this manuscript. D.S. and C.V. acknowledge support from a Marie Curie Intra-European award, coordinated through the interdisciplinary NSINK (Sources, sinks and impacts of atmospheric nitrogen deposition in the Arctic) project. D.S. is currently funded by a JSPS Postdoctoral Fellowship (Japanese Society for the Promotion of Science).
References Cited
- AMAP, 2006: AMAP Assessment 2006: Acidifying pollutants, arctic haze, and acidification in the Arctic. Oslo, Norway: Arctic Monitoring and Assessment Programme, 112 pp.
- Anklin, M. , Schwander, J. , Stauffer, B. , Tschumi, J. , and Fuchs, A. , 1997: CO2 record between 40 and 8 kyr B. P. from the Greenland Ice Core Project ice core. Journal of Geophysical Research , 102(C12): 26539–26545.
- Ban-Weiss, G. A. , McLaughlin, J. P. , Harley, R. A. , Lunden, M. M. , Kirchstetter, T. W. , Kean, A. J. , Strawa, A. W. , Stevenson, E. D. , and Kendall, G. R. , 2008: Long-term changes in emissions of nitrogen oxides and particulate matter from on-road gasoline and diesel vehicles. Atmospheric Environment, 42(2): 220–232.
- Barrie, L. A. , 1986: Arctic air pollution: an overview of current knowledge. Atmospheric Environment, 20(4): 643–663.
- Clausen, H. B. , and Langway, C. C., Jr. , 1989: The ionic deposits in polar ice cores. In Oeschger, H. , and Langway, C. C., Jr. (eds.), The Environmental Record in Glaciers and Ice Sheets. Chichester: John Wiley and Sons, 225–247.
- De Angelis, M. , Steffensen, J. P. , Legrand, M. R , Clausen, H. B. , and Hammer, C. U. , 1997: Primary aerosol (sea salt and soil dust) deposited in Greenland ice during the last climatic cycle: Comparison with east Antarctic records. Journal of Geophysical Research, 102: 26681–26698.
- Eneroth, K. , Kjellstrom, E. , and Holmen, K. , 2003: A trajectory climatology for Svalbard; investigating how atmospheric flow patterns influence observed tracer concentrations. Physics and Chemistry of the Earth, 28: 1191–1203.
- Fischer, H. , Wagenbach, P. , and Kipfstuhl, J. , 1998: Sulfate and nitrate firn concentrations on the Greenland ice sheet: 1. Large-scale geographical deposition changes. Journal of Geophysical Research, 103: 21927–21934.
- Førland, E. J. , Hanssen-Bauer, I. , Jónsson, T. , Kern-Hansen, C. , Nordli, P.Ø. , Tveito, O. E. , and Vaarby Laursen, E. , 2002: Twentieth century variations in temperature and precipitation in the Nordic Arctic. Polar Record, 38: 203–210.
- Galloway, J. N. , 1989: Atmospheric acidification: projection for the future. Ambio, 18: 161–166.
- Galloway, J. N. , Aber, J. D. , Erisman, J. W. , Seitzinger, S. P. , Howarth, R. W. , Cowling, E. B. , and Cosby, B. J. , 2003: The nitrogen cascade. Bioscience, 53: 341–356.
- Goto-Azuma, K. , Kohshima, S. , Kameda, T. , Takahashi, S. , Watanabe, O. , Fujii, Y. , and Ove Hagen, J. , 1995: An ice-core chemistry record from Snøfjellafonna, northwestern Spitsbergen. Annals of Glaciology, 21: 213–218.
- Goto-Azuma, K. , Koerner, R. M. , Nakawo, M. , and Kudo, A. , 1997: Snow chemistry of Agassiz Ice Cap, Ellesmere Island, Northwest Territories, Canada. Journal of Glaciology, 43(144): 199–206.
- Goto-Azuma, K. , and Koerner, R. M. , 2001: Ice core studies of anthropogenic sulphate and nitrate trends in the Arctic. Journal of Geophysical Research , 106(D5): 4959–4969.
- Gschwandtner, G. , Gschwandtner, K. , Eldridge, K. , Mann, C. , and Mobley, D. , 1986: Historic emissions of sulphur and nitrogen oxides in the United States from 1900 to 1980. Journal of Air Pollution Control Association, 36: 139–149.
- Hagen, A. , and Langeland, A. , 1973: Polluted snow in southern Norway and the effect of the meltwater on freshwater and aquatic organisms. Environmental Pollution, 5: 45–57.
- Iizuka, Y. , Igarashi, M. , Kamiyama, K. , Motoyama, H. , and Watanabe, O. , 2002: Ratios of Mg2+ /Na+ in snowpack and an ice core at Austfonna ice cap, Svalbard, as an indicator of seasonal melting. Journal of Glaciology, 48(162): 452–460.
- Isaksson, E. , Pohjola, V. , Jauhiainen, T. , Moore, J. , Pinglot, J. F. , Vaikmaäe, R. , van de Wal, R. S. W. , Hagen, J. O. , Ivask, J. , Karlöf, L. , Martma, T. , Meijer, H. A. J. , Mulvaney, R. , Thomassen, M. , and van den Broeke, M. , 2001: A new ice-core record from Lomonosovfonna, Svalbard: viewing the 1920-97 data in relation to present climate and environmental conditions. Journal of Glaciology, 47(157): 335–345.
- Jauhiainen, T. , Moore, J. , Perämäki, P. , Derome, J. , and Derome, K. , 1999: Simple procedure for ion chromatographic determination of anions and cations at trace levels in ice core samples. Analytica Chimica Acta, 389(1): 21–29.
- Kekonen, T. , Moore, J. , Perämäki, P. , Mulvaney, R. , Isaksson, E. , Pohjola, V. , and van de Wal, R. , 2005: The 800 year long ion record from the Lomonosovfonna (Svalbard) ice core. Journal of Geophysical Research , 110(D7): D07304, http://dx.doi.org/10.1029/2004JD005223 .
- Koerner, R. , 1997: Some comments on climatic reconstructions from ice cores drilled in areas of high melt. Journal of Glaciology, 43(143): 90–97.
- Laj, P. , Palais, J. M. , and Sigurdsson, H. , 1992: Changing sources of impurities to the Greenland Ice-sheet over the last 250 years. Atmospheric Environment, 26: 2627–2640.
- Lamarque, J. F. , Bond, T. C. , Eyring, V. , Granier, C. , Heil, A. , Klimont, Z. , Lee, D. , Liousse, C. , Mieville, A. , Owen, B. , Schultz, M. G. , Shindell, D. , Smith, S. J. , Stehfest, E. , Van Aardenne, J. , Cooper, O. R. , Kainuma, M. , Mahowald, N. , McConnell, J. R. , Naik, V. , Riahi, K. , and van Vuuren, D. P. , 2010: Historical (1850–2000) gridded anthropogenic and biomass burning emissions of reactive gases and aerosols: methodology and application. Atmospheric Chemistry and Physics , 10: 7017–7039, http://dx.doi.org/10.5194/acp-10-7017-2010 .
- Legrand, M. , 1997: Ice-core records of atmospheric sulphur. Philosophical Transactions of the Royal Society of London, B, 352: 241–250.
- Liss, P. , Hatton, A. , Malin, G. , Nightingale, P. , and Turner, S. , 1997: Marine sulphur emissions. Philosophical Transactions of the Royal Society of London, B (Biological Sciences), 352(1350): 159–169.
- Matoba, S. , Narita, H. , Motoyama, H. , Kamiyama, K. , and Watanabe, O. , 2002: Ice core chemistry of Vestfonna Ice Cap in Svalbard, Norway. Journal of Geophysical Research, 107: 4721–4727.
- Moore, J. , Kekonen, T. , Grinsted, A. , and Isaksson, E. , 2006: Sulphate source inventories from Svalbard ice core record spanning the Industrial Revolution. Journal of Geophysical Research , 111: D15307, http://dx.doi.org/10.1029/2055JD006453 .
- Moore, J. C. and Grinsted, A. , 2009: Ion fractionation and percolation in ice cores with seasonal melting. In Institute of Low Temperature Science, Hokkaido University (ed.), Physics of Ice Core Records II. Sapporo, Japan: Hokkaido University Press, 68: 287–298.
- Motoyama, H. , Watanabe, O. , Fujii, Y. , Kamiyama, K. , Igarashi, M. , Matoba, S. , Kameda, T. , Goto-Azuma, K. , Izumi, K. , Narita, H. , Iizuka, Y. , and Isaksson, E. , 2008: Analyses of ice core data from various sites in Svalbard glaciers from 1987 to 1999. NIPR Arctic Data Reports, 7: 1–79, 2008–2011.
- Mylona, S. , 1996: Sulphur dioxide emissions in Europe 1880–1991. Tellus, 48B: 662–689.
- Nye, J. F. , 1957: The distribution of stress and velocity in glaciers and ice sheets. Proceedings of the Royal Society of London, Ser. A, 239(1216): 113–133.
- Perkin, R. G. , and Lewis, E. L. , 1984: Mixing in the West Spitsbergen Current. Journal of Physical Oceanography, 14: 1315–1325.
- Pinglot, J. F. , Pourchet, M. , Lefauconnier, B. , Hagen, J. O. , Isaksson, E. , Vaikmae, R. , and Kamiyama, K. , 1999: Accumulation in Svalbard glaciers deduced from ice cores with nuclear tests and Chernobyl reference layers. Polar Research, 18: 315–321.
- Reuss, J. O. , Cosby, B. J. , and Wright, R. F. , 1987: Chemical processes governing soil and water acidification. Nature, 329: 27–32.
- Rossby, T. , 1996: The North Atlantic Current and surrounding waters: at the crossroads. Review of Geophysics, 34: 463–481.
- Röthlisberger, R. , Hutterli, M. A. , Wolff, E. W. , Mulvaney, R. , Fischer, H. , Bigler, M. , Goto-Azuma, K. , Hansson, M. E. , Ruth, U. , Siggaard-Andersen, M.-L. , and Steffensen, J. P. , 2002: Nitrate in Greenland and Antarctic ice cores: a detailed description of post-depositional processes. Annals of Glaciology, 35: 209–216.
- Röthlisberger, R. , Mulvaney, R. , Wolff, E. W. , Hutterli, M. A. , Bigler, M. , de Angelis, M. , Hansson, M. E. , Steffensen, J. P. , and Udisti, R. , 2003: Limited dechlorination of sea-salt aerosols during the last glacial period: evidence from the European Project for Ice Coring in Antarctica (EPICA) Dome C ice core, Journal of Geophysical Research , 108(D16): 4526–4526.
- Skeie, P. , and Grønås, S. , 2000: Strongly stratified easterly flows across Spitsbergen. Tellus, 52A: 473–486.
- Smith, S. J. , van Aardenne, J. , Klimont, Z. , Andres, R. , Volke, A. , and Delgado Arias, S. , 2010: Anthropogenic sulphur dioxide emissions: 1850–2005. Atmospheric Chemistry and Physics Discuss., 10: 16111–16151.
- Stauffer, B. , Flückiger, J. , Wolff, E. , and Barnes, P. , 2004: The EPICA deep ice cores: first results and perspectives. Annals of Glaciology, 39: 93–100.
- Watanabe, O. , Kamiyama, K. , Motoyama, H. , Igarashi, M. , Matoba, S. , Shiraiwa, T. , Yamada, T. , Shoji, H. , Kanamori, S. , Kanamori, N. , Nakawo, M. , Ageta, Y. , Koga, S. , and Satow, K. , 1997: Preliminary report on analyses of melted Dome Fuji ice core obtained in 1993. Proceedings of the NIPR Symposium on Polar Meteorology and Glaciology, 11: 14–23.