Abstract
Dissolved organic matter (DOM) exported in glacier meltwater influences downstream biogeochemical processes, and climate warming may increase the meltwater DOM flux. In this study, we quantify and use fluorescence spectroscopy and parallel factor analysis (PARAFAC) to characterize DOM exported in glacier meltwater in Taylor and Wright Valleys, McMurdo Dry Valleys, Antarctica.
Andersen Creek, a proglacial stream draining Canada Glacier meltwater, exported ∼20 kg of DOM as dissolved organic carbon (DOC) to Lake Hoare during the melt season. Supraglacial snowpack DOM from all of the Dry Valley glaciers sampled exhibits “protein-like” fluorescence indicating that it contains potentially labile moieties that might be a favorable substrate supporting downstream microbial metabolism. However, this protein-like fluorescence does not persist in any of the meltwater streams surveyed, suggesting that it is quickly transformed by resident microbial populations and/or mixed with other DOM pools within stream channels or along its margins.
Given the seemingly ubiquitous protein-like fluorescent characteristic of glacier-derived DOM and the immediate change to the bulk DOM in glacier streams, a more thorough characterization of the bulk DOM pool from glacial sources and through downstream ecosystems would yield valuable information about the potential contribution of glacier melt to the global carbon cycle.
Introduction
Glaciers supply water to many rivers globally and represent an important water source for human consumption, agricultural and industrial use, hydroelectric power generation, and transport for some of the most populated areas of the planet (CitationKaser et al., 2010). The chemical and organic constituents in glacier meltwater influence biogeochemical processes downstream. As the global glacier meltwater flux increases in response to climate warming, questions regarding the quantity and characteristics of material exported in glacier meltwater to downstream ecosystems become increasingly important.
Dissolved organic matter (DOM) is of significant influence to aquatic system ecology because of its role as an important nutrient and carbon source for aquatic metabolic activity (e.g. CitationCoffin, 1989; CitationFindlay and Sinsabaugh, 2003; CitationYoung and Ingall, 2010; CitationInamdar et al., 2011; CitationKujawinski, 2011). DOM function is a result of its structural properties, and its composition is highly variable and difficult to characterize. No single technique exists that is capable of fully characterizing DOM. Nonetheless, methods exist that can measure changes in specific DOM moieties and these changes can be used to infer changes in DOM properties. Fluorescence spectroscopy measures the abundance and type of fluorescing compounds (fluorophores) found in DOM, and changes in DOM fluorescence can be used to infer changes in DOM, even though fluorophores comprise a relatively small fraction of the bulk DOM (CitationMcKnight et al., 2001; CitationStedmon et al., 2003; CitationCoble, 2007). Furthermore, fluorescence spectroscopy is a rapid analytical technique that uses very little sample, and measurements are made with no to very little sample manipulation (e.g. DOM extraction, conditioning). Thus fluorescence spectroscopy is very well suited for DOM studies that are limited in sample volume and DOM concentration, and/or require high spatial or temporal resolution (CitationFellman et al., 2010a).
A number of studies characterizing DOM by fluorescence identify the fluorophore groups in the DOM that are indicative of different “types” of biogeochemically labile (protein-like) and relatively recalcitrant (humic-like) substances in the bulk DOM pool (e.g. CitationMcKnight et al., 2001; CitationWu et al., 2003; CitationFellman et al., 2009; CitationYamashita et al., 2010). The protein-like fluorescence is derived from the presence of the amino acids tryptophan and tyrosine, and to a lesser extent phenylalanine. This does not mean that these amino acids are the cause of fluorescence, but rather that the DOM fluorophores fluoresce in the same region and may be indicative of the presence of labile organic moieties, such as amino acids. The presence of tyrosine- and tryptophan-like fluorescence has been correlated with total hydrolysable amino acid abundance in marine and lacustrine systems (CitationYamashita and Tanoue, 2003; CitationWu et al., 2003).
Humic-like fluorescence is associated with compounds resulting from abiotic humification processes to produce humic and fulvic acids (CitationWagner and Wolf, 1999). A third fluorescing humic compound, marine humic-like material, results from the humification of biologically derived precursor material associated with phytoplankton blooms in marine systems (CitationYamashita et al., 2007) and with microbial abundance in glacier ice (CitationBarker et al., 2010).
In most natural waters, the humic-like fluorophores are the most prominent features in DOM fluorescence spectra because lignin-derived biopolymers resulting from the degradation of vascular plant material are resistant to biogeochemical degradation and undergo abiotic humification in watershed soils and organic litter (CitationMcKnight et al., 2001). In contrast, the fluorescence spectra of glacier meltwater and its source snow and ice DOM are dominated by protein-like fluorescence (CitationBarker et al., 2006, Citation2009; CitationDubnick et al., 2010). This protein-like component may be a useful source of dissolved organic carbon (DOC) for heterotrophic microorganisms at the source of the terrestrial aquatic cycle, and as such may influence biogeochemical transformations of DOM in glacier meltwater-fed aquatic ecosystems (CitationFellman et al., 2009).
While the protein-like fluorophore has been identified in the DOM from several glacier systems from very different locations globally (e.g. CitationBarker et al., 2006, Citation2009, Citation2010; CitationDubnick et al., 2010), its source and biogeochemical evolution in glacier systems and in meltwater is poorly understood. Although DOM concentrations in glacier meltwater are relatively low, its potential lability may make it an important source of DOM for heterotrophs at the source of the terrestrial hydrologic cycle (e.g. CitationFellman et al., 2009; CitationHood et al., 2009; CitationBarker et al., 2009, Citation2010; CitationDubnick et al., 2010). Here, we investigate DOM characteristics in glacier snow, ice, and meltwater in the Taylor and Wright Valleys, McMurdo Dry Valleys, Antarctica, using fluorescence spectroscopy.
The only sources of DOM in Dry Valley streams are derived from in situ produced DOM from glaciers in ice and snow melt, in stream production by autochthonous microorganisms, and/or DOM leaching from the stream hyporheic zone or adjoining snowpacks (CitationFountain et al., 1999). Furthermore, the Dry Valleys are largely free of human influence and potential anthropogenic DOM sources. The absence of terrestrial vegetation and organic-rich soils in the McMurdo Dry Valleys provides an ideal opportunity to study the source, export, and evolution of glacially derived protein-like fluorophores in meltwater DOM, which is not possible in more vegetated catchments.
In this study, we focus on characterizing DOM in Andersen Creek, a marginal stream that flows along the west flank of Canada Glacier to the permanently ice-covered Lake Hoare. We monitored Andersen Creek DOM throughout the 2006–2007 melt season to determine (a) the net flux of DOM in a meltwater stream to downstream aquatic ecosystems, (b) the evolution of the protein-like DOM in a glacier environment, and (c) changes in the fluorescence properties of DOM over a melt season using parallel factor analysis (PARAFAC). We compared Andersen Creek DOM to that of other Dry Valley streams and lakes, and to DOM in meltwater source material (snow and ice), to assess the variability in composition in a system devoid of the influence of terrestrial vegetation. We also examined DOM evolution along the longest continuous Dry Valley watercourse, the Onyx River (Wright Valley) to assess the role of fluvial transport on DOM composition.
Field Site and Methods
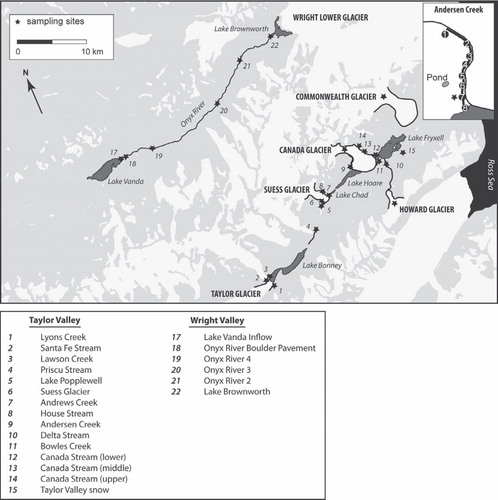
The Taylor and Wright Valleys are parallel ice-free areas located in the Dry Valley region of southern Victoria Land, Antarctica (). Canada Glacier is one of several alpine glaciers that descend from the mountains of the Asgard Range into Taylor Valley. Meltwater from the Canada Glacier surface (supraglacial) drains east into Lake Fryxell via Canada Stream, and west directly through supraglacial channels, or via Andersen Creek, into Lake Hoare. Canada Stream is unique amongst Dry Valley meltwater streams because it hosts “the richest plant growth (bryophytes and algae) in the southern Victoria Land Dry Valleys” (CitationSecretariat of the Antarctic Treaty, 2011), which led to its designation as an Antarctic Specially Protected Area (ASPA No. 131). Andersen Creek is the largest stream that flows into Lake Hoare and is more typical of other meltwater streams in the Dry Valleys in terms of biotic growth within and marginal to the stream channel; it is characterized by meltwater flow over loose sediment hosting sparse algal mats.
The Onyx River is the longest continuous meltwater stream in the McMurdo Dry Valleys (>30 km; CitationGreen et al., 2005) and flows along the Wright Valley floor, fed by proglacial Lake Brown worth to Lake Vanda (). Flow in the Onyx River may be seasonally supplemented by melt from glaciers descending from the slopes of the Asgard and Olympus Ranges (CitationStumpf et al., 2012), although no meltwater from surrounding glaciers contributed to Onyx River flow during this study.
SAMPLING
Canada Glacier meltwater was sampled from Andersen Creek (site 9 and inset; ) near its inflow to Lake Hoare daily at approximate maximum daily discharge during the 2006–2007 melt season (November 2006 to January 2007). Meltwater sample collection along a transect extending from the uppermost reach of Andersen Creek, where supraglacial meltwater cascades off of Canada Glacier into the Andersen Creek channel to the outflow to Lake Hoare, was conducted twice during the melt season (9 December 2006 and 4 January 2007; Day 343 and Day 369). A highresolution diurnal sampling event was conducted (23 December 2006; Day 357) where meltwater samples were collected every 2 h over a 24 h period.
Snow from the surface of the Canada, Commonwealth, and Howard Glaciers; snow from a snow fence located on the Taylor Valley floor (site 15; ); and ice from Suess Glacier (site 6; ) were also sampled opportunistically.
Nine streams in Taylor Valley were sampled over a 2 d period. Each stream can be broadly characterized by its position relative to its glacial meltwater source () and in-stream or stream marginal biological activity. Both Lyons Creek and Santa Fe Stream (sites 1 and 2, respectively; ) are glacier marginal streams, similar to Andersen Creek, and flow into Lake Bonney. Similarly, Canada Stream (sites 12, 13, 14; ) and Andrew's Stream flow along the margins of Canada Glacier into Lake Fryxell. As noted above, Canada Stream is exceptional because of the abundance of algae in the stream channel (CitationMcKnight and Tate, 1997) and by high chlorophyll A and carotenoid concentrations near the Middle Canada Stream sampling point, indicative of relatively abundant algal- and bryophyte-derived organic contribution at this location (CitationMcKnight, 1995). House Stream and Lawson Creek (sites 8 and 3, respectively; ) are proglacial streams that flow from Suess Glacier into Lake Chad and Rhone Glacier into Lake Bonney, respectively. Bowles Creek (site 11; ) drains several small ponds near Canada Glacier and flows into Lake Fryxell. There are several moss beds along the Bowles Creek stream course, and dissolved plant material is transported in the stream flow as reflected by the relatively high concentrations of chlorophyll b and c, as well as carotenoids in Bowles Creek meltwater (CitationMcKnight, 1995). Delta Stream (site 10; ) flows proglacially from Howard Glacier and is the longest stream in the Lake Fryxell basin. Priscu Stream (site 4; ) is a second-order stream that flows along the Taylor Valley floor into Lake Bonney. Priscu Stream receives meltwater directly from LaCroix Glacier and Sollas Glacier via Bohner Stream, and is characterized by relatively low concentrations of chlorophyll a, b, and c (CitationMcKnight, 1995). Outflow from Lake Popplewell (site 5; ) was also sampled. Lake Popplewell is a small marginal lake that receives meltwater from Suess Glacier via an ice-marginal stream. Meltwater from the Onyx River was sampled at 5 points during a single day along a transect beginning at Lake Brownworth (site 22; ) and terminating at Lake Vanda (site 17; ).
FIGURE 1. The location of sampling sites (★) in the Taylor and Wright Valleys, McMurdo Dry Valleys, Antarctica. Inset shows the location of sampling points for the Andersen Creek transect and the location of a small pond near Andersen Creek (77.62°S, 162.90°E).
Water samples for DOM analyses were collected in acidwashed (HCl) 250 mL amber glass bottles. Each bottle was rinsed three times with stream water before the analytical sample was collected. Samples were immediately filtered using a glass filtration apparatus that had been soaked in acid (HC1) and rinsed with deion- ized water and fitted with a pre-combusted (450 °C for 8 h) glass fiber filter paper (GF/F; 0.7 µm). The filter sample reservoir was rinsed three times with sample water before 150 mL was filtered under vacuum to the filtrate reservoir. The filtrate reservoir was rinsed three times with filtered water before the final filtered sample was collected and decanted into 2 acid-rinsed (HC1) and pre-combusted (450 °C for 8 h) 40 mL amber glass vials. Each filtered meltwater sample was stored cool (∼2 °C) and in the dark until transport to the Crary Laboratory at McMurdo Station (Ross Island) for storage (∼2 °C) and DOC quantification.
Water was also sampled for analysis of its dissolved ionic constituents using pre-rinsed (three times) 1 L high-density polyethylene (HDPE) bottles. Water samples were immediately filtered under vacuum through 0.4 µm Nucleopore polycarbonate membrane filters into pre-rinsed (five times with deionized water) 125 mL HDPE bottles. Cation samples are preserved by adjusting the sample pH to ∼2.5 using 0.1% nitric acid. All samples are stored cool (∼2 °C) and in the dark until transport to the Crary Laboratory at McMurdo Station for storage (∼2 °C) and ionic analysis.
Snow samples were collected in acid-washed (HCl) and precombusted (450 °C for 8 h) amber glass jars, melted in the dark at room temperature, and filtered as described above for meltwater samples. The Suess Glacier ice sample was collected by excavating a small trench into the surface of the glacier (∼10 cm) using a flame sterilized ice axe and chisel. Ice from the base of the trench was pried into sterile Whirlpak bags, melted, and processed as a meltwater sample.
ANALYSIS
All samples were analyzed for pH and electrical conductivity (EC) at Lake Hoare Camp using handheld instruments (Thermo Scientific). Each sensor was calibrated daily using standards (3 point calibration for pH, 2 point calibration for EC), and each measurement was taken <10 min after sample collection (meltwater) or sample melting (snow and ice).
One of each pair of filtered samples was analyzed for DOC concentration by high temperature combustion and infrared detection using a Shimadzu TOC-V CPN Total Organic Carbon Analyzer equipped with high sensitivity platinum catalyst at the Crary Laboratory, McMurdo Station. Prior to analysis, each sample was acidified to pH 2 using trace metal grade HCl and sparged with TOC grade air to remove inorganic carbon species. Each sample was analyzed in triplicate (0.02 mg/L detection limit). DOC samples were analyzed <4 d after collection.
Major ionic composition was determined at Crary Laboratory using a Dionex DX-120 ion chromatograph equipped with an isocratic pump and electrical conductivity detector. A Dionex IonPac CS12A analytical column (4 × 250 mm) and CG12A guard column (4 × 50 mm) were used for cation analyses, and a Dionex IonPac AS 14 analytical column (4 × 250 mm) and AG 14 guard column (4 × 50 mm) were used for anion analyses. Ionic analysis was performed <7 d after collection. Detection limits (mg/L) and precision (% difference between duplicates) for major ion and nutrient analyses are as follows (from CitationWelch et al., 2010): C1- (0.2, <1), N-NO3 - (0.003, <2), SO4 2- (0.2, <2), Na+ (0.2, <1), K+ (0.04, <1), Mg2+ (0.1, <1), Ca2+ (0.1, <1).
The second of the duplicate DOM samples was transported cool (∼2 °C) to the Ohio State University and analyzed for its absorbance and fluorescence using a Varian Cary 13 UV-vis spectrophotometer <3 months after sample collection. Total emission scans, also known as excitation emission matrices (EEMs) were collected between 250–410 nm excitation (10 nm increment) and 260–700 nm (1 nm increment) emission wavelengths. All samples were scanned at room temperature using a quartz glass cuvette with a 10 mm path length. Instrument performance was monitored by measuring daily the intensity of the Raman peak in a Milli-Q water blank prior to sample analysis. Intensity did not fluctuate >0.5%, and Raman peak position varied <0.02% over the course of the analysis. Fluorescence intensities across all measured wavelengths were corrected using instrument-specific excitation and emission correction factors (CitationCory et al., 2010). Inner filter effects were not corrected for because DOC concentrations were low (<1 mg/L) and absorbance at 320 nm did not exceed 0.002. Data from the spectral region corresponding to the high-intensity area attributed to the Rayleigh scattering were removed from each spectrum, and spectra were Raman corrected by subtracting the spectrum for deionized water under identical scanning conditions. All fluorescence spectra were normalized to the sample fluorescence peak spectral maximum. Ideally, DOM samples should be analyzed for fluorescence immediately after sample collection; however, logistical constraints did not permit this. To assess the possibility of changes in DOM fluorescence due to prolonged (3 month) storage, we analyzed duplicate samples 3 months after their initial fluorescence analysis (<6 months after sample collection). Fluorophore peak position varied <8% after 3 months in the duplicate samples, and fluorescence intensity varied by <12%.
PARAFAC analysis of the EEM data set was performed on the spectral data set, and a model was created and evaluated according to the criteria explained by Stedmon and Bro (Citation2008) and Dubnick et al. (Citation2010). PARAFAC was executed in Matlab 7.6.0 using a modified version of the DOMFluor toolbox (CitationStedmon and Bro, 2008). A detailed description of the PARAFAC procedure, model validation, and interpretation is given by Dubnick et al. (Citation2010). PARAFAC models ranging from 3 to 7 components were evaluated, and the 4 component model was chosen as the most robust because it was the only model to pass the split-half analysis and did not leave any identifiable peaks as residuals.
Cluster analysis of the PARAFAC components on individual EEMs was performed using Statistica 10.0 (StatSoft, Tulsa, Oklahoma) software to separate individual EEMs into groups sharing spectral similarities. An average EEM for each cluster was generated by averaging the corrected fluorescence intensity at each point within the EEM for each sample that populated a specific cluster. Dominant fluorophores were then identified visually and compared to those described in previous studies.
Hydrological and limited biological measurements within Taylor Valley are accessible through the McMurdo Dry Valleys Long Term Ecological Research web site (http://www.mcmlter.org). Andersen Creek discharge data were used to derive the DOC flux to Lake Hoare from Andersen Creek. The flux calculation was derived as follows: 15 min averaged Andersen Creek discharge was recorded by a pressure transducer located at a weir near the mouth of Andersen Creek at Lake Hoare, ∼10 m downstream from the meltwater sampling site used here. Missing data in the discharge record were linearly interpolated over any data gaps. Daily DOC values were also linearly interpolated between measurements. DOC exported during each 15 min period was calculated over the entire monitoring period and summed to calculate the net amount of DOC exported from Andersen Creek to Lake Hoare. To test the validity of the DOC flux calculation, results from the Andersen Creek diurnal sampling (using DOC concentration sampled every 2 h) were compared to results obtained for the same time period using the method above (using the daily flow maximum DOC concentration).
Results
DOC
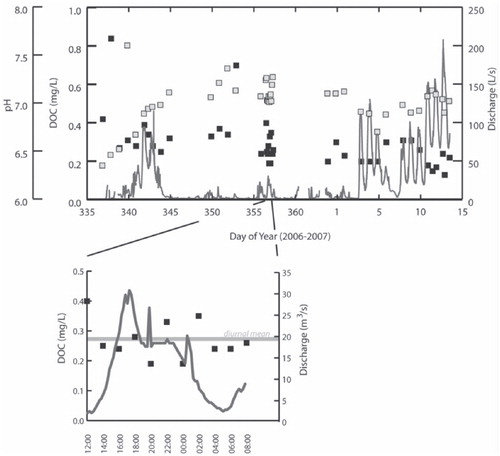
Of the inorganic geochemical parameters that were measured, DOC correlates most strongly with EC () in Andersen Creek meltwater. The DOC concentration in Andersen Creek meltwater (mean = 0.30 mg/L, range = 0.71 [0.13-0.84] mg/L) was low relative to the global average for river water (4.4 mg/L) but similar to concentrations previously reported for glacier streams and snowmelt (CitationAiken et al., 1996; CitationLyons et al., 2007, and references therein) and was similar to that found in most of the Taylor Valley streams, snow, ice, and Onyx River water measured during this study (). Overall, the concentration of Andersen Creek DOC decreased throughout the melt season and was independent of discharge (). The diurnal DOC concentration varied by a factor of 2 (range = 0.21 mg/L [0.19–0.40 mg/L]; SD = 0.06). The calculated flux of DOC to Lake Hoare from Andersen Creek meltwater was 20.29 kg over the 42 d monitoring period. Using the daily flow, maximum DOC concentration yielded a flux that was 0.01%, or 0.003 kg, higher than the flux calculated using 2 h sampling schedule (diurnal data). Extrapolated over the entire monitoring period, the difference in the DOC flux calculated between the once-daily and 2 h sampling schedules is only 0.132 kg. The flux calculation excluding data from Days 337 and 352, when sampled DOC concentrations were anonymously high, yields a result of 19.14 kg DOC exported from Andersen Creek to Lake Hoare. This indicates that periodic pulses of DOC in Andersen Creek, which may have been missed by oncedaily sampling, would raise the estimated Andersen Creek DOC flux in the order of kilograms of DOC.
TABLE 1 The correlation between measured inorganic chemical species and DOC. Values in gray shading indicate statistically significant correlation.
TABLE 2 Average dissolved organic carbon (DOC) concentrations for samples collected in this study. Also shown are the average values for Taylor Valley stream, Onyx River, and snow and ice environments.
PARAFAC MODELING
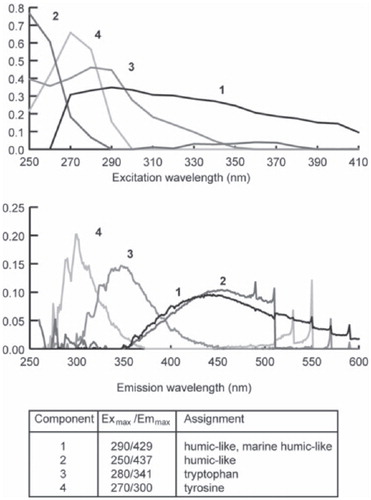
The PARAFAC model can be described using 4 components indicative of fluorophores existing in the Taylor Valley and Onyx River EEMs (), which account for 87.46% of the variance in the data set. The fluorophores identified by the PARAFAC model may be compared to similar fluorophores identified in the literature (e.g. CitationCoble, 2007, and references therein) as an indication of the fluorescing compounds present in snow, ice, and meltwater DOM.
Andersen Creek DOM contained both humic-like and proteinlike material (), and the relative proportion of these materials in Andersen Creek DOM (as indicated by individual EEM loadings on each of the PARAFAC components) changed daily and over the course of the melt season (). The loading of a specific EEM on each component quantifies its relative abundance as identified by the PARAFAC model. Of particular interest is that DOM in the snow and ice samples loaded most heavily on the “tyrosinelike” fluorophore (component 4), indicating that this fluorophore was the dominant feature in the fluorescence spectra of DOM in snow and ice in Taylor Valley.
There was a statistically significant correlation between DOC concentration and humic-like components (1 and 2) loadings in Andersen Creek meltwater (r 2 = 0.82, p < 0.05). The other protein-like component 3 was not correlated with component 4 (r 2 = 0.004, p < 0.05) but was significantly correlated with the humic-like components 1 and 2 (r 2 = 0.30 and r 2= 0.44, p < 0.05).
FIGURE 2. The 2006–2007 melt season DOC (![]()
A cluster analysis of the component loadings organizes DOM spectra into groups based on similarities in loadings between the components identified by the PARAFAC model (). The average EEM for Clusters 1–4 and 6 indicated different combinations of humic-like, marine humic-like, and protein-like (tryptophan-like) fluorophores (; ), potentially indicative of DOM with both labile and recalcitrant moieties. The average EEM for Cluster 5 was unique because it displayed a single protein-like (component 4; tyrosine-like) fluorophore that is present in EEMs from DOM in all of the snow and glacier ice samples, as well as DOM from the lowest sampling point along the Canada Stream transect, and Andersen Creek meltwater on Day 338 (4 December 2006). This was potentially indicative of a less complex form of DOM containing protein-like moieties and lacking humic-like moieties. Cluster 1 was the most populated and was comprised almost entirely of EEMs from Andersen Creek meltwater samples (33 of 34 spectra), in addition to an EEM from the uppermost sampling point on the Canada Stream transect (sampled immediately downstream from where supraglacial meltwater cascades off of Canada Glacier into the stream channel). Cluster 2 was comprised of EEMs from Lake Popplewell outflow, Lyons Creek, and early season Andersen Creek DOM. Cluster 3 was comprised of EEMs from the upper reaches of the Onyx River transect, Taylor Valley streams (Andrew's Stream, Lawson Creek, Santa Fe Stream, House Stream, and Priscu Stream), and 2 late-season Andersen Creek samples. Clusters 4 and 6 were comprised of EEMs from Andersen Creek, Delta Steam, Bowles Creek, the middle sampling point of Canada Stream, and the lower reaches of the Onyx River transect.
Given a constant optical flow path length and solute molar extinction coefficient, the fluorescence intensity of the individual fluorophores is a function of the concentration of that fluorophore. Previous studies have used fluorophore intensity as an indicator of relative fluorophore concentration (e.g. CitationFellman et al., 2010b). Therefore, it is possible to compare the fluorescence intensity of fluorophores from different samples as an indication of changes in fluorophore abundance between samples. is a plot of the ratio between the protein-like peak fluorescence intensity relative to that of the humic-like fluorescence in DOM along the Onyx River. Overall, humic-like fluorescence became a slightly more prominent feature, relative to protein-like fluorescence, in DOM with increasing distance from Lake Brownworth. In contrast, sources of proteinaceous and humic fluorescence loaded similarly on the bulk DOM in Andersen Creek in ().
FIGURE 3. The excitation (top) and emission (bottom) spectra for the 4 components identified by the PARAFAC model. The assignment of these fluorophores as compounds is taken from the literature (Parlanti et al., 2000; CitationYamashita and Tanoue, 2003; CitationCoble, 2007).
Discussion
During the 42 d monitoring period approximately 20.29 kg of DOM as DOC was exported to Lake Hoare in Andersen Creek meltwater. This should be taken as a very coarse estimate because DOC and Andersen Creek meltwater discharge do not co-vary (, part a). While Andersen Creek discharge was logged at 15 min intervals, the once daily monitoring of DOC concentrations raises the possibility that we may have failed to detect episodic pulses of DOC, possibly resulting from changes in hydro logical flow routing and access to discrete DOC pools (e.g. Day 352; CitationBarker et al., 2006). DOM in Andersen Creek meltwater was sampled at the same time each day and results of the diurnal sampling exercise indicate that the DOC concentration at sampling time (21:30) approximated the average daily DOC concentration in Andersen Creek meltwater (, part b), suggesting that the estimated flux of DOC export to Lake Hoare is reasonable.
The concentration of dissolved ions (as indicated by EC), particularly fluoride, chloride, and nitrate varied with DOC concentration in Andersen Creek. Meltwater pH was negatively correlated with DOC concentration (r 2 = -0.35), particularly early in the melt season (), which is indicative of melt-induced flushing of acidic chemical species (e.g. H2SO4) from the snowpack (e.g. CitationTranter et al., 1986; CitationEichler et al., 2001).
Lake Hoare is the most oligotrophic of the Taylor Valley lakes with DOC concentrations below 0.5 mg/L, and below 0.3 mg/L in the upper water column (CitationClocksin et al., 2007). Lake Hoare and other ice-covered lakes in the McMurdo Dry Valleys are characteristically very poorly mixed and exhibit stable chemoclines due to the function of the permanent ice cover as a barrier between the water column and atmospheric circulation. Because of this, the hydrological and hydrochemical influence of incoming stream flow is limited to the upper few meters of the lake water column. Given the low DOM content of the upper water column in Lake Hoare, the contribution of tens of kilograms of DOM from each stream flowing into the lake annually represents a significant DOM source to support heterotrophic biological activity in the upper water column. This is particularly true of Lake Hoare where other DOC sources (e.g. phytoplankton extracellular release and nutrient diffusion from the hypolimnia) are relatively small (CitationTakacs et al., 2001). For example, as a back-of-the-envelope calculation, multiplying the volume of Lake Hoare (17,500,000 m3; CitationPriscu, 2012) by the measured 0.4 mg/L DOC in the Lake Hoare water column (CitationClocksin et al., 2007) yields an estimate of a 7000 kg DOC in Lake Hoare water. Thus, our estimate of the DOC exported from Andersen Creek suggests that there is more than 350 times more DOC in Lake Hoare than is delivered to Lake Hoare by Andersen Creek in a single melt season (not accounting for interannual variation in Lake Hoare volume or water column DOC concentration). While the DOC flux from Andersen Creek to Lake Hoare seems small relative to the standing stock of DOC in the lake water column, DOC in Canada Glacier meltwater represents the only significant external source of DOC to the Lake Hoare ecosystem, and therefore a potentially important, although limited, ecological resource. However, any role that DOM plays in the proglacial ecosystem (e.g. heterotrophic substrate) is a function of its molecular characteristics, and changes in the fluorophore composition over the monitoring period suggest that DOM characteristics, and thus potential function, change over time.
As explained earlier, the 4 component PARAFAC model best describes the variance in the EEM data set. While humic substances and protein-like material are both used by microorganisms to support metabolism (CitationAnesio et al., 2004; CitationHood et al., 2009), the latter are generally considered to be indicative of more labile DOM moieties (CitationHertkorn et al., 2002).
Previous investigations of the fluorescence characteristics of DOM glacier ice and snow indicate that the dominant feature in the fluorescence spectra is component 4, referred to by others as the “tyrosine-like fluorophore” (CitationBarker et al., 2006, Citation2009; CitationCoble, 2007; CitationDubnick et al., 2010). Further, DOM exhibiting this fluorophore may be microbially labile (CitationYamashita and Tanoue, 2003; CitationHood et al., 2009). We use the specific amino acids to describe the components only for the purposes of delineating between their fluorescence signature as we have no independent evidence that these compounds are responsible for the observed fluorescence. However, if these amino acids exist in meltwater DOM, then they would be considered potentially labile, and because DOM in meltwater from snow and ice may contain microbially labile compounds, it may be a useful metabolic substrate for microbial communities in downstream aquatic environments. Our results show that there is a conversion of the bulk DOM fluorescence, and thus possibly its overall composition, in glacier meltwater upon export, which will affect how glacially exported DOM functions in downstream environments. The cluster analysis indicates that the DOM in all but one of the Andersen Creek meltwater samples (Day 338) produced EEMs indicative of component 3 (also called the “tryptophan-like fluorophore”) and humic-like and/or marine humic-like fluorophores in meltwater DOM. The Andersen Creek DOM spectrum from Day 338 may have been influenced by flow from a nearby intermittent waterfall which routed supraglacial meltwater directly from the glacier surface to within ∼5 m of the daily sampling location. This waterfall was intermittently active from Day 338 to Day 340 when Taylor Valley air temperatures increased above freezing (CitationFountain, 2011). The correlation between meltwater DOC concentration and dissolved solute concentration, and the introduction of DOM with the tryptophan-like (component 3) and humic fluorophores, suggest that glacier ice and snowmelt acquires a secondary source of dissolved solutes and DOM in stream channels. This may occur during streamflow as meltwater is routed through the stream channel and/or by the addition of supplemental DOM from channel-marginal sources, or through processes occurring during hyporheic zone exchange. This DOM is comprised of humic material (components 1 and 2), which would presumably be less easily mineralized by resident microbial communities than proteinaceous material (CitationFellman et al., 2009); however, the humic material may have a significant impact on viral dynamics in streams and lakes (CitationAnesio et al., 2004). The change in tyrosine-like fluorescence to tryptophan-like fluorescence may be indicative of a biogeochemical transformation from one component to the other, or possibly the addition of component 3 (tryptophan-like) to the bulk DOM which may cause component 4 (tyrosine-like) fluorescence to be radiationlessly transferred to component 3 (CitationWeber, 1960; CitationChiu and Bersohn, 1977), thereby inhibiting the detection of any tyrosine-like fluorescence.
FIGURE 4. The loading of each component on individual excitation emission matrices (EEMs) for the (a) diurnal sampling and (b) daily sampling at Andersen Creek; transects along Andersen Creek on (c) Day 343 and (d) Day 369; (e) the Onyx River transect; (f) snow and ice samples; and (g) samples taken from other proglacial streams in Taylor Valley. Note that the samples for the Andersen Creek daily sampling are arranged chronologically, and exclude the transect samples.
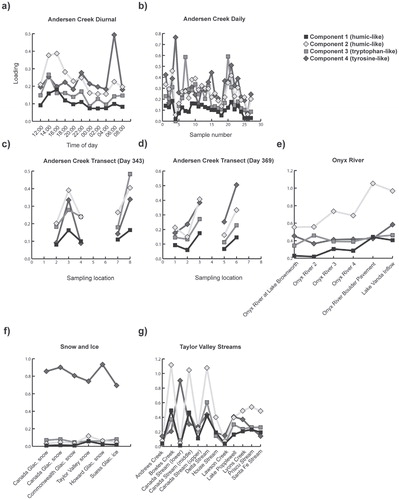
FIGURE 5. The samples that populate each of the 6 clusters identified by the cluster analysis. Times are given as hhhh, and dates are given as mm/dd.
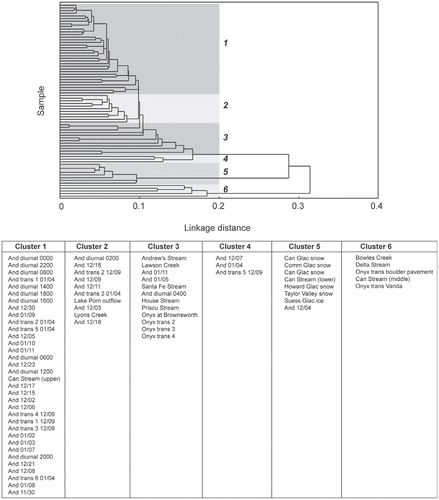
TABLE 3 Fluorophores present in the average excitation emission matrix (EEM) for each individual cluster.
FIGURE 6. The average excitation emission matrix (EEM) for each cluster as identified by the cluster analysis. Lighter shades indicate higher fluorescence intensity.
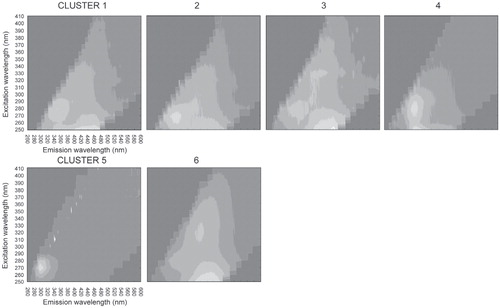
FIGURE 7. The ratio of tyrosine-like fluorescence to marine humic and humiclike fluorescence along the sampling transects at (a) Onyx River, and Andersen Creek on (b) Day 343 and (c) Day 369.
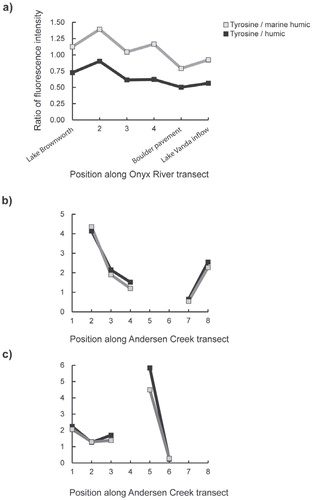
In-stream biogeochemical modification of glacially exported DOM was observed along the Onyx River where the DOM became increasingly humic-like in character with distance from the glacier headwater at Lake Brownworth (). Fluorescence intensity for both the humic-like fluorophore and the marine humic-like fluorophore increased by 23% and 18% relative to the intensity of the tryptophan-like fluorophore. The DOM in Lake Brownworth did not exhibit the “tyrosine-like” fluorophore despite the fact that it is fed by Wright Glacier meltwater, suggesting that (a) Wright Glacier meltwater DOM did not contain the “tyrosine-like” fluorophore, (b) DOM in Wright Glacier's supraglacial melt was quickly altered in a similar fashion to that observed in Andersen Creek, and/or (c) DOM was transformed in Lake Brownworth. DOM in Wright Glacier ice is protein-like in character (CitationDubnick et al., 2010) and microbially induced “nutrient stripping” occurs in Lake Brownworth (CitationHoward-Williams et al., 1997). These data support the hypothesis that supraglacially exported DOM was altered during transport to and/or within Lake Brownworth. Interestingly, Green et al. (Citation2005) also identified microbial nutrient stripping in the Boulder Pavement section of the Onyx River resulting in nitratepoor water entering Lake Vanda. The ratio of tyrosine-like to both humic-like and marine humic-like fluorescence was lowest in the Boulder Pavement section of the Onyx River transect (, part a), suggesting that either these components were being mineralized by resident microbes or that there was a source of humic material that is being added to the bulk DOM pool.
In Andersen Creek, the ratio of tyrosine-like to humic-like and marine humic-like fluorescence changed along its length (, parts b and c). Similar to the Onyx River bulk DOM fluorescence, tyrosine-like fluorescence was replaced by tryptophan-like fluorescence. Discrete sources of proteinaceous material contributed to the DOM in Andersen Creek. For example, during the Andersen Creek transect on Day 343, proteinaceous-like material was depleted in Andersen Creek meltwater, relative to humic-like and marine humic-like material, until sampling site 8, the outlet where Andersen Creek flows into Lake Hoare, where protein-like fluorescence became a more significant component of the bulk DOM. On Day 369 (4 January 2007), tyrosine-like fluorescence became more prominent at site 3, relative to site 2 (upstream). Significant enrichment of the tyrosine-like fluorophore was noticed at site 5 followed by depletion at site 6 (downstream). While the source of this tyrosine-like material and the mechanism of its incorporation into the Andersen Creek DOM pool are not known, they may be related to the hydrologic evolution of the Andersen Creek system where DOM from channel-marginal areas is mobilized by seasonal snowmelt, permafrost melt, or increased meltwater flow through the hyporheic interface. Evidence supporting this hypothesis is that sampling site 5 was located in Andersen Creek near a small channel marginal pond. The presence of an ephemeral channel between the pond and Andersen Creek suggests that there may have been a periodic hydrologic exchange of material between them. Unfortunately we are unable to test this hypothesis because sites 5 and 6 were not sampled along the transect on Day 343 when the pond was frozen and no hydrologic exchange was observed.
The extent of glacially exported DOM modification in Taylor Valley streams appears to be a function of both transit distance from the glacial source and access to different sources of DOM. Glacier-marginal streams contain DOM which is similar to that observed in Andersen Creek, while streams that either flow for extended distances from their glacial source (Delta Stream) or that flow through algal or bryophyte-rich areas (Bowles, middle Canada Stream) contain DOM which is more humic in character. Interestingly, DOM from these streams and the two furthest sampling points along the Onyx River transect populate Cluster 6. Cluster 6 exhibits the most prominent fluorophore indicative of marine humic-like material, so-called because it is found in marine environments and is humic-like in character. While the mechanisms that contribute to the formation of marine humic-like material are unknown, it has been associated with phytoplankton activity and englacial microbial abundance (CitationYamashita et al., 2007; CitationBarker et al., 2010). Thus, it may be tentatively taken as evidence of potential in-stream microbial activity and biogeochemical activity.
Conclusions
Despite the oligotrophic status of the McMurdo Dry Valley aquatic ecosystem, glacier fed streams export tens of kilograms of DOM as DOC annually. This DOM is initially exported in glacier snow and ice melt as potentially labile compounds and is characterized by a dominant tyrosine-like fluorophore in its fluorescence spectra. Interestingly, supraglacial snow, snowpack accumulation in the Taylor Valley floor, and glacier ice share this spectrofluorometric characteristic, which is similar to results reported for DOM from a range of glacier environments globally (CitationBarker et al., 2006, Citation2009; CitationFellman et al., 2010a; CitationDubnick et al., 2010).
The ubiquity of this feature in snow and glacier ice DOM suggests that glacially derived DOM contains labile organic substrates that may serve an important function for downstream heterotrophic processes and that this function may be similar to glacier environments globally. However, observations from this study indicate that this tyrosine-like fluorophore does not persist as an isolated fluorophore once exported to the aquatic environment and is subject to rapid biogeochemical transformation or physical mixing with other OM pools within the stream channel or along its margins which masks its spectral signature.
By choosing fluorescence spectroscopy as an analytical technique, our characterization of glacially exported DOM and its subsequent proglacial transformation in this study is limited to those components that fluoresce. Given the seemingly ubiquitous characteristics of glacier-derived DOM and the immediate change to the bulk DOM in glacier streams, a more thorough characterization of the bulk DOM pool from glacial sources and through downstream ecosystems would yield valuable information about first-order biogeochemical processes involving DOM that influence aquatic ecology in some of the most significant rivers globally and the global carbon cycle.
Acknowledgments
The authors would like to thank the McMurdo Dry Valleys Long Term Ecological Research (LTER) program, specifically Christopher Gardner for the DOC quantification and Kathy Welch for the major ion measurements at Crary Laboratory, and Rae Spain for invaluable support and insight at Lake Hoare. We are thankful for the logistical support provided by Raytheon Polar Services in Antarctica. Thank you to three anonymous reviewers who greatly improved the quality of this manuscript.
References Cited
- Aiken, G. , McKnight, D. M. , Harnish, R. , and Wershaw, R. , 1996: Geochemistry of aquatic humic substances in the Lake Fryxell Basin, Antarctica. Biogeochemistry , 34: 157–188.
- Anesio, A. M. , Hollas, C. , Graneli, W. , and Laybourn-Parry, J. , 2004: Influence of humic substances on bacterial and viral dynamics in freshwaters. Applied and Environmental Microbiology , 70: 4848– 4854.
- Barker, J. D. , Sharp, M. J. , Fitzsimons, S. J. , and Turner, R. J. , 2006: Abundance and dynamics of dissolved organic carbon in glacier systems. Arctic, Antarctic, and Alpine Research , 38: 163–172.
- Barker, J. D. , Sharp, M. J. , and Turner, R. J. , 2009: Using synchronous fluorescence spectroscopy and principal components analysis to monitor dissolved organic matter dynamics in a glacier system. Hydrological Processes , 23: 1487–1500.
- Barker, J. D. , Klassen, J. L. , Sharp, M. J. , Fitzsimons, S. J. , and Turner, R. J. , 2010: Detecting biogeochemical activity in basal ice using fluorescence spectroscopy. Annals of Glaciology , 51: 47–55.
- Chiu, H. C. , and Bersohn, R. , 1977: Electronic energy transfer between tyrosine and tryptophan in the peptides trp-(pro)n-Tyr. Biopolymers , 16: 277–288.
- Clocksin, K. M. , Jung, D. O. , and Madigan, M. T. , 2007: Cold-active chemoorganotrophic bacteria from permanently ice-covered Lake Hoare, McMurdo Dry Valleys, Antarctica. Applied and Environmental Microbiology , 73: 3077–3083.
- Coble, P. G. , 2007: Marine optical chemistry: the chemistry of ocean color. Chemical Reviews , 107: 402–418.
- Coffin, R. B. , 1989: Bacterial uptake of dissolved free and combined amino acids in estuarine waters. Limnology and Oceanography , 34: 531–542.
- Cory, R. M. , Miller, M. P. , McKnight, D. M. , Guerard, J. J. , and Miller, P. L. , 2010: Effect of instrument-specific response on the analysis of fulvic acid fluorescence spectra. Limnology and Oceanography: Methods , 8: 67–78.
- Dubnick, A. , Barker, J. , Sharp, M. , Wadham, J. , Lis, G. , Telling, J. , Fitzsimons, S. , and Jackson, M. , 2010: Characterization of dissolved organic matter (DOM) from glacial environments using total fluorescence spectroscopy and parallel factor analysis. Annals of Glaciology , 51: 111–122.
- Eichler, A. , Schwikowski, M. , and Gaggeler, H. W. , 2001: Meltwaterinduced relocation of chemical species in alpine firn. Tellus B , 53: 192–203.
- Fellman, J. B. , Hood, E. , Edwards, R. T. , and D'Amore, D. V. , 2009: Changes in the concentration, biodegradability, and fluorescent properties of dissolved organic matter during stormflows in coastal temperate watersheds. Journal of Geophysical Research-Biogeosciences , 114: G01021, http://dx.doi.org/10.1029/2008JG000790.
- Fellman, J. B. , Hood, E. , and Spencer, R. G. M. , 2010a: Fluorescence spectroscopy opens new windows into dissolved organic matter dynamics in freshwater ecosystems: a review. Limnology and Oceanography , 55: 2452–2462.
- Fellman, J. B. , Spencer, R. G. M. , Hernes, P. J. , Edwards, R. T. , D'Amore, D. V. , and Hood, E. , 2010b: The impact of glacier runoff on the biodegradability and biochemical composition of terrigenous dissolved organic matter in near-shore marine ecosystems. Marine Chemistry , 121: 112–122.
- Findlay, S. E. G. , and Sinsabaugh, R. L. , 2003: Preface. In Findlay, S. E. G. and Sinsabaugh, R. L. (eds.), Aquatic Ecosystems: Interactivity of Dissolved Organic Matter. Boston: Academic Press, xvii–xx.
- Fountain, A. , 2011. Canada Glacier air temperatures (http://www.mcmIter.org/queries/met_results.jsp?begDate=01/01/0001&endDate=01/01/3000&mask=MM/DD/YYYY%20HH24:Mi&metStation=CAAM&dataType=AIRT).
- Fountain, A. G. , Lyons, W. B. , Burkins, M. B. , Dana, G. L. , Doran, P. T. , Lewis, K. J. , McKnight, D. M. , Moorhead, D. L. , Parsons, A. N. , Priscu, J. C. , Wall, D. H. , Wharton, R. A. , and Virginia, R. A. , 1999: Physical controls on the Taylor Valley ecosystem, Antarctica. Bioscience , 49: 961–971, http://www.jstor.org/stable/10.1525/bisi.1999.49.12.961.
- Green, W. J. , Stage, B. R. , Preston, A. , Wagers, S. , Shacat, J. , and Newell, S. , 2005: Geochemical processes in the Onyx River, Wright Valley, Antarctica: major ions, nutrients, trace metals. Geochimica et Cosmochimica Acta , 69: 839–850.
- Hertkorn, N. , Claus, H. , Schmitt-Kopplin, Ph. , Perdue, E.M. , and Filip, Z. , 2002: Utilization and transformation of aquatic humic substances by autochthonous microorgamisms. Environmental Science and Technology , 36: 4334–4345.
- Hood, E. , Fellman, J. , Spencer, R. G. M. , Hernes, P. J. , Edwards, R. , D'Amore, D. , and Scott, D. , 2009: Glaciers as a source of ancient and labile organic matter to the marine environment. Nature , 462: 1044–1047, http://dx.doi.org/10.1038/nature08580.
- Howard-Williams, C. , Hawes, I. , Schwarz, A. M. , and Hall, J. A. , 1997: Sources and sinks of nutrients in a polar desert stream, the Onyx River, Antarctica. In Lyons, W. B. , Howard-Williams, C. , and Hawes, I. (eds.), Ecosystem Processes in Antarctic Ice-free Landscapes. Rotterdam: Balkema, 155–170.
- Inamdar, S. , Singh, S. , Dutta, S. , Levia, D. , Mitchell, M. , Scott, D. , Bais, H. , and McIIale, P. , 2011: Fluorescence characteristics and sources of dissolved organic matter for stream water during storm events in a forested mid-Atlantic watershed. Journal of Geophysical Research-Biogeosciences , 116: G03043, http://dx.doi.org/10.1029/2011JG001735.
- Kaser, G. , Groβhauser, M. , and Marzeion, B. , 2010: Contribution potential of glaciers to water availability in different climate regimes. Proceedings of the National Academy of Sciences of the USA , 107: 20,223–20,227.
- Kujawinski, E. B. , 2011: The impact of microbial metabolism on marine dissolved organic matter. Annual Review of Marine Science , 3: 567–599.
- Lyons, W. B. , Welch, K. A. , and Doggett, J. K. , 2007: Organic carbon in Antarctic snow. Geophysical Research Letters , 34: L02501, http://dx.doi.org/10.1029/2006GL028150.
- McKnight, D. , 1995: Stream algal and moss biomass, knb-ltermcm.0016.1. http://tropical.lternet.edu/knb/metacat7action=read&qformat=mcm&sessionid=&docid=knb-lter-mcm.16.
- McKnight, D. M. , and Tate, C. M. , 1997: Canada Stream: a glacial meltwater stream in Taylor Valley, South Victoria Land, Antarctica. Journal of the North American Benthological Society , 16: 14–17.
- McKnight, D. M. , Boyer, E. W. , Westerhoff, P. K. , Doran, P. T. , Kulbe, T. , and Andersen, D. T. , 2001: Spectrofluorometric characterization of dissolved organic matter for indication of precursor organic material and aromaticity. Limnology and Oceanography , 46: 38–48.
- Priscu, J. , 2012: Depths, areas, volumes measured by Jeffrey Schmok (knb-lter-mcm.71.3) (http://tropical.lternet.edu/knb/metacat/knb-ltermcm.71.3/mcm).
- Secretariat of the Antarctic Treaty , 2011 : Management Plan for Antarctic Specially Protected Area No. 131: Canada Glacier, Lake Fryxell, Taylor Valley, Victoria Land. Measure 1-Annex C, 83–94.
- Stedmon, C. A. , and Bro, R. , 2008: Characterizing dissolved organic matter fluorescence with parallel factor analysis: a tutorial. Limnology and Oceanography-Methods , 6: 572–579.
- Stedmon, C. A. , Markager, S. , and Bro, R. , 2003, Tracing dissolved organic matter in aquatic environments using a new approach to fluorescence spectroscopy. Marine Chemistry , 82: 239–254.
- Stumpf, A. R. , Elwood Madden, M. E. , Soreghan, G. S. , Hall, B. L. , Keiser, L. J. , and Marra, K. R. , 2012: Glacier meltwater stream chemistry in Wright and Taylor Valleys, Antarctica: significant roles of drift, dust and biological processes in chemical weathering in a polar climate. Chemical Geology , 322–323: 79–90.
- Takacs, C. D. , Priscu, J. C. , and McKnight, D. M. , 2001: Bacterial dissolved organic carbon demand in McMurdo Dry Valley lakes, Antarctica. Limnology and Oceanography , 46: 1189–1194.
- Tranter, M. , Brimblecombe, P. , Davies, T. D. , Vincent, C. E. , Abrahams, P. W. , and Blackwood, I. , 1986: The composition of snowfall, snowpack and meltwater in the Scottish highlands-Evidence for preferential elution. Atmospheric Environment , 20: 517–525.
- Wagner, G. H. , and Wolf, D. C. , 1999: Carbon transformations and soil organic matter formation. In Sylvia, D. M. , Fuhrmann, J. J. , Hartel, P. G. , and Zuberer, D. A. (eds.), Principles and Applications of Soil Microbiology. Upper Saddle River, New Jersey: Prentice Hall, 218–258.
- Weber, G. , 1960: Fluorescence-polarization spectrum and electronicenergy transfer in tyrosine, tryptophan and related compounds. Biochemical Journal , 75: 335–345.
- Welch, K. A. , Lyons, W. B. , Whisner, C. , Gardner, C. B. , Gooseff, M. N. , McKnight, D. M. , and Priscu, J. C. , 2010: Spatial variations in the geochemistry of glacial meltwater streams in the Taylor Valley, Antarctica. Antarctic Science , 22: 662–672.
- Wu, F. C. , Tanoue, E. , and Lu, C. Q. , 2003: Fluorescence and amino acid characteristics of molecular size fractions of DOM in the waters of Lake Biwa. Biogeochemistry , 65: 245–257.
- Yamashita, Y. , and Tanoue, E. , 2003: Chemical characterization of protein-like fluorophores in DOM in relation to aromatic amino acids. Marine Chemistry , 82: 255–271.
- Yamashita, Y. , Tsukasaki, A. , Nishida, T. , and Tanoue, E. , 2007: Vertical and horizontal distribution of fluorescent dissolved organic matter in the Southern Ocean. Marine Chemistry , 106: 498–509.
- Yamashita, Y. , Cory, R. M. , Nishioka, J. , Kuma, K. , Tanoue, E. , and Jaffe, R. , 2010: Fluorescence characteristics of dissolved organic matter in the deep waters of the Okhotsk Sea and the northwestern North Pacific Ocean. Deep Sea Research Part II , 57: 1478–1485.
- Young, C. L. , and Ingall, E. D. , 2010: Marine dissolved organic phosphorus composition: insights from samples recovered using combined electrodialysis/reverse osmosis. Aquatic Geochemistry , 16: 563–574.