Abstract
Soil temperature and moisture are key determinants of abiotic and biotic processes in arctic-alpine regions. They are important links to understanding complex ecosystem dynamics under changing climate. The aims of this study were to (1) quantify fine-scale soil temperature and soil moisture variation, and (2) assess the influence of vegetation on soil temperature and moisture patterns in a northern European arctic-alpine environment. Inclusion of vegetation variables significantly improved models of soil temperature and moisture, despite abiotic variables (local topography and soil properties) being the most influential predictors. Temperature varied by ≥5 °C and moisture by ≥50% (volumetric water content) over very short distances (≥ 1 m), reflecting the extreme spatial heterogeneity of thermal and hydrological conditions in these systems. These results thus highlight the biotic mediation of changes in abiotic conditions, showing how vegetation can strongly affect local habitat conditions at fine spatial scales in arctic-alpine environments.
Introduction
Soil temperature and soil moisture are key drivers of ecosystem functioning (CitationJohnson and Billings, 1962; CitationBertoldi et al., 2010; CitationCahoon et al., 2012), geomorphological activity (CitationBroll et al., 1999; CitationFrench, 2007; CitationMalanson et al., 2012) and human activities (CitationPost et al., 2009) in arctic-alpine environments. Soil temperature and moisture have fundamental effects on the abiotic and biotic processes determining, for example, microbial activity, biochemical and carbon cycling, nutrient availability, plant growth and reproduction, and earth surface processes (CitationChapin, 1983; CitationLloyd and Taylor, 1994; CitationHodkinson et al., 1999; CitationFrench, 2007; CitationStarr et al., 2008; CitationPape et al., 2009; CitationSaito et al., 2009; CitationLegates et al., 2010; CitationOlefeldt et al., 2012). While soil conditions strongly affect vegetation patterns, plants may also have strong feedback effects on soil thermal and hydrological properties (CitationEhrenfeld et al., 2005), with, for example, shading from plant canopies reducing thermal extremes and evaporative moisture losses (CitationSalisbury and Spomer, 1964; CitationAsbjornsen et al., 2011). For this reason, studies of the impacts of vegetation on soil temperature and moisture can provide important insights into the response of biotic communities and abiotic systems to changing climatic conditions.
Models of soil temperature and moisture in arctic-alpine environments at fine spatial scales (resolution ∼1m) need to incorporate the complex interplay between local topography, soil conditions, and vegetation cover, as these three environmental characteristics strongly affect local thermal and hydrological conditions directly and indirectly (CitationIsard, 1986; CitationTakahashi, 2005; CitationBertoldi et al., 2010; CitationScherrer and Körner, 2011). For example, topography has indirect effects on soil temperature and moisture by affecting snow distribution, incident radiation, and wind exposure (CitationRaupach and Finnigan, 1997; CitationLöffler, 2005; CitationBeniston, 2006; CitationScherrer and Körner, 2011). Topographic conditions may also affect soil properties, with, for example, fine sediments predominating in depressions (CitationFrench, 2007). In turn, soil conditions determine sensible and latent heat exchange between soil and the atmosphere, overland and subsurface water flow, and the zonation of some plant communities (CitationBrubaker and Entekhabi, 1996; CitationEugster et al., 2000; CitationEhrenfeld et al., 2005; CitationLegates et al., 2010). Vegetation regulates snow distribution, radiation at ground level, and heat flux through evapotranspiration (CitationRaich and Tufekcioglu, 2000; CitationKörner, 2003). While relationships among topography, soil characteristics, soil temperature, and moisture are fairly well studied, the biotic impacts of vegetation on these properties are still being explored (see CitationWundram et al., 2010; CitationLiancourt et al., 2012). In general, it is known that dense plant canopies may buffer abiotic conditions strongly, reducing variability in soil temperature and moisture (CitationLegates et al., 2010; CitationGornall et al., 2011). By investigating the relationships among these three parameter groups, we expect to accurately predict soil temperature and moisture across a range of scales.
Recent studies have shown that soil surface temperatures can have remarkable fine-scale variation, with temperatures differing by several degrees over distances of less than one meter (CitationScherrer and Körner, 2010; CitationGraham et al., 2012; CitationLenoir et al., 2013). This magnitude of thermal heterogeneity is ecologically significant as it exceeds the amplitude of many climate warming projections, suggesting that plants will have more potentially suitable habitats within regular dispersal distance (CitationChristensen et al., 2007; CitationLenoir et al., 2008; CitationScherrer and Körner, 2011). Even though these variables’ spatial and temporal variation is known to have great importance to multiple abiotic and biotic systems (CitationBillings and Mooney, 1968; CitationCahoon et al., 2012), surprisingly few studies have focused on explaining fine-scale spatial variation in these parameters in highlatitude environments (e.g. CitationWundram et al., 2010; CitationGraham et al., 2012). This fine-scale heterogeneity, probably driven by local topographical conditions, soil properties, and vegetation characteristics, may exceed coarse-scale (latitudinal and altitudinal gradients) variation over much greater distances (e.g. CitationBillings, 1974).
The biota of arctic-alpine environments is particularly vulnerable to climate change as species in these habitats are frequently highly specialized (CitationBillings and Mooney, 1968; CitationChapin et al., 2000), and the increases in temperatures are predicted to be highest in these regions (CitationAnisimov et al., 2007). Thus, an improved understanding of fine-scale variation in soil temperature and moisture patterns, particularly in relation to topographical, soil, and vegetation variables in arctic-alpine systems, is needed. This is particularly relevant as ongoing changes in vegetation cover in response to environmental change are well documented in this region (CitationEpstein et al., 2012). Specifically, Sturm et al. (Citation2001), Tape et al. (Citation2006), and Kullman (Citation2010) have reported increasing shrub cover in the circumpolar Arctic in response to warming. If vegetation is a key driver of these systems, changes in land cover can trigger feedback mechanisms, the impacts of which are unclear for the global climate system (CitationChapin et al., 2005; CitationTarnocai et al., 2009). Hence, the aim of this study is to (1) quantify fine-scale soil temperature and soil moisture variation in arctic-alpine environment, and (2) assess the influence of vegetation on soil temperature and moisture patterns, after controlling for local topography and soil properties. The study is based on a large field-quantified data set collected in alpine tundra in northwestern Finland.
Data and Methods
STUDY AREA
The study area is located in northwestern Finnish Lapland (69°N, 21°E ). The climate of the area is strongly affected by its high-latitude location and the proximity of the Arctic Ocean and the Scandes Mountains (CitationTikkanen, 2005; CitationAalto et al., 2012). The mean annual temperature at the nearby Kilpisjärvi meteorological station (1981–2010) is -2.9 °C (69°02′N, 20°47′E, 480 m a.s.l.). Mean annual precipitation was 487 mm over the same period, with seasonal snow cover persisting until late June and constraining the length of the growing season (CitationPirinen et al., 2012). The treeline in this region is formed by mountain birch (Betula pubescens ssp. czerepanovii), with vegetation above the treeline characterized by shrubs, dwarf-shrubs, and graminoids almost exclusively comprised of perennial species (CitationAhti et al., 1968).
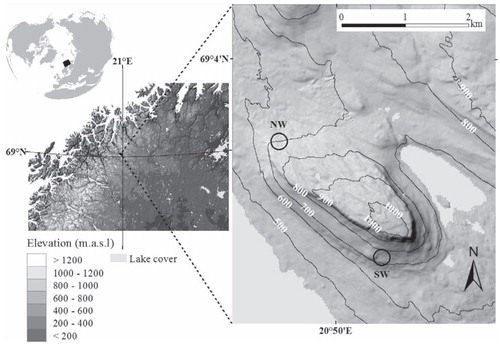
FIGURE 1. The location of the study area in northern Fennoscandia. The panel on the right shows the location of the study sites (empty circles) on the slopes of Mount Saana, with 100-m-interval contour lines indicating elevation.
STUDY SITES AND FIELD DATA
Two study sites are located approximately 100–200 m above the tree limit on the Saana massif, both at an elevation of ca. 700 m a.s.l., but on different aspects (northwest- and southwest-facing slopes; ). Six sampling grids were established at each site, with each grid comprising 160 1 m2 plots in a regular 8 × 20 arrangement. Therefore, the fine-scale data set used in this study comprises 1920 cells surveyed systematically at one-meter intervals.
Both response variables, i.e. soil temperature and moisture (, parts A and B), were measured on two consecutive days (NW site, 16 July 2012; SW site, 17 July 2012). Temperature measurements were made at a depth of 10 cm using a handheld digital temperature probe VWR-TD11 (VWR International, Radnor, Pennsylvania, U.S.A.; accuracy of 0.8 °C). Soil moisture was recorded through a 0- to 10-cm profile by using a time domain reflectometry sensor (FieldScout TDR 100, Spectrum Technologies, Inc., Plainfield, Illinois, U.S.A.; accuracy of 3.0% volumetric water content [VWC]). Where possible, multiple soil moisture measurements were taken within every cell, with mean values used in subsequent analyses. Where substrate was too rocky or shallow (<10 cm deep) to conduct temperature measurements, linear interpolation based on all cells within 2 m was used to estimate temperature (required for 29 cells). Similarly, where soil moisture could not be measured to a depth of 10 cm (212 cells) or measured at all (9 cells), moisture values were interpolated based on the surrounding cells, with observed values (i.e. based on soils shallower than 10 cm) replaced by the interpolated values where the latter exceeded the former (ca. 70% of cases; average absolute difference between interpolated and observed values 5%). Nonetheless, repeating analyses with a smaller data set excluding cells without measurements gave very similar results (results not shown). Re-measurement of soil temperature in 24 cells in the first study grid surveyed (ca. 12-h interval) showed an average increase of 0.8 °C by the end of the measurement period. Linear adjustment for soil temperatures against measuring time was conducted to take into account this warming of the soil during the measurement period. Soil moisture values were not adjusted for measuring time as the conditions in two consecutive days were similar (0.4 mm rainfall in previous 48 h), and the moisture content of the soil was not expected to change rapidly over the time span of measurements (ca. 12 h) (see e.g. CitationPenna et al., 2009).
FIGURE 2. Examples from the study grid number four (NW slope of Mount Saana; see for details) showing the spatial variation of the two response variables (at 1 m2 resolution), (A) soil temperature and (B) soil moisture; and some of the predictor variables (C) meso-topography, (D) peat depth, and (E) vegetation volume. VWC = volumetric water content.
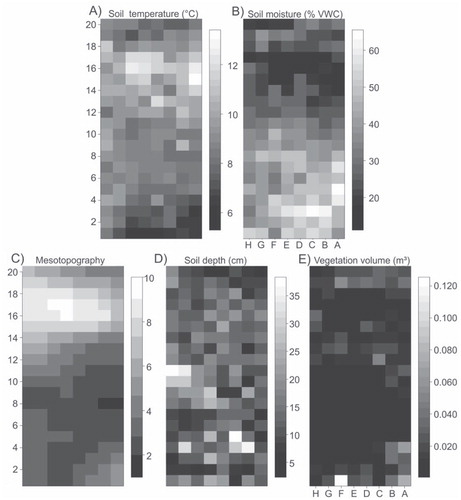
In addition to the two response variables, three groups of predictors (each comprising four variables) were measured and/or calculated: Topography (T), Soil characteristics (S), and Vegetation (V). Topography is related to landforms and therefore, for example, the radiation and hydrological conditions of the soil surface. The four predictor variables related to topography were mesotopography, slope angle, potential annual radiation, and elevation. Mesotopography is a measure of local topography and reflects snow accumulation, solar radiation interception, and drainage patterns (CitationBillings, 1973). It was scored from one (bottom of depression) to 10 (ridge top), following the methodology of Bruun et al. (Citation2006) (, part C). Slope angle, which affects moisture drainage and gravitational processes, was calculated from the height difference between highest and lowest elevation points within each cell. Potential annual direct radiation (MJ cm-2 a-1; assuming clear sky conditions) was calculated from latitude, slope angle, and aspect to describe the radiation conditions on the surface (CitationMcCune and Keon, 2002), and reflects the maximum possible radiation input to a cell. Elevation (m a.s.l.) was extracted from a fine-scale digital elevation model (spatial resolution of 1 m × 1 m) constructed from field observations, in order to describe site-specific variation in local conditions (e.g. meso-scale temperature and distance to snow accumulation sites).
Soil characteristics are related to the thermal and hydrological properties of soil. The four predictors were soil temperature (when modeling soil moisture), soil moisture (when modeling soil temperature), peat depth, and the cover of rock. Peat depth (thickness of the organic layer) and soil depth (cm; thickness of the mineral layer; , part D) were determined by means of three measurements inside each cell, using a thin metal rod to probe the soil (following the methodology of Rose and CitationMalanson, 2012). Due to high moisture-holding capacity, thick peat layers are expected to buffer soil moisture and temperature more strongly than mineral soils, thus describing some of the thermal and hydrological properties of the soil. Cover of rock represents the percentage of bare rock and coarse gravel within each cell with potentially positive effects on temperatures (thermal properties) and negative impacts on soil moistures (porosity).
The impacts of vegetation on soil temperature and moisture are likely dominated by the effects of plants on incident radiation at ground level and hydrological conditions. The four predictors in this group were vegetation volume, biomass, cover of moss, and cover of lichen. Vegetation volume (, part E) was calculated as vegetation cover (in m-2) multiplied by median vegetation height. Dry above-ground biomass from each plot was determined at the peak of growing season following the procedures described in Walker et al. (Citation2003), using one randomly located 20 cm × 20 cm clip harvest plot per cell. The two cover variables (moss and lichen) describe some of thermal and hydrological properties of the surface (CitationAddison and Bliss, 1980; CitationGornall et al., 2011). Lichen cover has effects on soil temperature, for example, by altering the albedo of the soil surface (CitationStoy et al., 2012). Vegetation data were collected in July 2011 and July 2012 during the peak of the growing season. Differences in canopy heights between vascular plants and cryptogams may differentially affect abiotic conditions, as the multiple effects of the four vegetation variables on the soil temperature and moisture are thought to derive from the shading (lowering temperatures), moisture capturing (increase in moisture, decrease in temperature), snow accumulation (increasing moisture), and transpiration (lowering both temperatures and moisture) (CitationEhrenfeld et al., 2005; CitationBlok et al., 2010; CitationWundram et al., 2010).
DATA ANALYSIS
We modeled the relationship between the two responses (soil temperature and moisture) and different predictor groups (Topography, Soil characteristics, and Vegetation) using generalized additive models (GAM; CitationHastie and Tibshirani, 1990; CitationWood, 2006). GAMs were fitted using the R statistics package mgcv with maximum degrees of smoothing restricted to 5 (subsequently optimized by the model fitting function; CitationWood, 2011) and assuming a Gaussian error structure. To normalize the distribution of some explanatory variables (rock cover, biomass, vegetation volume, lichen cover, and moss cover) log-transformation was conducted. There was no strong multicollinearity among the predictor groups (maximum Rspearman = - 0.62).
Predictor groups were first tested separately against the response variables:
Thereafter, the GAMtopo and GAMsoil models were combined to obtain the GAMabiotic model (i.e. only abiotic predictors), which was used as a baseline in subsequent analyses. Finally, GAMfull models, comprising predictors from all three groups (i.e. both abiotic and vegetation variables), were tested. These models were used to predict the variation in soil temperature and moisture patterns across the study grids. Bootstrapping was used to test the significance of model improvement after the inclusion of additional predictor groups (i.e. explanatory power; 1000 repeats; R-package boot). Similarly, the models’ ability to predict soil temperature and moisture was assessed using cross validation with a semi-independent data set (i.e. predictive power; 1000 repeats; 70% random sample).
Spatial autocorrelation is a common property in fine-scale data sets, which may cause uncertainty to model estimates’ significance testing and confidence levels (CitationLegendre et al., 2002). Since our analyses were not focused on the significance of individual parameters, we did not account for spatial autocorrelation; nonetheless, model residuals showed a marked reduction in spatial autocorrelation relative to the raw data ().
Variation partitioning (VP) was used to determine the relative importance of different predictor groups (CitationBorcard et al., 1992). Variation in soil temperature and moisture was decomposed among the three groups of predictors, using a series of regression analyses implemented with generalized linear models (GLM), assuming a Gaussian error distribution (CitationMcCullagh and Neider, 1989; CitationBorcard et al., 1992). Both linear and quadratic terms were included to account for potential non-linear relationships (CitationHeikkinen et al., 2004). The GLMs were fitted using the glm function in R with automatic backward stepwise term selection procedure (based on Akaikes’ Information Criteria, using the stepAIC function for the first three separate predictor models) (CitationAkaike, 1974; CitationZimmermann et al., 2007). When combining the best-fit models for the three groups of predictors for further partitioning, no variable selection technique was used.
VP partitioned variation into eight fractions (calculated following the procedures in CitationAnderson and Gribble, 1998): (a) the percentage of the total variation in soil temperature (or moisture) that is explained by T but not by S or V; (b) the percentage of the total variation in responses that is explained by S but not by T or V; (c) the percentage of the total variation in responses that is explained by V but not by T or S; (d) the percentage of the total variation in responses that is explained by T and/or S, but which cannot be allocated between the two predictor groups (also referred to as joint effects); (e) the percentage of the total variation in responses that is explained by T and/or V; (f) the percentage of the total variation in responses that is explained by S and/or V; (g) the percentage of the total variation in responses that is explained by any of the three groups of explanatory variables (i.e. cannot be partitioned among the three predictor groups); and (h) unexplained variation.
Results
Both soil temperature and moisture varied notably over short distances. Soil temperatures in the NW study site () varied from 2.4 to 13.7 °C and in the SW site from 5.3 to 13.1 °C (), respectively. Similarly, the soil moisture values varied from 4.6 to 90.3% VWC and from 8.1 to 65.2% VWC, respectively. The largest within-grid variation for soil temperature was 8.1 °C and for soil moisture 71.8% VWC (). Soil temperature and moisture were significantly negatively correlated (RSpearman = -0.6, p ≤ 0.001) ().
All the predictor groups were significantly related to soil temperature and moisture (examples of bivariate relationships illustrated in ). The baseline model (i.e. topography + soil characteristics) explained 67.8% of the variation in soil temperature. Adding vegetation predictor variables to the abiotic model significantly improved the proportion of variance explained to 71.8% (with the vegetation variables alone explaining 30.5% of the variation in soil temperature) (, part A). For soil moisture the inclusion of vegetation variables also significantly improved the models” performance; the baseline model explained 55.5% and full model 64.2% of the variation in soil moisture (with the vegetation variables alone explaining 21.1%) (, part A). The bootstrapping result clearly demonstrates how the addition of vegetation predictors to baseline models (i.e. with abiotic variables only) significantly improved the performance (, part A) and predictive power (, part B; ) of the models.
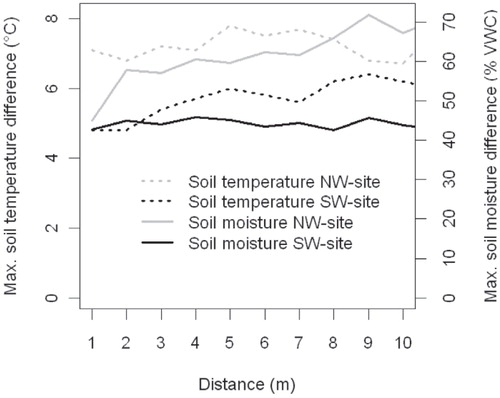
FIGURE 3. The maximum differences in soil temperature and soil moisture as a function of distance between cells.
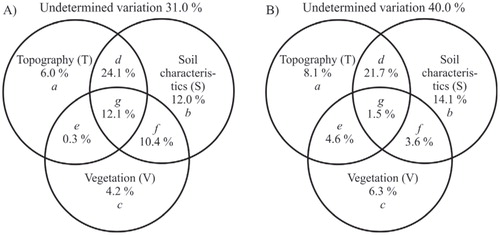
For both soil temperature and moisture, the large majority of explained variation was accounted for by soil characteristics, topography, and their joint contribution (). In both sets of analyses, vegetation properties had the smallest unique contribution (soil temperature: 4.2%; soil moisture: 6.3%).
Discussion
Incorporating vegetation characteristics into soil temperature and moisture models significantly improved their fine-scale predictions. This suggests that vegetation has a clear role mediating soil temperature and moisture patterns in arctic-alpine systems. For both variables it is evident that soil characteristics have the dominant effect, with topography clearly being the second most important group of predictors. Additionally we demonstrate notable spatial variation in soil temperatures and moistures at the spatial scale of 1 m2, in agreement with Wundram et al. (Citation2010) and Scherrer and Körner (Citation2011).
The improvement in model performance after the inclusion of vegetation variables is greater for soil moisture than for temperature, suggesting that vegetation has a stronger direct impact on moisture patterns than temperature. Vegetation may affect soil temperature and moisture through a variety of mechanisms (CitationCahoon et al., 2012; CitationGraham et al., 2012). For soil temperatures, vegetation cover operates as an insulator, leveling out temperature variations. Vegetation also acts through shading, decreasing the amount of direct solar radiation reaching the ground surface (CitationPielke, 2001; CitationBlok et al., 2010) and subsequently lowering and buffering soil temperatures (CitationSalisbury and Spomer, 1964; CitationGraham et al., 2012). For soil moisture, vegetation generally increases the soils’ moisture content as it mediates the soil water fluctuations by reducing the evaporative losses through shading and holding both horizontal and vertical water flow in the soil (CitationDaly and Porporato, 2005; CitationAsbjornsen et al., 2011). On the contrary, abundant vegetation can promote soil drying through intensified transpiration (CitationHorton and Hart, 1998).
FIGURE 4. Relationships between the two response variables (soil temperature and moisture) and explanatory variables from every predictor group (Topography, Soil characteristics, and Vegetation), as modeled using generalized additive models (see text for details). Mesotopography ranged from 1 (bottom of depression) to 10 (ridge top).
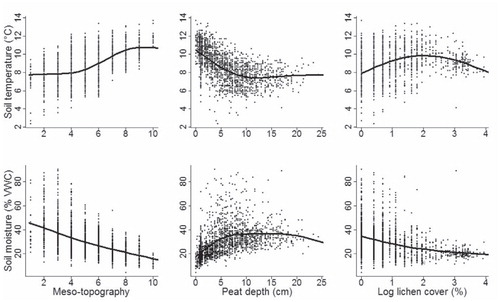
Our results show that soil temperature and moisture are mainly controlled by local topography and soil characteristics (in agreement with e.g. CitationIsard, 1986; CitationWundram et al., 2010; CitationScherrer and Körner, 2011). The toposequence from wind-blown ridge tops to sheltered valley bottoms determines the wind and radiation conditions subsequently controlling the presence, thickness, and duration of the snow cover with multiple effects on two parameters studied (CitationLöffler, 2005; CitationLitaor et al., 2008; CitationPenna et al., 2009). The temperature relationships with soil characteristics are mainly related to different thermal properties of the soils (CitationGraham et al., 2012). Soil moisture is predominantly a function of water-holding capacity (related to soil texture and porosity; CitationLegates et al., 2010) and therefore highest soil moisture contents are found in soils with high organic content (e.g. peat lands). In agreement with Wundram et al. (Citation2010), we argue that the soil temperature (and soil moisture) is even more strongly driven by soil properties than local topographical variables. They made an important finding, however, that high soil moisture content evens out the extreme temperature variations in soil due to wet soils’ thermal conductivity and the high heat capacity of water. Soil moisture correlates negatively with soil temperatures as the increase in soil temperatures increases evaporation and in turn lowers the moisture content of the soils. On the contrary, increased moisture intensifies evapotranspiration, which in turn lowers soil temperature (CitationLegates et al., 2010).
FIGURE 5. Bootstrapped estimates of (A) model performance (adjusted R2 ) and (B) predictive power (adjusted R2) for the soil temperature and soil moisture generalized additive models based on 1000 samples. All models differed significantly (p ≤ 0.001).
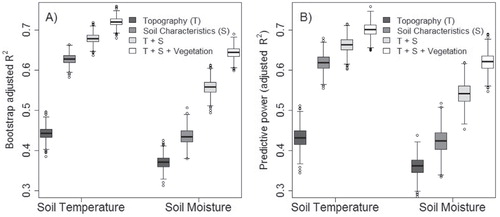
FIGURE 6. The results of the variation partitioning for (A) soil temperature and (B) soil moisture in terms of the proportion/fraction of variation explained. The variation of the response variables is explained by three groups of predictor variables: Topography (T), Soil characteristics (S), and Vegetation (V); a, b, and c are unique effects of T, S, and V, respectively; d, e, f, and g represent their joint effects.
Climate warming will affect multiple feedback loops related to soil temperatures and moisture. For example, the prolonged snow-free period in the Arctic has already caused shifts in vegetation cover and composition (CitationStow et al., 2004; CitationChapin et al., 2005; CitationTape et al., 2006; CitationKullman, 2010; CitationEpstein et al., 2012). The expansion of shrub-dominated vegetation into areas previously dominated by dwarf-shrubs and graminoids may have particularly pronounced consequences for ecosystem dynamics due to the potential for species of this growth form to affect soil moisture and temperature conditions (CitationSturm et al., 2001; CitationBonfils et al., 2012). The greening of the arctic-alpine regions has notable effects on surface energy budget as the reduced albedo in both winter and summer causes more radiation to be absorbed and turned into sensible heat flux, subsequently promoting local warming (CitationChapin et al., 2005; CitationSturm et al., 2005). Arctic areas are major sources of organic C in the soil, and the potential increase in soil temperatures will accelerate the rate of C cycling in ecosystem as it intensifies, for example, the soil respiration rate with possibility for major global implications (CitationLloyd and Taylor, 1994; CitationRaich and Tufekcioglu, 2000; CitationHiltbrunner et al., 2012; CitationOlefeldt et al., 2012).
Therefore, using field-quantified biotic and abiotic data finescale variability in soil temperatures and moistures could be accurately modeled, and the role of vegetation on soil temperature and moisture clearly demonstrated. Thus, to understand the spatial variation in soil temperature and moisture in an arctic-alpine system, vegetation properties should be taken into account. As a potentially major link in the global climate system is partly based on the interaction between soil temperature as well as moisture and vegetation dynamics at high latitudes, the understanding of this is crucial for future climate change impact studies, and the potential feedbacks need to be modeled. When making conclusions about potential habitat shifts or changes in frost-related processes under warming climate, it is important to appreciate the notable finescale variation and complex interplay of these variables caused by numerous environmental factors and not to rely only on coarse resolution climate models based on mean air temperature data.
Conclusions
Our results indicate that vegetation has an important role in mediating soil temperatures and moisture variation at fine spatial scale in the arctic-alpine system. Thus, when modeling soil temperature and moisture, vegetation properties need to be explicitly considered. Extreme variation in temperature and moisture was observed over short distances, reflecting the strong spatial heterogeneity of thermal and hydrological conditions in these systems. As the ongoing changes in pan-Arctic tundra vegetation are highly dependent on both soil temperature and soil moisture, the understanding of these patterns is crucial for fine-scale climate change impact studies.
Acknowledgments
We thank A. Niskanen, S. Suvanto, H. Mod, S. Jääskeläinen, and A. Kulonen for helping collect the data. We also thank Dr. Christophe Randin and one anonymous reviewer for their constructive comments and suggestions. Aalto was funded by the Geography Graduate School of the Academy of Finland, a University of Helsinki grant, and a Societas pro Fauna et Flora Fennica grant. Le Roux and Luoto were funded by the Academy of Finland (Project Number 1140873).
Related Research Data
References Cited
- Aalto, J. , le Roux, P. C. , and Luoto, M. , 2012: The meso-scale drivers of temperature extremes in high-latitude Fennoscandia. Climate Dynamics: https://doi.org/http://dx.doi.org/10.1007/s00382-012-1590-y.
- Addison, P. A , and Bliss, L. C. 1980: Summer climate, microclimate, and energy budget of a polar semidesert on King Christian Island, N.W.T., Canada. Arctic and Alpine Research , 12: 161–170.
- Ahti, T. , Hämet-Ahti, L. , and Jalas, J. , 1968: Vegetation zones and their sections in northwestern Europe. Annales Botanici Fennica , 5 : 169–211.
- Akaike, H. , 1974: A new look at the statistical model identification. IEEE Transactions on Automatic Control , 19: 716–723.
- Anderson, M. , and Gribble, N. , 1998: Partitioning the variation among spatial, temporal and environmental components in a multivariate data set. Australian Journal of Ecology , 23: 158–167.
- Anisimov, O. A. , Vaughan, D. G. , Callaghan, T. V. , Furgal, C. , Marchant, H. , Prowse, T. D. , Vilhjálmsson, H. , and Walsh, J. E. , 2007: Polar regions (Arctic and Antarctic). In Parry, M. L. , Canziani, O. L. , Palutikof, J. P. , Van der Linden, P. J. , and Hanson, C. E. (eds.), Climate Change 2007: Impacts, Adaptation and Vulnerability. Contribution of Working Group II to the Fourth Assessment Report of the Intergovernmental Panel on Climate Change. Cambridge: Cambridge University Press, 653–685.
- Asbjornsen, H. , Goldsmith, G. R. , Alvarado-Barrientos, M. S. , Rebel, K. , Van Osch, F. P. , Rietkerk, M. , Chen, J. , Gotsch, S. , Tobón, C. , Geissert, D. R. , Gómez-Tagle, A. , Vache, K. , and Dawson, T. E. , 2011 : Ecohydrological advances and applications in plant-water relations: a review. Journal of Plant Ecology , 4: 3–22.
- Beniston, M. , 2006: Mountain weather and climate: a general overview and a focus on climatic change in the Alps. Hydrobiologia , 562: 3–16.
- Bertoldi, G. , Notarnicola, C. , Leitinger, G. , Endrizzi, S. , Zebisch, M. , Della Chiesa, S. , and Tappeiner, U. , 2010: Topographical and ecohydrological controls on land surface temperature in an alpine catchment. Ecohydrology , 3: 189–204.
- Billings, W. D. , 1973: Arctic and alpine vegetations: similarities, differences, and susceptibility to disturbance. BioScience , 23: 679–704.
- Billings, W. D. , 1974: Adaptations and origins of alpine plants. Arctic and Alpine Research , 6: 129–142.
- Billings, W. D. , and Mooney, H. , 1968: The ecology of arctic and alpine plants. Biological Reviews , 43: 481–529.
- Blok, D. , Heijmans, M. M. P. D. , Schaepman-Strub, G. , Kononov, A. V. , Maximov, T. C. , and Berendse, F. , 2010: Shrub expansion may reduce summer permafrost thaw in Siberian tundra. Global Change Biology , 16: 1296–1305.
- Bonfils, C. J. W. , Phillips, T. J. , Lawrence, D. M. , Cameron-Smith, P. , Riley, W. J. , and Subin, Z. M. , 2012: On the influence of shrub height and expansion on northern high latitude climate. Environmental Research Letters , 7: 015503, https://doi.org/http://dx.doi.org/10.1088/1748-9326/7/1/015503.
- Borcard, D. , Legendre, P. , and Drapeau, P. , 1992: Partialling out the spatial component of ecological variation. Ecology , 73: 1045–1055.
- Broll, G. , Tarnocai, C. , and Mueller, G. , 1999: Interactions between vegetation, nutrients and moisture in soils in the Pangnirtung Pass area, Baffin Island, Canada. Permafrost and Periglacial Processes , 10: 265–277.
- Brubaker, K. L. , and Entekhabi, D. , 1996: Analysis of feedback mechanisms in land-atmosphere interaction. Water Resources Research , 32: 1343–1357.
- Bruun, H. , Moen, J. , Virtanen, R. , Grytnes, J. , Oksanen, L. , and Angerbjorn, A. , 2006: Effects on altitude and topography on species richness of vascular plants, bryophytes and lichens in alpine communities. Journal of Vegetation Science , 17: 37–46.
- Cahoon, S. M. , Sullivan, P. F. , Shaver, G. R. , Welker, J. M. , and Post, E. , 2012: Interactions among shrub cover and the soil microclimate may determine future Arctic carbon budgets. Ecology Letters , 15: 1415–1422.
- Chapin, F. , 1983: Direct and indirect effects of temperature on Arctic plants. Polar Biology , 2: 47–52.
- Chapin, F. , Sturm, M. , Serreze, M. , McFadden, J. , Key, J. , Lloyd, A. , McGuire, A. , Rupp, T. , Lynch, A. , Schimel, J. , Beringer, J. , Chapman, W. , Epstein, H. , Euskirchen, E. , Hinzman, L. , Jia, G. , Ping, C. , Tape, K. , Thompson, C. , Walker, D. , and Welker, J. , 2005: Role of the land-surface changes in Arctic summer warming. Science , 310: 657–660.
- Chapin, F. S. , McGuire, A. D. , Randerson, J. , Pielke, R. , Baldocchi, D. , Hobbie, S. E. , Roulet, N. , Eugster, W. , Kasischke, E. , Rastetter, E. B. , Zimov, S. A. , and Running, S. W. , 2000: Arctic and boreal ecosystems of western North America as components of the climate system. Global Change Biology , 6: 211–223.
- Christensen, J. H. , Hewitson, B. , Busuioc, A. , Cwen, A. , Gao, X. , Held, I. , Jones, R. , Kolli, R. K. , Kwon, W. T. , Laprise, R. , Magaňa Rueda, V. , Mearns, L. , Menéndez, C. G. , Räisänen, J. , Rinke, A. , Sarr, A. , and Whetton, P. , 2007: Regional climate projections. In Solomon, S. , Qin, D. , Manning, M. , Chen, Z. , Marquis, M. , Averyt, K. B. , Tignor, M. , and Miller, H. L. (eds.), Climate Change 2007: The Physical Science Basis. Contribution of Working Group I to the Fourth Assessment Report of the Intergovernmental Panel on Climate Change. Cambridge and New York: Cambridge University Press, 847–940.
- Daly, E. , and Porporato, A. , 2005: A review of soil moisture dynamics: from rainfall infiltration to ecosystem response. Environmental Engineering Science , 22: 9–24.
- Ehrenfeld, J. G. , Ravit, B. , and Elgersma, K. , 2005: Feedbacks in the plant-soil system. Annual Review of Environment and Resources , 30: 75–115.
- Epstein, H. E. , Raynolds, M. K. , Walker, D. A. , Bhatt, U. S. , Tucker, C. J. , and Pinzon, J. E. , 2012: Dynamics of aboveground phytomass of the circumpolar Arctic tundra during the past three decades. Environmental Research Letters , 7: 015506, https://doi.org/http://dx.doi.org/10.1088/1748-9326/7/1/015506.
- Eugster, W. , Rouse, W. R. , Pielke, R. A. , McFadden, J. P. , Baldocchi, D. D. , Kittel, T. , Chapin, F. S. , Liston, G. E. , Vidale, P. L. , Vaganov, E. , and Chambers, S. , 2000: Land-atmosphere energy exchange in Arctic tundra and boreal forest: available data and feedbacks to climate. Global Change Biology , 6: 84–115.
- French, H. , 2007: The Periglacial Environment. Chichester: John Wiley and Sons, 458 pp.
- Gornall, J. L. , Woodin, S. J. , Jónsdóttir, I. S. , and van der Wal, R. , 2011 : Balancing positive and negative plant interactions: how mosses structure vascular plant communities. Oecologia , 166: 769–782.
- Graham, E. A. , Rundel, P. W. , Kaiser, W. , Yeung, L. , Stealey, M. , and Eric, E. M. , 2012: Fine-scale patterns of soil and plant surface temperatures in an alpine fellfield habitat, White Mountains, California. Arctic, Antarctic, and Alpine Research , 44: 288–295.
- Hastie, T. , and Tibshirani, R. , 1990: Generalized Additive Models. Monographs on Statistics and Applied Probability, vol. 43. New York: Chapman and Hall.
- Heikkinen, R. , Luoto, M. , Virkkala, R. , and Rainio, K. , 2004: Effects of habitat cover, landscape structure and spatial variables on the abundance of birds in an agricultural-forest mosaic. Journal of Applied Ecology , 41: 824–835.
- Hiltbrunner, D. , Zimmermann, S. , Karbin, S. , Hagedorn, F. , and Niklaus, P. A. , 2012: Increasing soil methane sink along a 120-year afforestation chronosequence is driven by soil moisture. Global Change Biology , 18: 3664–3671.
- Hodkinson, I. D. , Webb, N. R. , Bale, J. S. , and Block, W. , 1999: Hydrology, water availability and tundra ecosystem function in a changing climate: the need for a closer integration of ideas? Global Change Biology, 5: 359–369.
- Horton, J. L. , and Hart, S. C. , 1998: Hydraulic lift: a potentially important ecosystem process. Trends in Ecology & Evolution , 13: 232–235.
- Isard, S. A. , 1986: Factors influencing soil moisture and plant community distribution on Niwot Ridge, Front Range, Colorado, U.S.A. Arctic and Alpine Research , 18: 83–96.
- Johnson, P. L. , and Billings, W. D. , 1962: The alpine vegetation of the Beartooth Plateau in relation to cryopedogenic processes and patterns. Ecological Monographs , 32: 105–135.
- Körner, C. , 2003: Alpine Plant Life. 2nd edition. Berlin: Springer, 344 pp.
- Kullman, L. , 2010: A richer, greener and smaller alpine world: review and projections of warming-induced plant cover change in the Swedish Scandes. Ambio , 39: 159–169.
- Legates, D. R. , Mahmood, R. , Levia, D. F. , DeLiberty, T. L. , Quiring, S. M. , Houser, C. , and Nelson, F. E. , 2010: Soil moisture: a central and unifying theme in physical geography. Progress in Physical Geography , 35: 65–86.
- Legendre, P. , Dale, M. , Fortin, M.-J. , Gurevitch, J. , Hohn, M. , and Myers, D. , 2002: The consequences of spatial structure for the design and analysis of ecological field surveys. Ecography , 25: 601–615.
- Lenoir, J. , Gégout, J. C. , Marquet, P. A. , de Ruffray, P. , and Brisse, H. , 2008: A significant upward shift in plant species optimum elevation during the 20th century. Science , 320: 1768–1771.
- Lenoir, J. , Graae, B. J. , Aarrestad, P. A. , Alsos, I. G. , Armbruster, W. S. , Austrheim, G. , Bergendorff, C. , Birks, H. J. B. , Åthen, K. A. , Brunet, J. , Bruun, H. H. , Dahlberg, C. J. , Decocq, G. , Diekmann, M. , Dynesius, M. , Ejrnæs, R. , Grytnes, J. A. , Hylander, K. Klanderud, K. , Luoto, M. , Milbau, A. , Moora, M. , Nygaard, B. , Ödland, A. , Ravolainen, V. T. , Reinhardt, S. , Sandvik, S. M. , Schei, F. H. , Speed, J. D. M. , Tveraabak, L. U. , Vandvik, V. , Velle, L. G. , Virtanen, R. , Zobel, M. , and Svenning, J. C. 2013: Local temperatures inferred from plant communities suggest strong spatial buffering of climate warming across Northern Europe. Global Change Biology : https://doi.org/http://dx.doi.org/10.1111/geb.12129.
- Liancourt, P. , Sharkhuu, A. , Ariuntsetseg, L. , Boldgiv, B. , Helliker, B. R. , Plante, A. F. , Petraits, P. S. , and Casper, B. B. , 2012: Temporal and spatial variation in how vegetation alters the soil moisture response to climate manipulation. Plant Soil , 351: 249–261.
- Litaor, M. I. , Williams, M. , and Seastedt, T. R. , 2008: Topographic controls on snow distribution, soil moisture, and species diversity of herbaceous alpine vegetation, Niwot Ridge, Colorado. Journal of Geophysical Research-Biogeosciences , 113: G02008, https://doi.org/http://dx.doi.org/10.1029/2007JG000419.
- Lloyd, J. , and Taylor, A. , 1994: On the temperature dependence of soil respiration. Functional Ecology , 8: 315–323.
- Löffler, J. , 2005: Snow cover dynamics, soil moisture variability and vegetation ecology in high mountain catchments of central Norway. Hydrological Processes , 19: 2385–2405.
- Malanson, G. P. , Bengtson, L. E. , and Fagrem, D. B. , 2012: Geomorphic determinants of species composition of alpine tundra, Glacier National Park, U.S.A. Arctic, Alpine, and Alpine Research , 44: 197–209.
- McCullagh, P. , and Nelder, J. A. , 1989: Generalized Linear Models. 2nd edition. New York: Chapman & Hall, 511 pp.
- McCune, B. , and Keon, D. , 2002: Equations for potential annual direct incident radiation and heat load. Journal of Vegetation Science , 13: 603–606.
- Olefeldt, D. , Turetsky, M. R. , Crill, P. M. , and McGuire, A. D. , 2012: Environmental and physical controls on northern terrestrial methane emissions across permafrost zones. Global Change Biology , 19: 589–603, https://doi.org/http://dx.doi.org/10.1111/gcb.12071.
- Pape, R. , Wundram, D. , and Löffler, J. , 2009: Modelling near-surface temperature conditions in high-mountain environments: an appraisal. Climate Research , 39: 99–109.
- Penna, D. , Borga, M. , Norbiato, D. , and Dalla Fontana, G. , 2009: Hillslope scale soil moisture variability in a steep alpine terrain. Journal of Hydrology , 364: 311–327.
- Pielke, R. A. , 2001: Influence of the spatial distribution of vegetation and soils on the prediction of cumulus convective rainfall. Review of Geophysics , 39: 151–177.
- Pirinen, P. , Simola, H. , Aalto, J. , Kaukoranta, J.-P. , Karlsson, P. , and Ruuhela, R. , 2012: Climatological statistics of Finland 1981–2010. Finnish Meteorological Institute Reports , 2012, 25 pp.
- Post, E. , Forchhammer, M. , Bret-Harte, S. , Callaghan, T. , Christensen, T. , Elberling, B. , Fox, A. , Gilg, O. , Hik, D. , Høye, T. , Ims, R. , Jeppesen, E. , Klein, D. , Madsen, J. , McGuire, A. , Rysgaard, S. , Schindler, D. , Stirling, I. , Tamstorf, M. , Tyler, N. , van der Wal, R. , Welker, J. , Wookey, P. , Schmidt, N. , and Aastrup, P. , 2009: Ecological dynamics across the Arctic associated with recent climate change. Science , 325: 1355–1358.
- Raich, J. W. , and Tufekcioglu, A. , 2000: Vegetation and soil respiration: correlations and controls. Biogeochemistry , 48: 71–90.
- Raupach, M. R. , and Finnigan, J. J. , 1997: The influence of topography on meteorological variables and surface-atmosphere interactions. Journal of Hydrology , 190: 182–213.
- Rose, J. P. , and Malanson, G. P. , 2012: Microtopographic heterogeneity constrains alpine plant diversity, Glacier National Park, MT. Plant Ecology , 213: 955–965.
- Saito, M. , Kato, T. , and Tang, Y. , 2009: Temperature controls ecosystem CO2 exchange of an alpine meadow on the northeastern Tibetan Plateau. Global Change Biology , 15: 221–228.
- Salisbury, F. B. , and Spomer, G. G. , 1964: Leaf temperatures of alpine plants in the field. Planta , 60: 497–505.
- Scherrer, D. , and Körner, C. , 2010: Infra-red thermometry of alpine landscapes challenges climatic warming projections. Global Change Biology , 16: 2602–2613.
- Scherrer, D. , and Körner, C. , 2011: Topographically controlled thermal-habitat differentiation buffers alpine plant diversity against climate warming. Journal of Biogeography , 38: 406–416.
- Starr, G. , Oberbauer, S. F. , and Ahlquist, L. E. , 2008: The photosynthetic response of Alaskan tundra plants to increased season length and soil warming. Arctic, Antarctic, and Alpine Research , 40: 181–191.
- Stow, D. A. , Hope, A. , McGuire, D. , Verbyla, D. , Gamon, J. , Huemmrich, F. , Houston, S. , Racine, C. , Sturm, M. , Tape, K. , Hinzman, L. , Yoshikawa, K. , Tweedie, C. , Noyle, B. , Silapaswan, C. , Douglas, D. , Griffith, B. , Jia, G. , Epstein, H. , Walker, D. , Daeschner, S. , Petersen, A. , Zhou, L. , and Myneni, R. , 2004: Remote sensing of vegetation and land-cover change in Arctic tundra ecosystems. Remote Sensing of Environment , 89: 281–308.
- Stoy, P. C. , Street, L. E. , Prieto-Blanco, A. , and Ewing, S. A. , 2012: Temperature, heat flux, and reflectance of common subarctic mosses and lichens under field conditions: might changes to community composition impact climate-relevant surface fluxes? Arctic, Antarctic, and Alpine Research , 44: 500–508.
- Sturm, M. , Racine, C. , and Tape, K. , 2001: Increasing shrub abundance in the Arctic. Nature , 411: 546–547.
- Sturm, M. , Schimel, J. , Michaelson, G. , Welker, J. M. , Oberbauer, S. F. , Liston, G. E. , Fahnestock, J. , and Romanovsky, V. E. , 2005: Winter biological processes could help convert Arctic tundra to shrubland. BioScience , 55: 17–26.
- Takahashi, K. , 2005: Seasonal changes in soil temperature on an upper windy ridge and lower leeward slope in Pinus pumila scrub on Mt. Shogigashira, central Japan. Polar Bioscience , 18: 82–89.
- Tape, K. , Sturm, M. , and Racine, C. , 2006: The evidence for shrub expansion in northern Alaska and the pan-Arctic. Global Change Biology , 12: 686–702.
- Tarnocai, C. , Canadell, J. G. , Schuur, E. A. G. , Kuhry, P. , and Mazhitova, G. , 2009: Soil organic carbon pools in the northern circumpolar permafrost region. Global Biogeochemical Cycles , 23: GB2023, http://dx.doi.org/10.1029/2008GB003327.
- Tikkanen, M. , 2005: Climate. In Seppälä, M. (ed.), The Physical Geography of Fennoscandia. Oxford: Oxford University Press, 432 pp.
- Walker, D. A. , Esptein, H. E. , Jia, J. G. , Balser, A. , Copass, C. , Edwards, E. J. , Gould, W. A. , Hollingsworth, J. , Knudson, J. , Maier, H. A. , Moody, A. , and Raynolds, M. K. , 2003: Phytomass, LAI, and NDVI in northern Alaska: relationships to summer warmth, soil pH, plant functional types, and extrapolation to the circumpolar Arctic. Journal of Geophysical Research, 108: 8169, https://doi.org/http://dx.doi.org/10.1029/2001JD000986.
- Wood, S. , 2006: Generalized Additive Models: an Introduction with R. London: Chapman & Hall, 416 pp.
- Wood, S. , 2011: Fast stable restricted maximum likelihood and marginal likelihood estimation of semiparametric generalized linear models. Journal of the Royal Statistical Society , 73: 3–36.
- Wundram, D. , Pape, R. , and Löffler, J. , 2010: Alpine soil temperature variability at multiple scales. Arctic, Antarctic, and Alpine Research , 42: 117–128.
- Zimmermann, N. , Edwards, T., Jr. , Moisen, G. , Frescino, T. , and Blackard, J. , 2007: Remote sensing-based predictors improve distribution models of rare, early successional and broadleaf tree species in Utah. Journal of Applied Ecology , 44: 1057–1067.
APPENDIX
FIGURE A1. Correlograms for raw data and residuals of two generalized additive model (GAM) specifications (GAMabiotic and GAMfull) indicating presence or absence of spatial autocorrelation in the terms of Moran's I. (A) Soil temperature, (B) soil moisture. Statistical significance is presented with filled boxes (p ≤ 0.05) and empty circles (not significant).
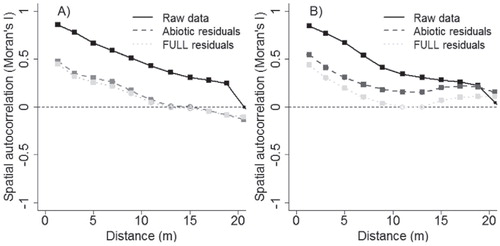
TABLE A1 The means and standard deviations for all of the measured variables. The significance of the differences between the study sites (see for details) was tested using Mann-Whitney U-tests and indicated as: *** p ≤ 0.001; ** p ≤ 0.01; n.s. = not significant.
FIGURE A2. The relationship between soil temperature and soil moisture based on bivariate GAM modeling. VWC = volumetric water content.

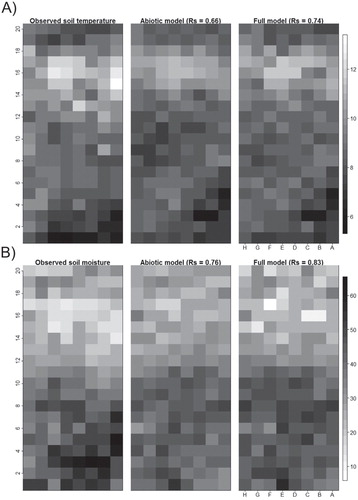
FIGURE A3. Observed and predicted patterns of (A) soil temperature (°C) and (B) soil moisture (% VWC) inside the study grid number four (NW slope of Mount Saana; see for details). The predictions are based on two GAM specifications (GAMabiotic and GAMfull) with semi-independent calibration set (i.e. no observations from grid four was used for predictions). Spearman's correlation coefficients (Rs) between observed and predicted values are also presented.