
Abstract
The climatological conditions for the presence of palsas in the Hudson Bay Lowlands (HBL) in Ontario, Canada, are examined using data from four climate stations: Big Trout Lake, Lansdowne House, Peawanuck, and Fort Severn. These stations sandwich the existing region where palsas occur. The criteria for the formation and occurrence of palsas that were taken from the literature on Fennoscandian and neighboring Québec palsas were applied to the HBL. Thermal thresholds set at -2 °C and 0 °C mean annual air temperature, and number of days below -10 °C per year were met for the two more northerly locations; the two southerly locations were on the edge of the thresholds. Climate projections from two models under two emission scenarios for the 2020s, 2050s, and 2080s indicated that by the 2080s all four locations would fail the -2 °C threshold for palsa formation but at three locations the 0 °C threshold for palsa presence was met for some projection scenarios. Over the next century, it is likely that the climate conditions will continue to be capable of supporting existing palsas; however, by the end of the century the threshold criteria for new palsa formation will not be met for most of the HBL.
Introduction
A palsa is a geomorphological formation that often appears as a dome-shaped circular mound that has a permafrost core and alternating layers of segregated ice lenses with frozen peat at the surface (Citationvan Everdingen, 1998; CitationPissart, 2002). The surface of the palsa consists of an active layer that experiences summer thawing and winter freezing. Palsas range in size from 0.5 to 12 m high, meters to tens of meters in diameter, and are located primarily in bogs within the subarctic regions of the world (CitationSeppälä, 1986; CitationZuidhoff and Kolstrup, 2000; CitationLewkowicz and Coultish, 2004; CitationVallée and Payette, 2007; CitationKujala et al,, 2008; CitationThibault and Payette, 2009; CitationCyr and Payette, 2010; CitationSaemundsson et al., 2012). Specifically, palsas are present in the northern hemisphere in areas such as northern Canada, Alaska, Iceland, northern Scandinavia, and Siberia (CitationSeppälä, 1986; CitationZuidhoff and Kolstrup, 2000; CitationGurney, 2001, CitationHinkel et al., 2001, CitationKirpotin et al., 2009). In this work, we examined the behavior of palsas in the Hudson Bay Lowlands (HBL) of northern Ontario, Canada, a region of palsas that has not been studied in detail (CitationTam, 2009) in the context of climate change.
Palsas are underlain primarily by discontinuous permafrost and provide surface evidence of the underlying permafrost (CitationSeppälä, 1986; CitationKujala et al., 2008; CitationKirpotin et al., 2009). Therefore, studying the state and location of palsas in fact provides an insight into the state and location of the permafrost itself, which covers vast regions of the northern hemisphere (CitationLuoto et al., 2004; CitationKujala et al., 2008; CitationTam, 2009). The literature indicates that a mean annual air temperature (MAAT) of -2 °C or lower is necessary for palsa formation; however, they have been observed at greater temperatures (CitationSeppälä, 1986; CitationParviainen and Luoto, 2007; CitationKujala et al., 2008). For Canada, the MAAT observed for palsa presence is 0 °C in northern Québec (CitationCyr and Payette, 2010). In the majority of locations, including the HBL, palsas are located at the southernmost limit of discontinuous permafrost where the -2 °C palsa formation threshold is located, and are therefore very sensitive to any type of climatic changes.
The thermal thresholds reflect the thermodynamic heat loss necessary for the maintenance of the ice lens. In addition, the material covering the lens must have seasonally varying thermal conductivity to minimize heat gained in the warmer seasons and accentuate heat loss in the colder seasons. Peat provides the ideal ground cover for palsas in the HBL and elsewhere. Peat has a particularly low thermal conductivity when it is dry and unfrozen (0.37–0.79 W m-1 K-1); the conductivity increases with moisture (0.46–1.38 W m-1 K-1) and dramatically increases when frozen (CitationGough and Leung, 2002; CitationKujala et al., 2008). Thus, a climate that has low precipitation in the summer and higher precipitation in advance of the winter season is ideal for palsa formation and this scenario tends to be the case in Fennoscandia (CitationParviainen and Luoto, 2007). In addition, the dome shape of the palsa enables wind to reduce the snow cover on palsas, hence minimizing the thermal insulation of snow cover allowing for more winter heat loss.
As a result of the considerations outlined above, other climate indicators have been found to be important. These include winter temperature (CitationSeppälä, 1986) with a constraint of 120 days or more of the year lower than -10 °C for palsas in Sweden. Furthermore, Parviainen and Luoto (Citation2007) suggested that 500 mm yr-1 in precipitation with relative minima during the summer and winter months is optimum for palsa formation and occurrence. Other factors include July and January temperatures, continentality, vegetation, hydrology, and thawing degrees days; however, we acknowledge that these measures are not necessarily independent.
In this paper we examine specific research questions, including: (1) Can climate criteria for palsas in the HBL be determined by analyzing climate data from available weather stations at the northern and southern palsa limits? (2) If so, what is the projected fate of palsas in the HBL using climate change projections for the region as has been done elsewhere (e.g. CitationFronzek et al., 2006)?
Study Area
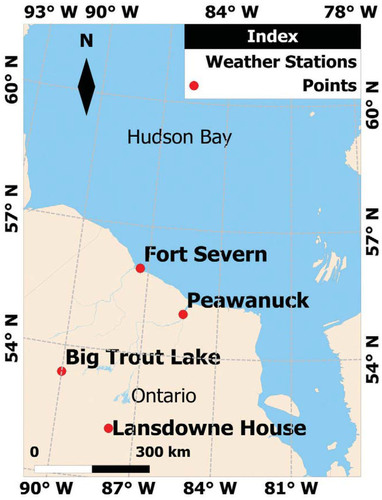
The study area is situated within the HBL in a region that lies between Fort Severn and Peawanuck, Ontario, near the Hudson Bay coast, and Big Trout Lake and Lansdowne House, Ontario (). Tam (Citation2009) identified the location of palsas in the Peawanuck area and further south, and within 20 km south of Fort Severn. Two of the authors (Kowal and Xie) observed palsas in an aerial survey during the summer of 2011 (54°12′N, 88°54′W), 80 km northeast of Big Trout Lake. As reported by Tam (Citation2009), this cross section of palsas is part of a wide band of palsas extending from the Manitoba border to James Bay. Big Trout Lake is 314 km southwest of Peawanuck and 290 km south-southwest of Fort Severn. Since the Big Trout Lake/Fort Severn transect is roughly perpendicular to the palsa band, the palsa band is estimated to be just over 220 km in width.
FIGURE 1. The study area—the Hudson Bay Lowlands of northern Ontario, Canada.
Methods
CLIMATE DATA
Climate data from Big Trout Lake (53°50′N, 89°52′W), Lansdowne House (52°14′N, 87°53′W), Peawanuck (54°59′N, 85°26′W), and Fort Severn (56°01′N, 87°35′W) were examined using palsa criteria developed for other palsa regions (CitationSeppälä, 1986; CitationParviainen and Luoto, 2007; CitationKujala et al., 2008). Big Trout Lake and Lansdowne House are situated to the south of the HBL palsa regions (). Peawanuck and Fort Severn are at the northern extent of the palsa region, both located close to the Hudson Bay coast. Daily temperature (daily minimum, maximum, and mean) and precipitation data of varying temporal spans were available for all four locations (Big Trout Lake, 1951–2010; Lansdowne House, 1953–2010; Peawanuck, 1986–2010; Fort Severn, 2006–2010) (CitationEnvironment Canada, 2012). However, due to significant data gaps in the minimum, maximum, and mean temperatures, the data sets from 1990, 1992–1994, 1996–1997, 2006, and 2008–2010 could not be applied in this work.
Projection data for Big Trout Lake and Lansdowne House were available using two climate models and statistical downscaling. For Peawanuck and Fort Severn, climate model projection data were used directly as described below.
DATA ANALYSIS
Garnered from the palsa literature, the following threshold criteria for palsa formation and occurrence were examined and compiled in for mean annual air temperature ≤ -2 °C (CitationKujala et al., 2008); ≤0 °C (CitationCyr and Payette, 2010); 120 days or more per year below -10 °C (Seppälä, 1986). The following optimum ranges were compiled: annual precipitation, 497 ± 78.8 mm; winter precipitation, 89.6 ± 27.1 mm; summer precipitation, 184 ± 16.4; July temperature, 11.1 ± 1.05 °C; January temperature, -15.8 ± 2.84 °C; continentality, 26.9 ± 3.53 °C (CitationParviainen and Luoto, 2007). Continentality was calculated as the difference between the mean temperature of the warmest and coldest months.
The HBL relevant palsa thresholds were used when examining the statistically downscaled projection data for Big Trout Lake and Lansdowne House. These projections were produced in a two-step process for Big Trout Lake and Lansdowne House. First, projection data were obtained from coarse resolution climate models for grid boxes corresponding to their locations. A statistical downscaling model (SDSM) was then used to statistically link locally collected observational data (1961–1990) to simulations for the same period (CitationWilby and Dawson, 2012). This enabled the linking of larger scale climate variables with their local manifestation. These relationships were then used to down-scale the coarse resolution climate projections to these localities, providing better spatial and temporal resolution. This technique has two steps. The first is a correlation analysis between site-specific observations and large scale flow taken from globally gridded atmospheric and surface observations. For each location, the relevant large-scale flow variables are used to build a statistical model of the local conditions. In the second step, projection data of the large-scale flow is used to reverse the process and generate a local projection for the given location. A weather generator is also used to achieve the required temporal resolution. This technique was not applied to Peawanuck and Fort Severn due to a lack of climatological baseline data for the 1961–1990 period. The climate models used were CGCM2 and HadCM3 with resolutions at 3.75° × 3.75°and 3.75° × 2.5° latitude and longitude, respectively. The former (CGCM2) is the Canadian coupled climate model (CitationFlato and Boer, 2001; CitationKim et al., 2002, Citation2003) and the latter (HadCM3) is the British Hadley Centre model (CitationCollins et al., 2001). Two emission scenarios from the Intergovernmental Panel on Climate Change (IPCC) Special Report on Emissions Scenarios (SRES) were used, A2 and B2 (CitationNakićenović, 2000; CitationNakićenović and Swart, 2000). A2 represents a world of rapid economic growth, increasing population, regionalization of economic and environmental policy, and is often referred to as “business as usual” with high emissions of atmospheric carbon dioxide reaching 860 ppm by 2100 (CitationLewis and Lamoureux, 2010). B2 is also regional with a slower but steady growth in population, however with more emphasis on environmental policy designed to reduce greenhouse gas emissions; in this scenario, carbon dioxide concentrations reach 600 ppm by 2100 (CitationGough and Leung, 2002). As presented below the downscaling worked well for temperature but was not successful for precipitation and thus not used for climate projection of precipitation. For the purposes of model evaluation, the climate model output was used directly.
TABLE 1 Criteria for palsas for the Hudson Bay Lowlands.
For Peawanuck and Fort Severn, in the absence of down-scaled results, we have also used projections from the climate models directly, acknowledging that these have coarse resolution and that the results therefore cover a broader area and were not linked to surface observations. These were done for the A2 and B2 emission scenarios.
Results
CLIMATE DATA ANALYSIS
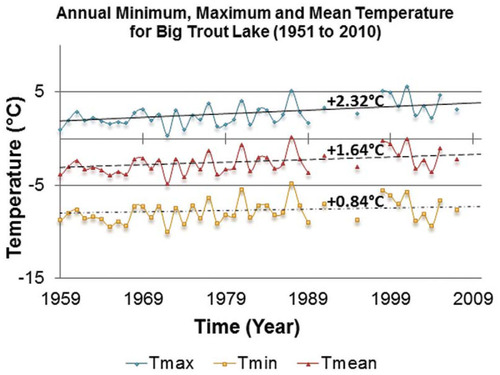
The historical trends in temperature are presented in for Big Trout Lake and are representative of the HBL region located between Fort Severn and Lansdowne House. The averaged minimum daily temperature (Tmin), the averaged maximum daily temperature (Tmax) and the averaged mean daily temperature (Tmean) are shown in with increasing trends. Seasonally (not shown), all seasons except for the fall are warming, similar to the results of Gagnon and Gough (Citation2002).
Table 2 summarizes the climate data analysis examining palsa climate ranges. The -2 °C and 0 °C thresholds were met for the HBL palsas as was the 120 days below -10 °C per year threshold. However, for Lansdowne House and Big Trout Lake only the winter precipitation optimum range was met; there was insufficient precipitation data for Peawanuck and Fort Severn to make a determination. In addition, the July temperature optimum range was met in Fort Severn, but the three other locations exceeded this range. Otherwise, the HBL tends to have considerably more precipitation and greater continentality, with warmer temperatures in July and colder in January.
FIGURE 2. Temperature trends for Big Trout Lake for the period 1951–2010. Due to incomplete data, the following years could not be applied: 1990, 1992–1994, 1996–1997, 2006, and 2008–2010.
We note that although Peawanuck and Fort Severn are located at the northern edge of the palsa occurrence within the HBL, it may be incorrect to use climate data from these stations as indicators of the northward extent of potential palsa development. In this instance the physical boundary of land and sea (Hudson Bay) prevents a potentially more northerly extent of palsas and we note that palsas do exist further north in Québec.
We observe that the HBL sites exhibit much greater continentality than does Fennoscandia, and slightly higher values of continentality for the inland sites (Lansdowne House and Big Trout Lake). Winter extrema are similar for all four sites, which is a reflection of the complete ice cover for Hudson Bay during January. The marine influence on temperature is more clearly seen in the July temperatures for Peawanuck and Fort Severn.
CLIMATE PROJECTIONS
Downscaled climate projections were produced for Big Trout Lake and Lansdowne House using two climate models that performed well in comparison to the observed temperature for the climatic baseline period of 1961–1990 (). The difference between modeled MAAT results and observations was 0.2 °C or less for both locations. The modeled precipitation tends to be scattered on both sides of the observed values for both of the locations, with CGCM2 producing higher values and HadCM3 producing lower values for the annual precipitation. Winter precipitation was over-simulated for both models and summer precipitation was under-simulated. As a result of this lack of consistency in reproducing the observed climate, we will focus on the temperature thresholds for palsa formation and occurrence, the MAATs, and number of days below -10 °C per year.
Table 2 Evaluation of four weather/climate stations in the HBL with respect to identified criteria for palsas. Lansdowne House and Big Trout Lake are located south of the southern extent of palsas, whereas Peawanuck and Fort Severn are located along the Hudson Bay coast within 20 km of the observed palsas (CitationTam, 2009).
MAAT THRESHOLD
Projected MAAT values are reported in for the four weather stations. For Big Trout Lake, the -2 °C threshold derived from Fennoscandian palsas is attained for all four model simulations for the 2020s (2010–2039), for only one in the 2050s (2040–2069), and for none in the 2080s (2070–2099). The net warming by the end of the 2080s is approximately 2 °C with a slightly warmer response with the CGCM2 than with the HadCM3. For Lansdowne House the threshold was not met during the baseline period, and consistent with Big Trout Lake, a gradual warming of approximately 2 °C was projected by the end of the 2080s, with all four simulations indicating a MAAT of greater than 0 °C. Peawanuck shows a baseline temperature 0.6 °C warmer than the observations from Peawanuck () for CGCM2 but 0.9 °C cooler for HadCM3. Both models indicate a stronger warming for these two near-coastal sites compared to the inland sites of Big Trout Lake and Lansdowne House, with a warming by the end of the 2080s of over 6 °C for CGCM2 and 5 °C for HadCM3 using the A2 scenario. The magnitude of warming was substantially lower using the B2 scenario.
TABLE 3 Observed climate and downscaled climate projections for Big Trout Lake and Lansdowne House.
For both models, the -2 °C threshold is not attained by the 2080s, and for CGCM2 this threshold was also not attained by the 2020s and 2050s. At the 2050s horizon, the two models differ greatly. Fort Severn has identical results for HadCM3 as Peawanuck, which is likely a reflection of the coarse resolution of the data. For HadCM3 the two locations share the same grid box, whereas for CGCM2 their data come from neighboring grid boxes. The latter might explain the warmer response under CGCM2 scenarios. The CGCM2 results indicate a colder temperature for Fort Severn than Peawanuck, which is consistent with its more northerly location, and in this case is identical to the HadCM3 result with only a difference of 0.2 °C from the observations (). By the 2080s the CGCM2 results for these locations indicate a warming of close to 8 °C for the A2 scenario, the largest of the four locations. This CGCM2 model also shows the location failing the -2 °C threshold by the 2050s for both the A2 and B2 scenarios; however, the Had-CM3 projection did not fail the threshold for the 2050s, although it did by the 2080s.
Assessment using the 0 °C threshold derived from the adjacent Québec region was applied to all four weather stations; there was a transformational trend shift towards the latter years of the projected emission scenarios. For Big Trout Lake, the condition for palsa occurrence is met well into the 2080s for the two models under the A2 and B2 emission scenarios. For Lansdowne House, the threshold is met until the 2020s based on the CGCM2 model and until the 2050s for the HadCM2 model. At Peawanuck, again under coarse resolution, the palsa condition is met until the 2020s under the CGCM2 model, until the 2050s with HadCM3 under A2 emission scenario, and until the 2080s with HadCM3 under the B2 emission scenario. At Fort Severn, the condition for palsa occurrence was met into the 2050s; however, by the 2080s only HadCM3 under the B2 emission scenario met the conditions at the 0 °C threshold.
Number of Days below -10 °C per Year
The projected number of days below -10 °C per year was reported in for Big Trout Lake and Lansdowne House. This analysis was not done for Peawanuck and Fort Severn as the coarse resolution climate model data were available on a monthly and not a daily basis as is required for this metric. Although Big Trout Lake meets this criterion for its baseline, it is at the cusp of this threshold and falls just below the threshold for the 2020s and onwards for both climate models. The models differ only in the magnitude of reduction of days below the threshold. By the 2080s, the range of days for these models and scenarios is 56 to 84 representing a reduction of 30% to more than 50%. However, it should be noted that most of this reduction occurs after the 2050s, and before then the reduction ranged from 8 to 22%.
TABLE 4 Projected MAAT values for the four weather stations.
Discussion
This study provides a first-time climate change assessment for the HBL with a particular focus on climate variables related to the formation and occurrence of palsas. To determine climate variables that influence palsa formation and occurrence in the HBL, climate data from weather and climate stations at the northern and southern palsa limits were analyzed. Criteria used to determine the formation and occurrence of palsa formation in the HBL were imported for comparison from other areas of the world that host palsas, in particular Fennoscandia and Québec. First, these criteria were evaluated locally for the climate conditions of the HBL. The region met the thermal requirement thresholds derived from Fennoscandian palsas on MAATs and number of days below -10 °C per year. For the optimum ranges, the July temperatures in the HBL were warmer and January temperatures cooler, leading to greater continentality. In addition, the moisture regime differed with more total precipitation and more summertime precipitation.
We note that due to the limited availability of climate data, and lack of continuous data, we were only able to frame the HBL palsa region with two climate stations (Big Trout Lake and Lansdowne House) just south of the southern extent of HBL palsas and two stations (Peawanuck and Fort Severn) at the northern edge, along the Hudson Bay coast. For the more complete climate data sets (Big Trout Lake and Lansdowne House) we were able to generate downscaled results to examine climate model projections with more temporal resolution (needed for the days below -10 °C metric). For Peawanuck and Fort Severn, the historical data were too sparse to conduct statistical down-scaling and, therefore, we relied on coarse resolution climate model projections at these two stations. In addition, the precipitation record for these two stations was too sparse; this prevented a reliable characterization of the precipitation regime. It should be noted that the role of precipitation and soil hydrology are key factors in the formation, preservation, and degradation of the palsa life cycle (CitationSeppälä, 1986); however, without reliable precipitation and soil moisture data in this region, the influence of these factors on HBL palsa formation and occurrence could not be fully determined.
This study further examines the climate change impacts on palsas by applying climate change projections under A2 and B2 emission scenarios, using the identified climate thresholds for palsas in the HBL. We recognize that the projection data analysis focuses on climate conditions based on thermal requirements that are fundamental for palsa genesis, growth, and sustenance. Due to the lack of reliable precipitation and continuous temperature data, we focused on the changes using the -2 °C (Fennoscandian) and 0 °C (Québec) MAAT climate thresholds, and the 120 days below -10 °C per year threshold in examining the climate projections. Although we used two models (CGCM2 and HadCM3) under two emissions scenarios (A2 and B2), this does not necessarily mean that palsas will rapidly disappear in the HBL region. It is important to consider that the existing structures have a considerable thermal inertia that will require a succession of years of an energy imbalance to completely thaw the existing palsas. Estimation of when palsas may disappear from the HBL is beyond the framework of this analysis and would require the use of further palsa modeling (e.g.,CitationAn and Allard, 1995).
Conclusion
Our study identified thermal thresholds for the formation and occurrence of HBL palsas and examined how these thresholds are met using climate projections for the remainder of the century. Our results indicate that (1) the climate conditions for palsa genesis and growth in the HBL are already close to the threshold for viability under the current climate conditions, and (2) the climate conditions by the end of the century will not be able to support the genesis of palsas and will likely contribute to palsa degradation. The Big Trout Lake and Lansdowne House results showed that current conditions are near the edge of the -2 °C MAAT thresholds and that throughout the rest of this century, the thresholds will increasingly not be met due to a warming of approximately 2 °C, which can result in a substantial reduction (exceeding 50% in some scenarios) of the days below -10 °C. Under the 0 °C MAAT threshold, Big Trout Lake can maintain favorable conditions for palsa occurrence until the end of the century; however, the Lansdowne House region will experience a different fate as the climate may become unfavorable earlier, surpassing 0 °C by mid-century. The projected temperature changes at coastal Peawanuck and Fort Severn climate stations were considerably larger by a factor of at least two, and in one instance by a factor of four, more than the warming of the two inland weather stations. This attribute reflects concurrent changes in the sea ice distribution of the Hudson Bay with an effective elimination of the wintertime ice platform by the 2050s (CitationGagnon and Gough, 2005). Although we were not able to address the 120 days below -10 °C threshold metric for Peawanuck and Fort Severn, due to incomplete and unavailable climate data, this metric is not independent of the MAAT. Thus, it is reasonable to apply the behavior of this metric observed at Big Trout Lake and Lansdowne House and conclude that there will be substantial reductions of this metric at Peawanuck and Fort Severn as well.
TABLE 5 Projected number of days below -10 °C per year for Big Trout Lake and Lansdowne House.
Finally, we note that these projections pertain to the thermal regime necessary for the presence of palsas and these projections may be significantly modified if the hydrological regime is substantially altered in the future.
Acknowledgments
The authors would like to thank Joyce Zhang for the statistical downscaling contribution to this study. Her work was funded by the Ontario Ministry of the Environment. We acknowledge the support of the Ontario Ministry of Natural Resources.
Related Research Data
References Cited
- An, W. , and Allard, M. , 1995: A mathematical approach to modeling palsa formation: insights on processes and growth conditions. Cold Region Science and Technology , 23: 231–244.
- Collins, M. , Tett, S. F. B. , and Cooper, C. , 2001: The internal climate variability of HadCM3, a version of the Hadley Centre coupled model without flux adjustments. Climate Dynamics , 17: 61–81.
- Cyr, S. , and Payette, S. , 2010: The origin and structure of wooded permafrost mounds at the arctic treeline in eastern Canada. Plant Ecology & Diversity , 3: 35–46.
- Environment Canada , 2012: Climate. Canada's National Climate Archive online. Government of Canada. http://climate.weather.gc.ca/index_e.html (accessed 1 September 2012).
- Flato, G. M. , and Boer, G. J. , 2001: Warming asymmetry in climate change simulations. Geophysical. Research Letters , 28: 195–198.
- Fronzek, S. , Luoto, M. , and Carter, T. R. , 2006: Potential effect of climate change on the distribution of palsa mires in subarctic Fennoscandia. Climate Research , 32(1): 1–12.
- Gagnon, A. S. , and Gough, W. A. , 2002: Hydro-climatic trends in the Hudson Bay region, Canada. Canadian Journal of Water Resources , 27: 245–262.
- Gagnon, A. S. , and Gough, W. A. , 2005: Trend and variability in the dates of ice freeze-up and break-up over Hudson Bay and James Bay. Arctic , 58(4): 370–382.
- Gough, W. A. , and Leung, A. , 2002: Nature and fate of Hudson Bay permafrost. Regional Environmental Change , 2: 177–184.
- Gurney, S. D. , 2001: Aspects of the genesis, geomorphology and terminology of palsas: perennial cryogenic mounds. Progress in Physical Geography , 25: 249–260.
- Hinkel, K. , Paetzoid, E. , Nelson, E. E. , and Bockheim, J. G. , 2001: Patterns of soil temperature and moisture in the active layer and upper permafrost at Barrow, Alaska: 1993–1999. Global and Planetary Change , 29: 293–309.
- Kim, S.-J. , Flato, G. M. , Boer, G. J. , and McFarlane, N. A. , 2002: A coupled climate model simulation of the Last Glacial Maximum, Part 1: transient multi-decadal response. Climate Dynamics , 19: 515–537.
- Kim, S.-J. , Flato, G. M. , and Boer, G. J. , 2003: A coupled climate model simulation of the Last Glacial Maximum, Part 2: approach to equilibrium. Climate Dynamics , 20: 635–661.
- Kirpotin, S. N. , Polishchuk, Y. , and Bryksina, N. , 2009: Abrupt changes of thermokarst lakes in Western Siberia: impacts of climatic warming on permafrost melting. International Journal of Environmental Studies , 66(4): 423–131.
- Kujala, K. , Eppälä, M. , and Holappa, T. , 2008: Physical properties of peat and palsa formation. Cold Regions Science and Technology , 52: 408–414.
- Lewis, T. , and Lamoureux, S. E. , 2010: Twenty-first century discharge and sediment yield predictions in a small High Arctic watershed. Global and Planetary Change , 71: 27–11.
- Lewkowicz, A. G. , and Coultish, T. L. , 2004: Beaver damming and palsa dynamics in a subarctic mountainous environment, Wolf Creek, Yukon Territory, Canada. Arctic, Antarctic, and Alpine Research , 36(2): 208–218.
- Luoto, M. , Fronzek, S. , and Zuidhoff, F. S. , 2004: Spatial modeling of palsa mires in relation to climate in Northern Europe. Earth Surface Processes and Landforms , 29: 1373–1387.
- Nakićenović, N. , 2000: Greenhouse gas emissions scenarios. Technological Forecasting and Social Change , 65(2): 149–166.
- Nakićenović, N. , and Swart, R. (eds.), 2000: Special Report on Emissions Scenarios: A Special Report of Working Group III of the Intergovernmental Panel on Climate Change. Cambridge: Cambridge University Press.
- Parviainen, M. , and Luoto, M. , 2007: Climate envelopes of mire complex types in Fennoscandia. Geografiska Annaler , 89A(2):137–151.
- Pissart, A. , 2002: Palsas, lithalsas and remnants of periglacial mounds. A progress report. Progress in Physical Geography , 26(4): 605–621.
- Saemundsson, T. , Arnalds, O. , Kneisel, C. , Jonsson, H. P. , and Decaulne, A. 2012. The Orravatnsrastir palsa site in central Iceland—Palsas in an aeohan sedimentation environment. Geomorphology, 167–168: 13–20.
- Seppälä, M. , 1986: The origin of palsas. Physical Geography , 68: 141–147.
- Tam, A. , 2009: Permafrost in Canada's Subarctic Region of Northern Ontario. Master's thesis, Graduate Department of Geography, University of Toronto, Scarborough, Ontario, Canada.
- Thibault, S. , and Payette, S. , 2009: Recent permafrost degradation in bogs of the James Bay area, northern Quebec. Permafrost and Periglacial Processes , 20: 383–389.
- Vallée, S. , and Payette, S. , 2007: Collapse of permafrost mounds along a subarctic river over the last 100 years (northern Quebec). Geomorphology , 90: 162–170.
- van Everdingen, R. (ed.), 1998 [revised 2005]: Multi-language Glossary of Permafrost and Related Ground-ice Terms. Boulder, Colorado: National Snow and Ice Data Center.
- Wilby, R. L. , and Dawson, C. W. , 2012: The Statistical Downscaling Model: insights from one decade of application. International Journal of Climatology , 33: doi: https://doi.org/http://dx.doi.org/10.1002/joc.3544.
- Zuidhoff, F. S. , and Kolstrup, E. , 2000: Changes in palsa distribution in relation to climate change in Laivadalen, northern Sweden, especially 1960–1997. Permafrost and Periglacial Processes , 11(1): 55–69.