
Abstract
There is concern over the fate of surface water bodies at high latitudes as a consequence of rising global temperatures. The goal of this study is to characterize climatic change that has occurred in the northern Hudson Bay Lowlands (HBL), Canada, from 1943 to 2009, to determine if this has resulted in a change to pond surface areas and to predict if changes may continue in the future. Climate change and changes to pond volume and size over the past ∼60 years were examined using a combination of field methods/instrumental records (1943–2009), modeling (1953–2009; 1961–2100), and remote sensing/imagery analyses (1947–2008). Results demonstrate that temperatures are warming and breakup dates are earlier, but this has not significantly increased the duration of the open-water period or pond evaporation rates, which can be highly variable from year to year. Annual precipitation, primarily summer rainfall, has increased, lessening the summer moisture deficit and leading to wetter conditions. The observed changes of a smaller summer moisture deficit are predicted to continue in future, although there is less certainty with predictions of future precipitation than there is with predictions of air temperature. Thus, ponds are likely not at risk for drying and instead may be at risk for expansion. Despite the increases in summer rainfall, imagery analysis of 100 ponds shows that pond surface areas have fluctuated over the study period but have not increased in size.
Introduction
Shallow water bodies are a ubiquitous feature of Arctic coastal plains of Siberia, northern Alaska, and Canada. In Canada, they are particularly prevalent in the Hudson Bay Lowlands (HBL) and the Mackenzie River Delta region. Within the subarctic environment, shallow pond features are estimated to occupy between 15% and 50% of the total land area (CitationDuguay and Pietroniro, 2005) and contribute to regional chemical, energy, biological, and hydrological systems (CitationRouse et al., 1997; CitationProwse et al., 2006; CitationWhite et al., 2007). These water bodies are often rich in biodiversity (CitationSmol and Douglas, 2007) and are a habitat for wildlife as well as a breeding ground for migratory shorebirds. There has been growing interest from the scientific community regarding the status of shallow water bodies at high latitudes, as their growth or disappearance may be an indication of the effects of climate change (CitationSchindler and Smol, 2006). Changes in pond extent and distribution may significantly impact the regional ecosystems and modify biophysical regimes (CitationWhite et al., 2007; CitationRuhland et al., 2013). Thus, more information is needed to assess trends in hydrologic storage in ponds and shallow lakes in the Canadian Arctic and subarctic, and to predict how these systems might respond under a changing climate.
It is anticipated that the effects of climatic change will be particularly significant at high latitudes (CitationIPCC, 2007), with warmer temperatures and a longer open-water season (CitationSerreze et al., 2000). The increased air and surface water temperatures and length of the open-water season are expected to lead to increases in evaporation (E) (e.g., CitationRouse et al., 1997). However, changes in precipitation (PPT) patterns are less clear (CitationSerreze et al., 2000; CitationHinzman et al., 2005) and appear to vary regionally. In many regions across the Arctic and subarctic, the increased E caused by warming has not been balanced by increases in PPT, leading to more negative surface water budgets (i.e., PPT - E] (CitationHinzman et al., 2005; CitationWoo and Guan, 2006; CitationSmol and Douglas, 2007). This has the potential to lead to a widespread drying of shallow water bodies, as these systems are dynamic and highly responsive to changing climate conditions due to their high surface area-to-depth ratios (CitationRouse et al., 1997; CitationWoo and Guan, 2006).
Several studies (CitationYoshikawa and Hinzman, 2003; CitationStow et al., 2004; CitationSmith et al., 2005; CitationRiordan et al., 2006; CitationLabrecque et al., 2009) have used remotely sensed images to show decreasing lake surface areas over the past 50 years. Unfortunately, due to the resolution of the imagery used in most of these studies (about 15- to 200-m spatial resolution), only lakes have been studied and little is known about ponds. A Canadian study (CitationSmol and Douglas, 2007), based on field observations over several decades, demonstrated that ponds on Ellesmere Island are drying. However, this study did not suggest the spatial extent to which this has occurred. Overall, there is a paucity of data on the fate of the many small, shallow water bodies at high latitudes, and variability across regions is not known. This is confounded by the fact that the extent of pond drying may also vary regionally with permafrost, soil type, and pond size/bathymetry.
Climate warming has accelerated permafrost thaw in many regions (CitationRouse et al., 1997; CitationFrey and McClelland, 2009; CitationDyke and Sladen, 2010), leading to a drying of upland areas and an impounding of drainage in subsiding areas (CitationWoo et al, 1990; CitationJorgenson et al., 2006). Surface water in the landscape presents a positive feedback that enhances permafrost degradation in wet areas (CitationJorgenson et al., 2006), which may either increase the availability of water to lakes and ponds (CitationPayette et al., 2004; CitationSmith et al., 2005; CitationProwse et al., 2006; CitationSannel and Kuhry, 2011) or increase hydrologic connections between lakes and their surroundings, causing them to drain (CitationWoo et al., 1992; CitationYoshikawa and Hinzman, 2003).
Much of the previous research on the fate of ponds has been conducted in Alaska, Siberia, and western Canada, but less is known about their fate in central Canada, which differs hydrologically and climatologically (CitationPetrone et al., 2000). The Hudson Bay Lowlands (HBL) area spans central Canada and is the largest contiguous wetland in North America. The northern portion of the HBL is underlain by continuous permafrost, whereas discontinuous permafrost is more prevalent in the southern HBL. Shallow openwater features are prevalent in the region, covering 25% to 40% of the landscape (CitationBello and Smith, 1990; CitationDuguay and Lafleur, 2003; CitationMacrae et al., 2004; CitationDyke and Sladen, 2010). The microclimate of the northern HBL is heavily influenced by Hudson Bay (CitationBello and Smith, 1990; CitationPetrone et al., 2008), which has warmed considerably over the past half century (CitationGagnon and Gough, 2005a; CitationKaufman et al., 2009; CitationHochheim and Barber, 2010; CitationHochheim et al., 2010), causing it be ice-free for a greater duration of the year (CitationGagnon and Gough, 2005b; CitationMallory et al., 2010). This warming pattern is anticipated to continue in the future (CitationGagnon and Gough, 2005a; CitationDyke and Sladen, 2010), increasing air temperatures and lengthening the open-water season over adjacent land areas (CitationSannel and Kuhry, 2011). Increased precipitation is expected in winter due to warmer air temperatures (CitationIPCC, 2007), although increases in the magnitude and intensity of summer rainfall events are also possible (CitationSerreze et al., 2000), particularly given the retreat of the sea ice cover on Hudson Bay (CitationGagnon and Gough, 2005a). The cumulative effects of climate change in the northern HBL on pond hydrologic storage are not known.
This study aims to answer three key questions regarding the potential responses of the water balances of subarctic ponds to climate change from the second half of the 20th century to the end of the 21st century: (1) Have there been changes in the 1947–2009 observational period in the Churchill region of the HBL? (2) What are the implications of climate change for pond sustainability in the northern HBL? (3) Are trends expected to continue until the end of the 21st century based on regional climate model scenarios?
Study Area
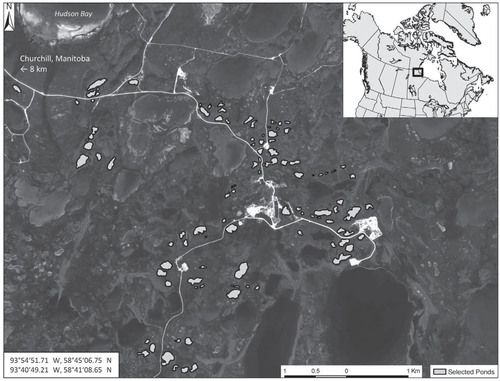
Research for this study was conducted within the Hudson Plains ecozone, near Churchill, Canada (58°44′N, 94°49′W, ), along the western shore of Hudson Bay. The region has an Arctic climate that is heavily influenced by the presence of Hudson Bay (CitationRouse, 1998). Annual mean air temperature is -6.9 °C, with a mean July air temperature of 12 °C in July and -27 °C in January (CitationEnvironment Canada, 2009). Annual precipitation averages approximately 432 mm, 44% of which falls as snow (CitationEnvironment Canada, 2009).
The topography of the Churchill region is a gentle sloping plain (1 m km-1) (CitationWinter and Woo, 1990) that has been undergoing isostatic rebound since glacial retreat, at a rate of approximately 1 m century-1 (CitationJohnson et al., 1987). The HBL is underlain by Ordovician and Silurian limestone and dolomite, beneath which Precambrian rocks such as sedimentary gneiss, granitoid, and volcanic rocks are found (CitationDredge, 1992). A layer made up of a mixture of marine silt deposits and Pleistocene glacial till is found on top of the bedrock, which is overlain by peat that ranges in depth from a minimum of a few centimeters by the coast of Hudson Bay to a maximum of more than 4 meters in areas far inland from the coast (CitationDredge, 1992).
Much of the northern HBL is underlain by continuous permafrost, with active layer depths typically less than 1 m (CitationDyke and Sladen, 2010). The region is poorly drained and dominated by coastal wetlands, although some open-canopy spruce-lichen woodlands are present. The wetlands are predominantly a mixture of polygonal peat bog plateaus and channel fens. Numerous ponds are present, occupying up to 50% of the landscape in some areas (CitationDyke and Sladen, 2010). The ponds are situated close to one another, and many do not have well-defined catchment areas. Ponds in the coastal zone (i.e., the study ponds, located within 10 km of the coast) typically occupy depressions with restricted drainage from a mixture of permafrost, rocks, and marine silts (CitationDyke and Sladen, 2010), whereas ponds farther inland, south of the coast of Hudson Bay, are thermokarst features (CitationDredge, 1992). The coastal ponds range from 30 m to nearly 1 km in diameter (CitationMacrae et al., 2004), and most are less than 1 m in depth and consequently freeze to the bottom in winter. These ponds also host thick deposits of highly organic sediments (CitationMacrae et al., 2004) that also freeze in winter. Many of the ponds appear to be hydrologically disconnected from surrounding peatlands for a portion of the summer months, experiencing short periods of drying and sediment exposure due to large summer E and small amounts of PPT (CitationBoudreau and Rouse, 1995; CitationMacrae et al., 2004), although ponds receiving hydrologic inputs from channel fens are less prone to drying (CitationWolfe et al., 2011).
Methods
Data mining, modeling, and imagery analyses were used to address the objectives of this paper. Changes in climate between 1943 and 2009 were characterized using archived field data and modeled data where field data were not available (e.g., duration of open-water period, evaporation). The effects of climate change on pond hydrologic storage during the contemporary period (1947–2009) were characterized using both imagery analyses and basic water balance modeling. The characterization of a future climatic scenario was done using models (Canadian Regional Climate Model, CRCM 4.2.0; Canadian Lake Ice Model, CLIMo). Details are provided in the following sections.
DATA
Observations of Meteorological Data (1943–2009)
Data used in this study were obtained from the meteorological station at the Churchill airport, where data have been collected since 1943 (CitationEnvironment Canada, 2009). Daily observations of precipitation (snow and rain), air temperature, wind speed, relative humidity, and cloud cover fraction were compiled.
Meteorological variables from the Churchill airport weather station (air temperature, humidity, cloud cover, wind speed, and snow accumulation) were used to force the Canadian Lake Ice Model (CLIMo) (CitationDuguay et al., 2003), for the purpose of deriving the timing of ice cover freeze-up (ice-on) and breakup (ice-off) dates (and open-water season duration) and surface water temperature for a pond with a mean water depth of 1 m for the contemporary period (1953–2009). This period was chosen as several of the forcing variables required for the model were not available, or were incomplete, in the 1943–1946 period. CLIMo is a well-tested, onedimensional thermodynamic model used for freshwater ice-cover studies (e.g., CitationMénard et al., 2002; CitationDuguay et al., 2003; CitationJeffries et al., 2005; CitationMorris et al., 2005; CitationLabrecque et al., 2009; CitationBrown and Duguay, 2011a) capable of simulating ice-on and ice-off, thickness, and composition of the ice cover (clear or snow ice). CLIMo has been shown to perform very well at simulating lake ice phenology when using input data that well represent the climate for the lake—for example, from nearby meteorological towers (e.g., in the Churchill area: CitationDuguay et al., 2003; CitationBrown and Duguay, 2011a).
FIGURE 1. Location of the study area in the Hudson Bay Lowlands near Churchill, Manitoba, Canada. The subset of 100 ponds used in a change detection study (1947–2008) is shown with light gray shading and thick black outline.
CLIMo has been modified from the one-dimensional sea ice model of Flato and Brown (Citation1996), which was based on the onedimensional unsteady heat conduction equation, with penetrating solar radiation, of Maykut and Untersteiner (Citation1971) (see CitationDuguay et al., 2003) and includes a fixed-depth mixed layer in order to represent an annual cycle. When open water is present, the mixed layer temperature is computed from the surface energy budget and hence represents a measure of the heat storage in the lake. When ice cover is present, the mixed layer is fixed at the freezing point. The water column of shallow lakes is typically isothermal and well mixed from top to bottom during the ice-free period, which allows the mixed layer depth to be a good approximation of the effect of lake depth leading to autumn freeze-up. A more detailed description of CLIMo can be found in Duguay et al. (Citation2003).
Imagery (1947–2008)
Images from 1947, 1956, 1972 (mosaics of four aerial photographs, 1:35,000 scale; Natural Resources Canada), and 2008 (SPOT 5 panchromatic image, 0.48–0.71 µm, 2.5 m resolution) were compared to examine changes in pond surface area. One hundred ponds (surface areas 400–40,000 m2, ) were randomly selected and manually digitized on-screen at a scale of 1:2320 using ESRI ArcMap. Ponds were delineated using a set of rules regarding tone, size, shape, texture and orientation. In order to calculate digitization accuracy, a subset of 24 manually digitized surface areas from the 2008 SPOT image were compared with field-collected surface area data acquired one week prior to imagery acquisition (Trimble GeoXT GPS). A comparison of the two datasets revealed a strong relationship (r 2 = 0.92) with an overall root mean square error of 172 m2. The areas of the digitized ponds were calculated and compared in order to determine feature growth or decay between 1947 and 2008.
Regional Climate Model Scenario (1961–2100)
The future scenario data (1961–2100) were produced by the Canadian Regional Climate Model (CRCM 4.2.0) (45 km true at 60°N) provided by Consortium Ouranos. CRCM is a limited-area model, originally developed at Université du Québec à Montréal (UQAM), driven at the boundaries by GCMs or reanalysis data. CRCM uses the Canadian LAnd Surface Scheme (CLASS 2.7; CitationVerseghy, 1991; CitationVerseghy et al., 1993) to describe the water and energy exchanges between land surface and atmosphere (CitationMusic and Caya, 2007). For a detailed description of CRCM, see Caya and Laprise (Citation1999) and Laprise (Citation2008). CRCM was driven at the boundaries with the Canadian Global Climate Model (CGCM 3.1/ T47 member 4), following the IPCC Special Report on Emission Scenarios A2 greenhouse-gas scenario of continually increasing CO2 emissions. CGCM data are produced by the Canadian Centre for Modelling and Analysis (CCCma). CLIMo was used to produce the future ice cover simulations using daily CRCM data consisting of 2-m screen temperature (bias corrected following Brown and Duguay [Citation2011b] using the Adjusted and Homogenized Canadian Climate Data [CitationVincent and Gullet, 1999; CitationAHCCD, 2009]; available from Environment Canada), humidity (specific humidity converted to relative humidity using a calculated saturated vapor pressure as a function of temperature [CitationBeljaars et al., 1989] and a fixed air pressure of 1015 mb), wind speed, water equivalent of snow, snow density, and cloud cover amounts.
ESTIMATES OF WATER BALANCE (1953–2009)
Pond water evaporation was estimated using the approach of Oswald and Rouse (Citation2004), a mass transfer equation based on Fick's first law of diffusion via
where E is evaporation (mm d-1), Ke
is the coefficient of proportionality, u is the horizontal wind speed at height z, eo
is the vapor pressure of saturated air at the temperature of the water surface (estimated using CLIMo, as in CitationLabrecque et al., 2009), and e is the vapor pressure of the air at the height above the water surface. A value of 0.81 was used for Ke
, which was derived statistically using published values for summer evaporation rates from ponds collected over a 4-year period in the Churchill region (CitationBoudreau and Rouse, 1995; CitationPetrone et al., 2000; CitationYee, 2008). Results from this model provide an average, regional estimate of evaporation for shallow-water features (1 m mean depth) within the region. Individual pond evaporative fluxes are expected to vary with pond size, bathymetry, and underlying sediment composition. A mean pond water depth of 1 m was used because observed water levels for Golf Lake (approximately 1 m deep) were used to validate the models. Thus, findings are more representative of moderately sized ponds (e.g., 1 m deep). Additional work is needed for smaller, shallower ponds.
After the main meltwater period, precipitation and evaporation predominantly control pond water levels within the Churchill region (CitationBoudreau and Rouse, 1995; CitationMacrae et al., 2004), although some ponds receive runoff via channelized flow (CitationWolfe et al., 2011). Surface and subsurface flow contribute to the overall water balance during major rain events; however, these are relatively uncommon during summer months within the Churchill region (CitationEnvironment Canada, 2009). Therefore, the water balances for ponds lacking surface connections with surrounding peatlands may be modeled using the equation
where ΔS is change in pond water storage, PPT is precipitation and E is evaporation (CitationMacrae et al., 2004). It is assumed that pond water levels begin at bankfull storage after the major melt period and oscillate due to atmospheric exchanges until freeze-up. It is understood that overland flow commences during all instances where total cumulative PPT exceeds E and any additional water is lost to the surrounding area. Although permafrost degradation is projected to occur under warmer temperatures in this region (CitationDyke and Sladen, 2010), which could supply runoff to adjacent ponds (e.g., CitationProwse et al., 2006; CitationWoo and Guan, 2006), for simplification, our simple water balance model in EquationEquation 2
does not include such lateral seepage.
STATISTICAL ANALYSES
Annual, seasonal, and monthly trends in air temperature, precipitation, ice cover, and evaporation were examined using the nonparametric Mann-Kendall test for detecting the presence of the monotonic increasing or decreasing trends and the nonparametric Sen's method for estimating the slopes of linear trends (significant trends 0.01 ≤ α ≤ 0.1).
Results and Discussion
VARIABILITY AND CHANGES IN CLIMATE (1943–2009)
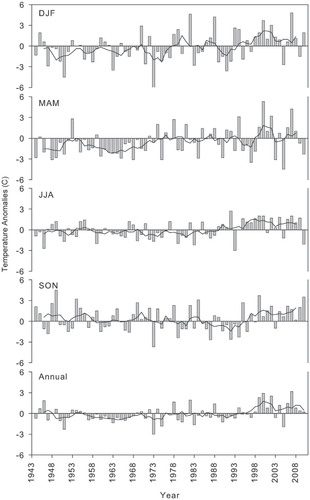
Annual air temperatures have increased at a rate of +0.02 °C yr-1 (+0.2 °C per decade), or +1.02 °C over the 66-year period (p = 0.05; ). These changes have been greatest during the winter (0.04 °C yr-1, p = 0.05) and spring (0.03 °C yr-1, p = 0.05) seasons, but have also been observed in summer (0.02 °C yr-1, p = 0.01). No change has been observed during the autumn months (p > 0.1). Increases in air temperature have been most pronounced between 1998 and 2009 (), which followed a cooling period for approximately three decades prior (CitationRouse, 1998). Observed temperatures are similar to what has been described by others (e.g., CitationRouse, 1998; CitationKaufman et al., 2009; CitationRuhland et al., 2013), although they demonstrate a slightly smaller change than reported by Gagnon and Gough (Citation2005b) (0.5 °C per decade), who used climatic data from 1971–2000 in their study. A recent study demonstrated that the observed temperature increases have led to a significant shift in lake biological communities and suggested that the climate of the HBL has passed a tipping point (CitationRuhland et al., 2013).
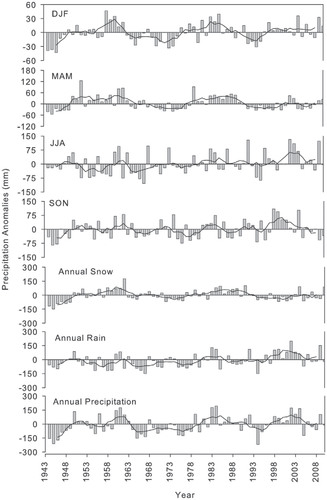
Annual precipitation and rainfall were highly variable among years, but significant increases in precipitation were observed over the 66-year period (). The increases in annual precipitation (+1.55 mm yr-1, p = 0.05) are attributed to increases in rainfall (+1.47 mm yr-1, p = 0.01) as significant differences in annual snowfall were not observed (). The increased rainfall amounts received in the summer (June, July, August—JJA) (+0.78 mm yr-1, p = 0.05) months were primarily driven by increased rainfall in August (+0.41 mm yr-1, p = 0.05), and rainfall amounts did not change significantly in June, July, September, or October between 1943 and 2009, although significant increases in rainfall for the period of 1953–2009 were observed in July (+0.43 mm yr-1, p = 0.05), August (+0.63 mm yr-1, p = 0.01), and September (+0.43 mm yr-1, p = 0.1). Increases in annual precipitation in North America have been observed and projected by others (e.g., CitationMcCabe et al., 2001; CitationGagnon and Gough, 2005b; CitationFinnis et al., 2007; CitationRawlins et al., 2010; CitationShook and Pomeroy, 2012), but this has largely involved increases in winter precipitation due to increased cyclonic activity for the period between September and March in other regions (CitationMcCabe et al., 2001; CitationFinnis et al., 2007). Thus, although increases in annual precipitation in the Churchill region have been observed, the seasonal distribution of these increases is in contrast to what has been observed elsewhere. Determining the mechanism behind the increased summer rain events is beyond the scope of the current study but is likely due to Hudson Bay being ice-free for a longer portion of the year, providing a warmer surface and atmosphere in summer capable of holding and transporting more water vapor to adjacent areas (CitationGagnon and Gough, 2005b; CitationPetrone et al., 2008; CitationHochheim et al., 2010; CitationHochheim and Barber, 2010; CitationMallory et al., 2010). A recent study examining the hydrologic character of rainfall in the Canadian prairies noted increased uniformity of summer rainfall, with a reduction in single-day summer rainfall events but an increase in multiple-day summer rainfall, and speculated that frontal precipitation events have increased (CitationShook and Pomeroy, 2012).
FIGURE 2. Normalized difference in seasonal and annual mean air temperatures recorded at Churchill, Canada, 1943–2009. Differences (degrees Celsius) are anomalies from the 1971–2000 mean. The solid line represents a five-year running mean.
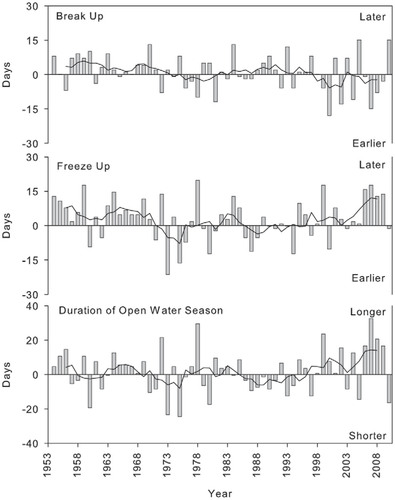
The duration of the pond open-water period () did not increase in length between 1953 and 2009 (p > 0.1). However, earlier spring pond breakup dates were observed (6.1 days earlier from 1953 to 2009, or -0.11 days yr-1, p = 0.1), whereas autumn freezeup dates did not change significantly. The findings of a significant change in spring pond breakup dates but no significant change in the length of the ice-free season results from high variability in the data set, as the length of the open-water season fluctuated from 91 to 148 days over the record period. These patterns are similar to what has been observed over Hudson Bay near Churchill by Gagnon and Gough (Citation2005a), who also observed earlier breakup dates (-0.8 days yr-1) but did not find significant changes in the formation of ice cover. Often, high-latitude lakes host persistent ice long into the summer (CitationSchindler and Smol, 2006), and ponds and lakes are only ice-free for 1–3 months each year. A lengthening of the ice-free season over the ponds is significant as it may lead to warmer water and sediment temperatures, and may affect pond ecology and biogeochemical processes (CitationRouse et al., 1997). A longer openwater season, combined with warmer air temperatures, may also increase evaporative losses from ponds and increase the potential for pond drying (CitationRouse et al., 1997; CitationSmol and Douglas, 2007).
FIGURE 3. Normalized differences in seasonal and annual precipitation recorded at Churchill, Canada, 1943–2009. Differences are anomalies from the 1971–2000 mean. The solid line represents a fiveyear running mean. Different scales are used on the y-axes.
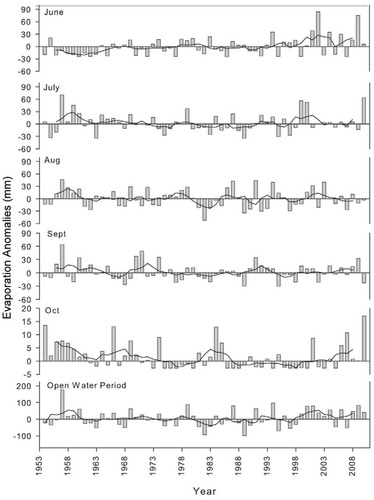
Despite the slightly warmer summer air temperatures and longer ice-free season, modeled pond evaporation (for ponds 1 m mean water depth) did not increase significantly between 1953 and 2009 (). Overall changes in pond evaporation (open-water period totals) were dampened due to opposing trends observed in the early and late parts of the season. Evaporation rates increased in June (0.44 mm yr-1, p = 0.05) but decreased in October (-0.06 mm yr-1, p = 0.01). No statistical differences in evaporation rates were found in July, August, or September. The increased June evaporation rates likely result from the earlier breakup of ice cover and corresponding warmer air and pond water temperatures. The decreased evaporation rates in October may be a result of smaller vapor pressure gradients. Petrone et al. (Citation2008) demonstrated that evaporation rates decrease when vapor pressure gradients are reduced during onshore winds from Hudson Bay, which are more persistent during the fall period.
FIGURE 4. Normalized differences spring lake ice break-up and freeze-up dates, 1953–2009 (modeled using CLIMo model). Differences are anomalies from the 1971–2000 mean. The solid line represents a fiveyear running mean. Different scales are used on the y-axes.
TEMPORAL TRENDS IN THE WATER DEFICIT AND IMPLICATIONS FOR POND HYDROLOGIC STORAGE
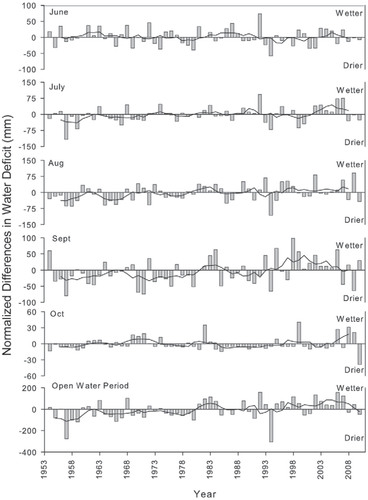
The Churchill region has historically been an area that experiences a moisture deficit (PPT < E) during the post-snowmelt summer months (July–September) (CitationRouse, 1998; CitationMacrae et al., 2004; CitationWolfe et al., 2011). However, the increases in summer precipitation are lessening the summer moisture deficit in the Churchill region (). The open-water period, although not significantly longer, appears to have shifted from experiencing a moisture deficit to one that experiences a surplus amount of moisture. This trend is not synchronous across the entire open-water period. The moisture deficit (PPT — E) did not change significantly in June or October () from 1953 to 2009, whereas the moisture deficit became smaller in July (0.53 mm yr-1, p = 0.1), August (0.79 mm yr-1, p = 0.05) and September (0.79 mm yr-1, p = 0.05) as a result of the increases in precipitation (). Thus, while the late summer and autumn months have historically been periods of time during which ponds continued to dry, these months are shifting to wetter conditions (). This trend is important for the regional hydrology and biogeochemistry, as ponds may fill with rainfall and possibly runoff from surrounding peatlands prior to freeze-up.
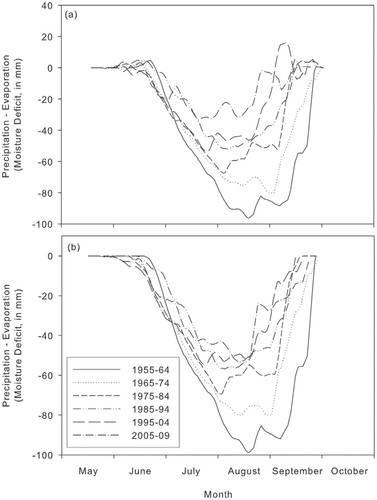
The seasonal pattern of the water deficit (WD, calculated by PPT — E) (7 day running means of 10-year periods, shown in , part a) changed in four ways over the study period: (1) the transition to a negative water balance (i.e., drying) occurred successively earlier in June; (2) the magnitude of the WD became smaller, both in the magnitude of the extent of drying observed, but also the duration of a negative water balance, where there was a much shorter period of drought and potential for pond drying and sediment exposure; (3) a mid to late summer wetting trend and return of the negative water balance to a positive water balance occurred progressively earlier in the mid to late summer, prior to freeze-up; and (4) there was more apparent surplus (i.e., a water balance that was more positive than at the timing of breakup). A change in the WD has significant implications for pond hydrologic storage. Previous research in this region (e.g., CitationMacrae et al., 2004; CitationWolfe et al., 2011) and elsewhere (CitationWoo et al., 1992; CitationHamilton et al., 1994; CitationQuinton and Roulet, 1998; CitationQuinton and Marsh, 1999; CitationWoo and Guan, 2006) has shown that water levels in some ponds are largely balanced by the WD. Thus, changes in pond water levels (as a function of WD) over the same time period were estimated (, part b). Ponds were assumed to be at bankfull storage (capacity) at the time of spring breakup. A cumulative WD that exceeded this (i.e., more positive) was assumed to lead to overbank flooding and runoff (fill and spill) from the pond. It was assumed that there is minimal input to ponds from their surrounding catchments as was shown by Macrae et al. (Citation2004) for the dry summer period. However, this assumption was only made to simplify the current discussion, as not all ponds are hydrologically disconnected (CitationWolfe et al., 2011), and most ponds are hydrologically connected to peatlands during wet periods when the storage capacity of the shallow active layer is exceeded (CitationMacrae et al., 2004). An apparent increase in rainfall that leads to the filling of pond depression storage, and consequently generates runoff in the landscape, has important implications for pond-peatland connectivity (and general connectivity throughout the landscape) (CitationQuinton and Roulet, 1998) as well as feedbacks to permafrost degradation that may be caused by an increase in latent energy in the saturated active layer (e.g., CitationJorgenson et al., 2006; CitationWoo and Guan, 2006; CitationDyke and Sladen, 2010; CitationProwse and Brown, 2010). The many shallow ponds have historically been ephemeral, with sediment exposure/desiccation for extended periods in summer. The current results suggest that ponds (∼1 m in depth) in this region are not at risk of drying and are instead at risk of transitioning from ephemeral systems to features that remain saturated throughout the open-water period. This has important implications for biogeochemical and ecological processes in both pond water and the thick layer of organic sediments present in ponds in the region. It is unclear what effects increased wetness will have on the waterfowl and other biota that rely on the ponds for habitat (CitationMallory et al., 2010; CitationBhiry et al., 2011). Alternatively, the increase in the availability of water to lakes and ponds may lead to a widespread drying of these features if it causes them to drain by enhancing permafrost degradation around the ponds, breaching pond banks, or creating subsurface connections beneath lakes (CitationWoo et al., 1992).
FIGURE 5. Normalized differences in modeled lake evaporation (1 m water column). Differences are anomalies from the 1971–2000 mean. The solid line represents a five-year running mean. Different scales are used on the y-axes.
CHANGES IN POND SURFACE AREA (1947–2008)
An analysis of 100 ponds using aerial imagery acquired in 1947 (dry), 1956 (dry), 1972 (wet), and 2008 (dry) shows that pond surface areas increased in wet years and decreased in dry years, but did not demonstrate a consistent directional change between 1947 and 2008 (). For example, the delineated ponds exhibited a 3% reduction in total surface area from 862,424 m2 in 1947 to 837,516 m2 in 1956. Pond surface areas increased in 1972 to a total of 862,142 m2 for the 100 surveyed ponds (a change of <1% from 1947 levels) but decreased again by 2008 to 773,611 m2 (10% lower than 1947). Of the 100 ponds examined, 21 experienced consistent directional shoreline change between 1947 and 2008. An apparent shoreline retreat was observed for 20 features while consistent expansion was evident for one feature within the study site. Although directional shoreline changes were apparent, these changes were small and may have resulted from natural hydrologic variability in conjunction with human interactions or digitizing error. This apparent lack of change in pond surface area is in contrast to what has been observed elsewhere in the HBL (e.g., CitationPayette et al., 2004), where pond expansion and coalescing was observed.
FIGURE 6. Normalized differences in the summer water deficit (difference between measured rainfall and modeled lake evaporation). Differences are anomalies from the 1971–2000 mean. The solid line represents a five-year running mean. Different scales are used on the y-axes.
The failure of ponds to increase in size is in contrast to the increased summer rainfall amounts observed over the study period. We hypothesize that the images did not demonstrate change for several reasons. First, ponds in the Churchill region currently remain in a water deficit (negative water balance) over the summer months, despite the apparent increases in rainfall ( and ). Second, due to the flat topography of the region, an exceedance of PPT over E will result in overbank flooding and runoff to adjacent depressions, and eventually to Hudson Bay. Finally, the images were captured in late July/early August (1947, 1972, 2008), with the exception of 1956 (August 28), which was a dry year. Ponds are typically at their maximum deficit at this time in the season ( and ), whereas the increases in rainfall have typically occurred throughout August and September, after the images were captured. Thus, despite an apparent doubling of summer rainfall, the study ponds have not shown any shift in surface area, and thus the threshold moisture condition needed for pond growth and possibly the slumping and collapse of the surrounding peatland may not yet have been achieved. However, the increase in moisture availability in the region is expected to continue to increase based on the modeling work in this study. Thus, this region is at risk for pond expansion in the future.
PROJECTION OF FUTURE CHANGES FOR THE 21st CENTURY
The increased temperature and precipitation observed over the past half century are projected to continue. Comparisons of air temperatures projected by the model for the 1961–2000 period with observations of air temperature at the Churchill Airport (CitationEnvironment Canada, 2009) () suggest that the model is performing well in all seasons of the year. Projections of precipitation are less certain, with the CRCM under-predicting precipitation () for the period between 1971 and 2000. Precipitation projections appear to be most uncertain for the spring (March, April, May—MAM) and autumn (September, October, November—SON) period ().
FIGURE 7. Atmospheric moisture deficit (observed precipitation — modeled evaporation) as an indication of pond water levels. Ponds are assumed to be full at break-up, although snowmelt and lateral seepage are not included in the model, and ponds are assumed to be hydrologically isolated from peatlands. The cumulative moisture deficit post-break-up is shown in (a). In (b), periods in summer and autumn during which the moisture deficit is more positive than at break-up are assumed to lead to overbank flooding (spill) from ponds, resetting the moisture deficit to zero. Values are 7-day running means for each day, averaged at 10-year intervals. Different scales are used on the y-axes.
Due to the uncertainty of model output, 30-year means and standard deviations are provided for the projected data (). Mean annual temperatures are projected to rise from -6.6 ± 1.5 °C (1971–2000) to -3.5 ± 1.2 °C (2041–2070) and -1.4 ± 1.6 °C (2070–2100). This temperature increase will be a result of warmer winters, as mean December, January, February (DJF) temperatures are projected to rise from -24.2 ± 3.1 °C (1971–2000) to -19.1 ± 3.4 °C (2041–2070) and -17.7 ± 3.4 °C (2070–2100). The autumn period will also be warmer, as temperatures are projected to rise from -2.7 ± 1.8 °C (1971–2000) to -0.1 ± 1.8 °C (2041–2070) and +2.0 ± 1.6 °C (2070–2100). Minimal changes in spring (MAM) and summer (JJA) temperatures are projected (). Annual precipitation is also projected to increase from 1971–2000 levels by ∼18% (2041–2070) and ∼24% (2070–2100). These increases will occur across all seasons of the year but will be most significant in summer (JJA) (). This is in agreement with what has already been observed over the 66 years of observational data examined in this study and is in agreement with projections made by Gagnon and Gough (Citation2005b).
The variables generated by the CRCM were used to force the CLIMo model to predict the duration of the ice-free period. The models predicted a longer ice-free season (127 days) than is currently experienced (115 days) for 1971–2000 (), suggesting that the projections should be treated with caution. The models project that the ice-free season will increase by an average of 18 days by 2041–2070 and 29 days by 2071–2100 (). The longer season is mainly a result of earlier breakup dates (JD 152 ± 10 days, 2041–2070; JD 144 ± 11 days, 2070–2100), but also results from later freeze-up dates (JD 297 ± 11 days, 2041–2070; JD 301 ± 8 days, 2071–2100) (). That is, later freeze-up (ice-on) implies delayed ice formation and thickening, resulting in thinner end-of-winter ice thickness (where thickness is not constrained by pond water depth), if all other climatic factors are not changed. However, if winter snowfall also increases, the ice growth rate could be further reduced. As a result, even if MAM temperatures do not change significantly, less energy will be required (i.e., fewer degree days in spring/early summer) to melt the ice cover, resulting in earlier breakup (ice-off). Evaporation from a 1.0 m pond was also projected using the same approach outlined above (CitationOswald and Rouse, 2004). Projected rates of annual evaporation (254 ± 32 mm) were comparable to our modeled evaporation rates for the 1971–2000 period (245 ± 53 mm). Evaporation rates are projected to increase to 285 ± 32 mm (2041–2070) and 300 ± 31 mm (2071–2100).
TABLE 1 Mean (standard deviation) observed contemporary (Obs.) and projected (Proj.) changes in seasonal and annual mean air temperatures (Tair), mean annual total precipitation, and snowfall for the Churchill region for three time periods: 1971–2000, 2041–2070, and 2071–2100. Projections were generated using CRCM 4.2.0 data and observations were taken from the Churchill airport meteorological station.
The annual and summer water deficits (WD) were estimated using the projections of PPT and E. There is a large amount of uncertainty associated with these estimates, and they should therefore be treated with caution. The annual WD in the region is projected to decrease (i.e., a more positive water balance) by ∼45 mm between the present and 2071–2100; however, this will not be caused by increases in snowfall and will instead be caused by increases in rainfall during the open-water period, which is projected to increase by ∼49 mm (). A continued lessening of the WD, combined with permafrost degradation that is also projected to occur (CitationDyke and Sladen, 2010) is anticipated to lead to pond expansion and coalescence as has been observed in more southern areas of the HBL as a result of permafrost decay (CitationPayette et al., 2004).
TABLE 2 Mean (standard deviation) contemporary (Est.) and projected (Proj.) changes in changes in pond break-up (BU) dates (Julian day), freeze-up (FU) dates, pond evaporation (E), and Annual and Open Water Season (OWS) moisture deficit (PPT-E). For projected BU, FU, and Evaporation, temperature, wind, and humidity projections were generated using CRCM 4.2.0. For the 1971–2000 period, BU and FU were estimated with CLIMO and evaporation from the method of Oswald and Rouse (Citation2004), with Churchill airport meteorological station data as forcing variables.
TABLE 3 Changes in surface areas of 100 ponds near Churchill, Manitoba (1947–2008).
Conclusions
This study has demonstrated a change in climatic conditions for the Churchill region of the HBL over a 66-year period. Air temperatures and the length of the growing season have both increased, leading to increases in modeled evaporation rates from ponds. However, these increased evaporation rates have been offset by increases in annual precipitation that are largely caused by a significant increase in rainfall in late summer/early autumn. The mechanism causing these increases in summer rainfall is unclear but should be investigated as the CRCM is not capturing the observed increases in its projections. Despite the increase in moisture availability in the region, the ponds still exhibit negative water balances in summer and consequently have not yet increased in surface area. Although CRCM projections of precipitation are less certain than those of temperature, the CRCM projects that increases in precipitation and evaporation will continue into the future. It is anticipated that if precipitation continues to increase at a faster rate than pond evaporation, ponds will begin to expand.
Our study did not examine runoff from peatlands into ponds. A reduction in the WD is anticipated to enhance permafrost degradation and increase the supply of runoff to ponds, which will reduce pond drying even more. Thus, future studies are needed that examine pond-peatland connectivity in response to both permafrost degradation and increases in rainfall in this region. Such studies should also be extended to include more inland thermokarst water bodies, which are more affected by the thaw of massive ice, as the geographic extent of our study was limited to coastal ponds, located within 10 km of Hudson Bay.
Acknowledgments
This project was funded and/or supported by the Canadian Foundation of Climate and Atmospheric Sciences (CFCAS grant to Macrae and Duguay), Churchill Northern Studies Centre Northern Research Fund, and the Northern Scientific Training Program (NSTP). Two anonymous reviewers are acknowledged for their constructive suggestions.
Related Research Data
References Cited
- AHCCD [Adjusted Historical Canadian Climate Data] , 2009: Environment Canada, <http://www.cccma.ec.gc.ca/hccd/> (last accessed 1 June 2009).
- Beljaars, A. C. M. , Holtslag, A. A. M. , and van Westrhenen, R. M. , 1989: Description of a software library for the calculation of surface fluxes. De Bilt, Netherlands: Royal Netherlands Meteorological Institute (KNMI), KNMI Technical Report, TR-112.
- Bello, R. L. , and Smith, J. D. , 1990: The effect of weather variability on the energy balance of a lake in the Hudson Bay Lowlands, Canada. Arctic and Alpine Research , 22(1): 98–107.
- Bhiry, N. , Delwaide, A. , Allard, M. , Bégin, Y. , Filion, L , Lavoie, M. , Nozais, C. , Payette, S. , Pienitz, R. , Sulnier-Talbot, E. , and Vincent, W. F. , 2011: Environmental change in the Great Whale River region, Hudson Bay: five decades of multidisciplinary research by Centre d'études nordiques (CEN). Ecoscience , 18(3): 182–203.
- Boudreau, L. D. , and Rouse, W. R. , 1995: The role of individual terrain units in the water balance of wetland tundra. Climate Research , 5(1): 31–47.
- Brown, L. C. , and Duguay, C. R. , 2011a: A comparison of simulated and Profiler. Hydrological Processes , 25: doi: https://doi.org/http://dx.doi.org/10.1002/hyp.8087.
- Brown, L. C. , and Duguay, C. R. , 2011b: The fate of lake ice in the North American Arctic. The Cryosphere , 5: 869–892, doi: https://doi.org/http://dx.doi.org/10.5194/tc-5-869-2011.
- Caya, D. , and Laprise, R. , 1999: A semi-Lagrangian semi-implicit regional climate model: the Canadian RCM. Monthly Weather Review , 127(3): 341–362.
- Dredge, L. , 1992: Field Guide to the Churchill Region, Manitoba. Ottawa, Canada: Geological Survey of Canada, Series 53: 52 pp.
- Duguay, C. R. , and Lafleur, P. , 2003: Determining depth and ice thickness of shallow sub-arctic lakes using space-borne optical and SAR data. International Journal of Remote Sensing , 24(3): 475–489.
- Duguay, C. R. , and Pietroniro, A. , 2005: Remote sensing in northern hydrology: measuring environmental change. Geophysical Monograph Series , 163: 160 pp.
- Duguay, C. R. , Flato, G. M. , Jeffries, M. O. , Ménard, P. , Morris, K. , and Rouse, W. R. , 2003: Ice-cover variability on shallow lakes at high latitudes: model simulations and observations. Hydrological Processes , 17: 3465–3483.
- Dyke, L. D. , and Sladen, W. E. , 2010: Permafrost and peatland evolution in the northern Hudson Bay Lowland. Arctic 63(4): 429–441.
- Environment Canada , 2009: National Climate Data and Information Archive. <http://climate.weatheroffice.gc.ca/Welcome_e.html> (last accessed 10 December 2009).
- Finnis, J. , Holland, M. M. , Serreze, M. C. , and Cassano, J. J. , 2007: Response of northern hemisphere extratropical cyclone activity and associated precipitation to climate change, as represented by the Community Climate System Model. Journal of Geophysical Research , 112(G4): doi: <https://doi.org/http://dx.doi.org/10.1029/2006JG000286>.
- Flato, G. M. , and Brown, R. D. , 1996: Variability and climate sensitivity of landfast Arctic sea ice. Journal of Geophysical Research, 101(C10): 25767–25777.
- Frey, K. E. , and McClelland, J. W. , 2009: Impacts of permafrost degradation on Arctic river biogeochemistry. Hydrological Processes , 23: 169–182.
- Gagnon, A. , and Gough, W. , 2005a: Trends in the dates of ice freezeup and breakup over Hudson Bay, Canada. Arctic , 58(4): 370–382.
- Gagnon, A. , and Gough, W. , 2005b: Climate change scenarios for the Hudson Bay region: an intermodel comparison. Climate Change , 69: 269–297.
- Hamilton, J. D. , Kelly, C. , Rudd, J. W. , Hesslein, R. H. , and Roulet, N. T. , 1994: Flux to the atmosphere of CH4 and CO2 from wetland ponds on the Hudson Bay Lowland. Journal of Geophysical Research , 99(D1): 1495–1510.
- Hinzman, L. , Bettez, N. D. , Bolton, W. R. , Chapin , F. Stuart , Dyurgerov, M. B , Fastie, C. L. , Griffith, B. , Hollister, R. D. , Hope, A. , Huntington, H. P. , Jensen, A. M. , Jia, G. J. , Jorgenson, T. , Kane, D. L. , Klein, D. R. , Kofinas, G. , Lynch, A. H. , Lloyd, A. H. , McGuire, A. D. , Nelson, N. E. , Oechel, W. C. , Osterkamp, T. E. , Racine, C. H. , Romanovsky, V. E. , Stone, R. S. , Stow, D. A. , Sturm, M. , Tweedie, C. E. , Vourlitis, G. L. , Walker, M. D. , Walker, D. A. , Webber, P. J. , Welker, J. M. , Winker, K. S. , and Yoshikawa, K. , 2005: Evidence and implications of recent climate change in northern Alaska and other Arctic regions. Climatic Change , 72: 251–298.
- Hochheim, K. , Barber, D. G. , and Lukovich, J. V. , 2010: Changing sea ice conditions in Hudson Bay, 1980–2005. In Ferguson, S. H. , Loseto, L. L. , ad Mallory, M. L. (eds.), A Little Less Arctic: Top Predators in the World's Largest Northern Inland Sea, Hudson Bay. Dordrecht: Springer, 39–52, doi: https://doi.org/http://dx.doi.org/10.1007/978-90-481-9121-5_2.
- Hochheim, K. P. , and Barber, D. G. 2010: Atmospheric forcing of sea ice in Hudson Bay during the fall period, 1980–2005. Journal of Geophysical Research , 115: C05009,doi: https://doi.org/http://dx.doi.org/10.1029/2009JC005334.
- IPCC , 2007: Climate Change 2007: Climate Change Impacts, Adaptation and Vulnerability. Contribution of Working Group II to the Fourth Assessment Report of the IPCC. Cambridge: Cambridge University Press.
- Jeffries, M. O. , Morris, K. , Duguay, C. R. , 2005: Lake ice growth and decay in central Alaska, USA: observations and computer simulations compared, Annals of Glaciology , 40: 1–5.
- Johnson, K. , Fairfield, L. , and Taylor, R. , 1987: Wildflowers of the Hudson Bay Region. Winnipeg, Canada: Manitoba Museum of Man and Nature, 400 pp.
- Jorgenson, M. T. , Shur, Y. L. , and Pullman, E. R. , 2006: Abrupt increase in permafrost degradation in Arctic Alaska. Geophysical Research Letters , 33(2): L02503, doi: https://doi.org/http://dx.doi.org/10.1029/2005GL024960.
- Kaufman, D. , Schneider, D. P. , McKay, N. P. , Ammann, C. M. , Bradley, R. S. , Briffa, K. R. , Miller, G. H. , Otto-Bliesner, B. L. , Overpeck, J. T. , and Vinther, B. M. , 2009: Recent warming reverses longterm Arctic cooling. Science , 325(5945): 1236–1239.
- Labrecque, S. , Lacelle, D. , Duguay, C. R. , Lauriol, B. , and Hawkings, J. , 2009: Contemporary (1951–2001) evolution of lakes in the Old Crow Basin, northern Yukon, Canada: remote sensing, numerical modeling, and stable isotope analysis. Arctic , 62(2): 225–238.
- Laprise, R. , 2008: Regional climate modeling. Journal of Computational Physics , 227: 3641–3666.
- Macrae, M. L. , Bello, R. L. , and Molot, L. A. , 2004: Long-term carbon storage and hydrological control of CO2 exchange in tundra ponds in the Hudson Bay Lowland. Hydrological Processes , 18(11): 2051–2069.
- Mallory, M. L. , Gaston, A. J. , Gilchrist, H. G. , Robertson, G. J. , and Braune, B. M. , 2010: Effects of climate change, altered sea-ice distribution and seasonal phenology on marine birds. In Ferguson, S. H. , Loseto, L. L. , ad Mallory, M. L. (eds.), A Little Less Arctic: Top Predators in the World's Largest Northern Inland Sea, Hudson Bay. Dordrecht: Springer, 179–195, doi: https://doi.org/http://dx.doi.org/10.1007/978-90-481-9121-5_9.
- Maykut, G. A. , and Untersteiner, N. , 1971: Some results form a timedependent thermodynamic model of sea ice. Journal of Geophysical Research , 76: 1550–1575.
- McCabe, G. J. , Clark, M. P. , and Serreze, M. C. , 2001: Trends in northern hemisphere surface cyclone frequency and intensity. Journal of Climate , 14(12): 2763–2768.
- Menard, P. , Duguay, C. R. , Flato, G. M. , and Rouse, W. R. , 2002: Simulation of ice phenology on Great Slave Lake, Northwest Territories, Canada. Hydrological Processes , 16: 3691–3706.
- Morris, K. , Jeffries, M. , and Duguay, C. R. , 2005: Model simulation of the effects of climate variability and change on lake ice in central Alaska, USA. Annals of Glaciology , 40: 113–118.
- Music, B. , and Caya, D. , 2007: Evaluation of the hydrological cycle over the Mississippi River Basin as simulated by the Canadian Regional Climate Model (CRCM). Journal of Hydrometeorology , 8: 969–988.
- Oswald, C. , and Rouse, W. R. , 2004: Thermal characteristics and energy balance of various-sized Canadian Shield lakes in the Mackenzie River Basin. Journal of Hydrometeorology , 5(1): 129–144.
- Payette, S. , Delwaide, A. , Cassianiga, M. , and Beauchemin, M. , 2004: Accelerated thawing of subarctic peatland permafrost over the last 50 years. Geophysical Research Letters , 31: L18208, doi: https://doi.org/http://dx.doi.org/10.1029/2004GL020358.
- Petrone, R. M. , Rouse, W. R. , and Marsh, P. , 2000: Comparative surface energy budgets in western and central sub-arctic regions of Canada. International Journal of Climatology , 20: 1131–1148.
- Petrone, R. M. , Rouse, W. R. , and Boudreau, L. D. , 2008: Energy balance response of a shallow subarctic lake to atmospheric temperature and advective persistence. Pre-Published Proceedings of the 9th International Conference on Permafrost , 2(IV): 1405–1409.
- Prowse, T. D. , and Brown, K. , 2010: Hydro-ecological effects of changing Arctic river and lake ice covers: a review. Hydrology Research , 41(6): 454–461.
- Prowse, T. D. , Wrona, F. J. , Reist, J. D. , Gibson, J. J. , Hobbie, J. E. , Levesque, L. M. , and Vincent, W. F. , 2006: Climate change effects on hydroecology of Arctic freshwater systems. Ambio , 35(7): 347–358.
- Quinton, W. L. , and Marsh, P. , 1999: A conceptual framework for runoff generation in a permafrost environment. Hydrological Processes , 13: 2563–2581.
- Quinton, W. L. , and Roulet, N. T. , 1998: Spring and summer runoff hydrology of a subarctic patterned wetland. Arctic and Alpine Research , 30(3): 285–294.
- Rawlins, M. A. , Steele, M. , Holland, M. M. , Adam, J. C. , Cherry, J. E. , Francis, J. A. , Groisman, P. V. , Hinzman, L. , Huntington, T. G. , Kane, D. L. , Kimball, J. S. , Kwok, R. , Lammers, R. B. , Lee, C. M. , Lettenmaier, D. P. , McDonald, K. , Podest, E. , Pundsack, J. W. , Rudels, B. , Serreze, M. C. , Shiklomanov, A. , Skagseth, O. , Troy, T. J. , Smarty, C. J. , Wensnahan, M. , Wood, E. F. , Woodgate, R. , Yang, D. , Zhang, K. E. , and Zhang, T. , 2010: Analysis of the Arctic system for freshwater cycle intensification: observations and expectations. Journal of Climate , 23(21): 5715–5737.
- Riordan, B. , McGuire, D. , and Verbyla, D. , 2006: Shrinking ponds in subarctic Alaska based on 1950-2002 remotely sensed images. Journal of Geophysical Research-Biogeosciences , 111(G4): G04002, doi: <https://doi.org/http://dx.doi.org/10.1029/2005JG000150>.
- Rouse, W. R. , 1998: A water balance model for a subarctic sedge fen and its application to climatic change. Climatic Change , 38(2): 207–234.
- Rouse, W. R. , Douglas, M. S. , Hecky, R. E. , Hershey, A. E. , Kling, G. W. , Lesack, L. , Marsh, P. , Mcdonald, M. , Nicholson, B. J. , Roulet, N. T. , and Smol, J. P. , 1997: Effects of climate change on the freshwaters of Arctic and subarctic North America. Hydrological Processes , 11(8): 873–902.
- Ruhland, K. M. , Paterson, A. M. , Keller, W. , Michelutti, N. , and Smol, J. P. , 2013: Global warming triggers the loss of a key Arctic refugium. Proceedings of the Royal Society B , 280(1772): doi: https://doi.org/http://dx.doi.org/10.1098/rspb.2013.1887.
- Sannel, A. B. K. , and Kuhry, P. , 2011: Warming-induced destabilization of peat plateau/thermokarst lake complexes. Journal of Geophysical Research-Biogeosciences (2005–2012), 116(G3): doi: <https://doi.org/http://dx.doi.org/10.1029/2010JG001635>.
- Schindler, D. W. , and Smol, J. P. , 2006: Cumulative effects of climate warming and other human activities on freshwaters of Arctic and subarctic North America. Ambio , 35(4): 160–168.
- Serreze, M. C. , Walsh, J. E. , Chapin, F. S. , III, Osterkamp, T. , Dyurgerov, M. , Romanovsky, V. , Oechel, W. C. , Morison, J. , Zhang, T. , and Barry, R. G. , 2000: Observational evidence of recent change in the northern high-latitude environment. Climatic Change , 46(1–2): 159–207.
- Shook, K. , and Pomeroy, J. , 2012: Changes in the hydrological character of rainfall on the Canadian prairies. Hydrological Processes , 26: 1752–1766.
- Smith, L. C. , Sheng, Y. , MacDonald, G. M. , and Hinzman, L. D. , 2005: Disappearing arctic lakes. Science , 308(5727): 1429–1429.
- Smol, J. , and Douglas, M. S. V. , 2007: Crossing the final ecological threshold in High Arctic ponds. Proceedings of the National Academy of Sciences , 104(30): 12395–12397.
- Stow, D. , Hope, A. , and McGuire, D. , 2004: Remote sensing of vegetation and land-cover change in Arctic tundra ecosystems. Remote Sensing of Environment , 89(3): 281–308.
- Verseghy, D. L. , 1991: CLASS-A Canadian land surface scheme for GCMs. Part I: soil model. International Journal of Climatology , 11(2): 111–133.
- Verseghy, D. L. , McFarlane, N. A. , and Lazare, M. , 1993: CLASS-A Canadian land surface scheme for GCMs. Part II: vegetation model and coupled runs. International Journal of Climatology , 13(4): 347–370.
- Vincent, L. A. , and Gullet, D. W. , 1999: Canadian historical and homogeneous temperature datasets for climate change analyses. International Journal of Climatology , 19: 1375–1388.
- White, D. , Hinzman, L. , Alessa, L. , Cassano, J. , Chambers, M. , Falkner, K. , Francis, J. , Gutowski, W. J., Jr. , Holland, M. , Holmes, R. M. , Huntington, H. , Kane, D. , Kliskey, A. , Lee, C. , McClelland, J. , Peterson, B. , Rupp, T. S. , Straneo, F. , Steele, M. , Woodgate, R. , Yang, D. , Yoshikawa, K. , and Zhang, T. , 2007: The arctic freshwater system: changes and impacts. Journal of Geophysical Research-Biogeosciences , 112: G04S54, doi: https://doi.org/http://dx.doi.org/10.1029/2006JG000353.
- Winter, T. C. , and Woo, M. K. , 1990: Hydrology of lakes and wetlands. In Wolman, M. G. , and Riggs, H. C. (eds.), Surface Water Hydrology. Boulder, Colorado: Geological Society of America, The Geology of North America, O-1: 159–187.
- Wolfe, B. B. , Light, E. M. Macrae, M. L. , Hall, R. I. , Eichel, K. , Jasechko, S. , White, J. , Fishback, L. A. , and Edwards, T. W. D. , 2011: Divergent hydrological responses to 20th century climate change in shallow tundra ponds, western Hudson Bay Lowlands. Geophysical Research Letters , 38: L23402, doi: https://doi.org/http://dx.doi.org/10.1029/2011GL049766.
- Woo, M.-K. , 1990: Consequences of climatic change for hydrology in permafrost zones. Journal of Cold Regions Engineering , 4(1): 15–20.
- Woo, M. K. , and Guan, X. J. , 2006: Hydrological connectivity and seasonal storage change of tundra ponds in a polar oasis environment, Canadian High Arctic. Permafrost and Periglacial Processes , 17: 309–323.
- Woo, M. K. , Lewkowicz, A. G. , and Rouse, W. R. , 1992: Response of the Canadian permafrost environment to climatic change. Physical Geography , 13(4): 287–317.
- Yee, S. , 2008: Water flow pathways to ponds and streams from Polygonal Peat Plateau in the Hudson Bay Lowland. MSc thesis, Department of Geography, York University, U.K.
- Yoshikawa, J. , and Hinzman, L. , 2003: Shrinking thermokarst ponds and groundwater dynamics in discontinuous permafrost near Council, Alaska. Permafrost and Periglacial Processes , 14: 151–160.