
Abstract
Alpine and subalpine meadows are often hotspots of water availability and biodiversity in montane landscapes, but we know little about whether these attributes also make meadows hotspots of greenhouse gas (GHG) emission. Furthermore, many of these meadows will likely become drier during the growing season in the future because of less precipitation, earlier timing of snowmelt, and increased evapotranspiration associated with climatic warming. To evaluate the potential effects of soil drying on GHG emission, we studied a soil moisture gradient in a Sierra Nevada subalpine meadow in California. Our objectives were: (1) to assess the strength of hydrological control for soil carbon dioxide (CO2), methane (CH4), and nitrous oxide (N2O) fluxes both earlier and later in the growing season; and (2) to quantify the contribution of CH4 and N2O to net GHG emission. The replicated gradient spanned 50 m, from the wet middle to dry edge of the meadow, and soil volumetric water content was measured 0 to 12 cm deep. Fluxes of CO2, CH4, and N2O were measured using static chambers at 10 m intervals across the gradient. We found that the wet side of the gradient was not a CH4 or N2O source on either sampling date. Net CH4 emission from soil was rare and CH4 uptake was prevalent, particularly on the dry side of the gradient. Soil N2O fluxes shifted from net uptake at the middle of the meadow to net emission at the edge, but only earlier in the growing season. Of the three GHGs, CO2 fluxes showed the most temporal variation but surprisingly varied little across the hydrological gradient. Other environmental factors—including plant species richness and soil carbon concentration—appeared more important than soil moisture in explaining CO2 fluxes. Therefore, the strength of near-surface hydrological control increased in the following order: CO2 < N2O < CH4. Our results suggest that non-CO2 greenhouse gases will need proper accounting during the snow-free season in order to more accurately predict the effects of future soil drying on GHG emissions in heterogeneous montane landscapes.
Introduction
Greenhouse gas (GHG) emissions from terrestrial ecosystems—which influence the global heat balance of the planet—often reflect changes in water availability across the landscape (CitationSmith et al., 2003). Wet montane meadows, for example, can emit more carbon dioxide (CO2) than surrounding drier upland forests (Riveros-Iregui and CitationMcGlynn, 2009). Wet montane meadows store carbon through high rates of plant production during the growing season followed by an extended cold season with low rates of microbial decomposition (CitationKato et al., 2004, Citation2006; CitationHu et al., 2010). Despite their relatively small area (e.g., 3% of Sierra Nevada in California; Keeler-Wolf et al., 2012), meadows could be significant sources of CO2, methane (CH4), and nitrous oxide (N2O) because of high organic matter content and relatively low water limitation during the snow-free period (i.e., subsurface water sources and high field capacities due to high organic matter content). Many high-elevation ecosystems are likely on the cusp of hydrological and biogeochemical changes resulting from less precipitation (CitationSeager et al., 2007), earlier timing of snowmelt (CitationMote et al., 2005; CitationStewart et al., 2005), and increased évapotranspiration due to climatic warming (CitationHarte et al., 1995; CitationBarnett et al., 2005; Fu et al., 2012). By better understanding current hydrological controls of GHG fluxes in high-elevation meadows, we can more accurately predict the effects of future soil drying on GHG emissions in heterogeneous montane landscapes.
Predicting the magnitude of CO2 emission and the direction of CH4 and N2O fluxes in montane meadows is not straightforward. Most studies do not measure all three major GHGs together at the same site. Thus, it remains unclear how soil moisture in montane meadows influences the relative contribution of non-CO2 GHGs to net radiative forcing (CitationJiang et al., 2010). Soil CH4 and N2O fluxes vary from net production to net consumption, depending on soil moisture, oxygen concentration, temperature, pH, nitrogen content, and microbial community structure (CitationMosier et al., 1993; CitationTorn and Harte, 1996; CitationFilippa et al., 2009; CitationLin et al., 2009; CitationHu et al., 2010; CitationJiang et al., 2010; CitationGiles et al., 2012). By not accounting for CH4 and N2O—which have much higher warming potentials per mole than CO2—we could be ignoring an important component of the GHG budget of montane meadows.
We may also be ignoring GHG-specific responses to drying. Can we assume, for example, that areas with dry surface soil also emit less CO2? And does wet surface soil necessarily express net CH4 emission? Meadow CO2 fluxes often show large spatial variation and can be limited by too little water, too much water (i.e., slower anaerobic metabolism and reduced diffusional transport from deep soil), cold temperatures, and availability of labile carbon (CitationFisk et al., 1998; CitationSaleska et al., 1999; CitationKato et al., 2004; CitationPacific et al., 2008, Citation2009; CitationSaito et al., 2009; CitationSuh et al., 2009; CitationJiang et al., 2010). There is also evidence that plant root respiration (as estimated by root biomass) can be more important than microclimate in explaining meadow CO2 fluxes (CitationGeng et al., 2012). Plant cover and diversity may also affect CH4 and N2O fluxes by altering carbon and nitrogen availability (CitationNiklaus et al., 2006). Net CH4 emission is favored in wetter soils (CitationMosier et al., 1993; CitationWhalen, 2005), but the extent of CH4 consumption in drier meadow soils is unclear. Net N2O emission can also relate positively to soil moisture (CitationMosier et al., 1993; CitationFisk et al., 1998; CitationFilippa et al., 2009) or show no relation to commonly measured environmental variables (CitationJiang et al., 2010). Thus, the controls on each GHG are apparently different, but because multiple GHGs have not been studied at many sites, we do not know how broadly these controls apply.
A hydrological gradient based on meadow topography is a way to assess the relative control of soil moisture on GHG fluxes. Topographic position relates to soil moisture, which may in turn relate to GHG fluxes, which thus aids in the modeling and upscaling of GHG emissions across montane landscapes (CitationFisk et al., 1998; CitationGrayson and Western, 1998; CitationWestern et al., 1999; Riveros-Iregui and McGlynn, 2009; CitationPacific et al., 2011; CitationJeong et al., 2012). The depth of the groundwater table typically decreases from the middle to edges of meadows (CitationLowry et al., 2010), resulting in drier soils near the edges. Greenhouse gas emissions are expected to follow a similar pattern (CitationMosier et al., 1993)—decreasing from the middle to the edges—but few studies have attempted to quantify this spatial pattern.
The Sierra Nevada in California provides an ideal alpine setting to investigate hydrological control of meadow GHG fluxes during the growing season because of the abundance of montane meadows and the Mediterranean-type climate. Sierra Nevada meadows, as opposed to the Rocky Mountains for example, receive almost no precipitation after spring snowmelt and are therefore expected to provide a consistent topographic soil moisture gradient without the confounding effects of summer precipitation. Soil moisture can strongly control CO2 emission in a Mediterranean-type climate (CitationCorreia et al., 2012), but, to date, no study has measured all three major GHGs simultaneously within the same Sierra Nevada meadow. A spring-fed wetland in the Sierra Nevada foothills was found to be a hotspot of CH4 and N2O emission compared to surrounding oak savanna (CitationOates et al., 2008). We therefore expected that the wetter portion of a subalpine meadow would also be a hotspot of CH4 and N2O emission.
We measured GHG fluxes across a soil moisture gradient from the middle to edge of a Sierra Nevada subalpine meadow in Yosemite National Park. To determine whether the effect of seasonal drying is similar to the effect of drying along the hydrological gradient, we measured GHG gas fluxes both earlier and later in the growing season. The gradient spanned from wet soils near field capacity at the middle of the meadow to considerably drier soils at the edge of the meadow. To identify the potential impacts of future soil drying, our first objective was to quantify the strength of hydrological control on different GHG fluxes. We hypothesized that the wetter portion of the meadow would be a hotspot of GHG emission compared to the drier edge. Our second objective was to determine the contribution of CH4 and N2O fluxes to net GHG emission in a subalpine meadow. We expected that CH4 and N2O fluxes would contribute most to net GHG emission in the wetter portion of the meadow.
Methods
SITE DESCRIPTION
A Sierra Nevada subalpine meadow (2860 m a.s.l.; 37.8997°N, 119.3397°W) was chosen based on trail access (∼5 km north-northeast of Tuolumne Meadows in Yosemite National Park, California, U.S.A.) and minimal previous disturbance (i.e., no recreational camping or packstock use). The sampled portion of the meadow was at least 200 m from the trail and showed no signs of human disturbance. The middle of the meadow was slightly lower in elevation, surrounded by a higher and drier edge of the meadow that transitioned to coniferous forest approximately 50 m beyond where we sampled. The meadow was oriented east-west (slope <5°) with Delaney Creek near the middle flowing west. The meadow was medium-sized (15.8 ha) compared to other meadows in Yosemite National Park, and dominated by small-statured plant species (<30 cm tall) including Aster alpigenus, Calamagrostis breweri, Carex filifolia, Deschampsia cespitosa, and Vaccinium caespitosum.
A weather station at Ellery Lake, California (WRCC, 2009), located 10 km northeast of the meadow at a similar elevation (2907 m a.s.l.), approximated the climate at our site. This area experiences a Mediterranean-type climate with less than 5% of annual precipitation falling during summer. The growing season lasts approximately 3 months (July until September), during which the groundwater table can fall from above the soil surface to more than 1.5 m below the soil surface (CitationLowry et al., 2010). The mean annual precipitation is 63.7 cm of water equivalent, with a mean annual cumulative snowfall of 544 cm. The mean maximum monthly snow depth (150 cm) typically occurs in March. The mean maximum air temperature in July is 19.8 °C, and the mean minimum air temperature in January is — 11.8 °C (mean annual air temperature is ∼3 °C). The mean air temperature in July and September, the months sampled, is 12.2 °C and 8.3 °C, respectively.
Soils within the meadow are classified as the Marmotland-Oxyaquic Dystrocryepts-Xeric Dystrocryepts complex. Marmotland, the dominant soil within the meadow (25%), is classified within the coarse-loamy, isotic, Vitrandic Dystrocryepts Soil Taxonomic family. The Marmotland soil series consists of very deep, moderately well drained or well drained soils that formed in alluvium or minor till derived from granitoid rock and volcanic ash. Occasionally, an organic litter layer (Oi, <1 cm thick) overlaid the mineral soil. The surficial mineral soil horizon (Al, 0–29 cm) has a fine sandy loam texture and is strongly acid (pH 5.1; USDA NRCS, 2007).
HYDROLOGICAL GRADIENT LAYOUT
The meadow was surveyed in mid-July 2010 (as soon as Tioga Pass Road opened) to identify a suitable area with unidirectional variation in soil moisture. A 50 × 70 m sampling grid was marked on the northern half of the meadow, spanning from the lower and wetter middle to the higher and drier edge. To capture the hydrological gradient, the 50 m side of the grid was oriented north-south, from the middle toward the edge at 10m intervals. The 70 m side of the grid was oriented east-west marking the start of eight gradient transects spaced 10 m apart.
Soil volumetric water content (VWC) was measured immediately after gas flux sampling both early (28 July 2010) and late in the growing season (11 September 2010). Soil VWC was measured 5 cm to the south of each gas flux chamber and 0 to 12 cm below the soil surface using a portable time domain reflectometer (CD620 Hydrosense System, Campbell Scientific, Logan, Utah). The wet side of the gradient was near field capacity (∼70% VWC) in July, which was approximately 3 weeks after snowmelt.
To assess non-moisture controls on GHG fluxes, we also measured midday soil temperature (both dates), plant species richness (July only), and soil chemistry (September only). Soil temperature was measured 5 cm to the south of each gas flux chamber and 6 cm below the soil surface (VWR Digital Dial Thermometer, VWR International, Radnor, Pennsylvania). Three temperature readings were recorded before, during, and after gas flux sampling, and then averaged. Plant species richness was measured to explain variation in gas fluxes potentially caused by differences in root respiration (presence/absence of plants) and resource utilization. Richness was determined by counting the number of different plant species present within the same 10.2-cm-diameter circular plots that were used to measure gas fluxes (0.0082 m2). If there was no above-ground plant growth in a plot, then species richness was recorded as zero. A species richness of three was the maximum that occurred with replication; there was one plot with a species richness of four. Soil chemical measurements are described separately below.
GAS FLUX SAMPLING
Field fluxes of carbon dioxide (CO2), methane (CH4), and nitrous oxide (N2O) were measured between 13:00 and 17:00 on 28 July and 29 July 2010 (eight transects) and 11 September 2010 (four transects) using the static chamber technique (CitationHutchinson and Mosier, 1981; CitationHart, 2006). Every other transect was sampled in September because of logistical constraints; there were not enough people or daylight to sample all eight replicates during the same day.
Chamber tops were constructed from a 10.2-cm-diameter white PVC pipe closed at one end with a 4-cm-tall PVC cap equipped with a rubber septum and vent tube. The length (10 cm) and diameter (0.5 cm) of the vent tube were calculated to minimize chamber air mixing with outside air due to sample collection and perturbations from wind (i.e., the Venturi effect). Because of National Park Service regulations, the anchors for the chamber tops were not permanently installed at the site. Instead, to minimize artifacts of disturbance, the 14-cm-tall PVC anchors were inserted 4 cm into the soil at least 2 h before gas sampling began. Small flags were used to mark plot locations between sampling dates.
Headspace gas samples (18 mL) were collected from each chamber using a 20 mL polyethylene syringe with stopcock and 20-gauge needle. Gas samples were collected 0, 20, and 40 minutes after sealing the chamber top and applying a latex band as a secondary airtight seal between the chamber top and anchor. Gas samples were injected into 12 mL evacuated glass vials with rubber septa (Exetainer, Labco, Lampeter, Ceredigion, U.K.) until laboratory analysis (2 mL injection volume) on a gas Chromatograph system (GC 2014 Greenhouse Gas Analyzer, Shimadzu Scientific Instruments, Columbia, Maryland) with Combi Pal AOC 5000 auto injector (CTC Analytics, Zwingen, Switzerland). The gas Chromatograph used packed stainless steel columns (oven temperature = 80 °C) and was equipped with a flame ionization detector (FID) to measure CH4 concentration, a thermal conductivity detector (TCD) to measure CO2 concentration, and an electron capture detector (ECD) to measure N2O concentration. The FID and TCD were set at 250 °C and 150 °C, respectively, and equipped with Hayesep D 80/100, Hayesep T 80/100, and Shimalite Q 100/180 columns (3.2 mm diameter). The ECD was set at 325 °C and equipped with Hayesep D 80/100, Hayesep N 80/100, and Porapak N 80/100 columns (1.6 mm diameter).
In July, concentrations of CO2 ranged from an average of 476 parts per million (ppm) at the start of flux measurements to 2847 ppm after 40 min (429–1299 ppm in September). The range of CH4 concentrations was 2.2–1.7 ppm in July and 2.2–1.8 ppm in September. The range of N2O concentrations was 0.34–0.33 ppm in July and 0.45–0.43 ppm in September. Carbon dioxide and CH4 fluxes were linear during the 40-min sampling period (mean r 2 = 0.99 and 0.97, respectively), and N2O fluxes were approximately linear (mean r 2 = 0.54). It is possible that N2O was more sensitive than the other gases to the pressure perturbation of sealing the chamber top (CitationCuriel Yuste et al., 2007), or the disturbance of installing the anchors 2 h prior. For the roughly one-third of chambers where N2O flux was clearly not linear, fitting with parabolic or exponential curves greatly improved the r 2 value (>0.95) but did not improve our ability to determine an hourly N2O flux rate. To minimize error propagation caused by regression (particularly for N2O), we calculated the flux rate for all three gases by subtracting the known initial concentration from the known final concentration after 40 min. Net CO2, CH4, and N2O fluxes were expressed as mg C mf2h-1, µg C m-2 h-1, and (µg Nm2 h-1, respectively. Positive rates indicate net emission (from soil to atmosphere), and negative rates indicate net uptake (from atmosphere to soil).
LABORATORY SOIL CHEMICAL ANALYSES
Soil samples (0 to 12 cm) were collected from all eight transects immediately after gas sampling in September using an Oakfield soil probe (2 cm diameter). We did not collect soil in July to minimize potential disturbance effects on future gas flux measurements. After field collection, soils were transported cold (4 °C) to the laboratory at the University of California, Merced, and stored until processed (within 72 h of initial sampling). Field-moist soils were first sieved (2 mm mesh) and homogenized. Gravimetric water content was determined by oven-drying the sieved soil for 24 h at 105 °C. Oven-dried soils were analyzed for C and N (g kg-1 soil) using an elemental combustion system (ECS 4010 CHNSO Analyzer, Costech Analytical Technologies, Valencia, California).
Ammonium and NO3-concentrations were determined by extracting 5 g of field-moist soil with 25 mL of 2 M potassium chloride (KCl), filtered through Whatman No. 1 filter paper (preleached with deionized water), followed by flow injection analysis (QuikChem 8500, Lachat Instruments, Hach Company, Loveland, Colorado). Ammonium and NO3-were determined by colorimetric methods on separate manifolds, the former using phenolate (method #12-107-06-1-B) and the latter using a cadmium-copper reduction column (method #12-107-04-1-B). The concentrations of NH4 + and NO3~ were expressed as mg N kg-1 dry soil.
DATA ANALYSES
Means and standard errors of soil VWC, temperature, CO2 flux, CH4 flux, and N2O flux were calculated for each date and distance along the hydrological gradient. A one-way analysis of variance (ANOVA) was used to test for differences between dates at an alpha level of 0.05 (JMP 8.0.2 software, SAS Institute, Cary, North Carolina). Linear regression was used to test relations between GHG fluxes, position in the meadow, soil microclimate, and chemistry.
Radiative forcing calculations were based on CH4 and N2O being 25 and 298 times stronger per mole, respectively, than CO2 as a greenhouse gas during the next 100 years (CitationForster et al., 2007). Hourly fluxes of CO2, CH4, and N2O in each chamber were converted to g CO2-equivalents nr2 d-1. In the cases of CH4 and N2O consumption, values of CO2-equivalents were negative. We totaled the CO2-equivalents for each sampled chamber, and then averaged across all chambers to determine the mean rate of GHG emission from the meadow on each date. Because our intent was not to construct an annual GHG budget—and because we know little about diurnal and weekly variation in GHG fluxes at this meadow—we refrained from temporal upscaling.
Results
SOIL MICROCLIMATE
Near-surface soils in the meadow were 2.2 °C warmer in July compared to September (). Soil VWC did not show a statistically significant difference from July to September, but VWC tended to decrease more in soils that were wetter in July. On both dates, ranges of soil VWC (∼60%) and temperature (∼10 °C) across the meadow were similar, and soils near the edge of the meadow were 23% drier (by volume) compared to the middle of the meadow (, part a). There was a negative correlation between soil temperature and VWC, particularly in September (). The distribution of soil VWC was normal in July and skewed in September (i.e., more locations with dry soil and fewer locations with wet soil). Soil gravimetric and volumetric water contents in September were positively correlated (P = 0.0007; R2 adj = 0.39; GWC = 0.58VWC + 0.34). The correlation may have been stronger if we would have included rock fragments >2 mm in the gravimetric calculation, or if we would have measured VWC in September at all 48 plots instead of 24 plots.
CARBON DIOXIDE FLUX
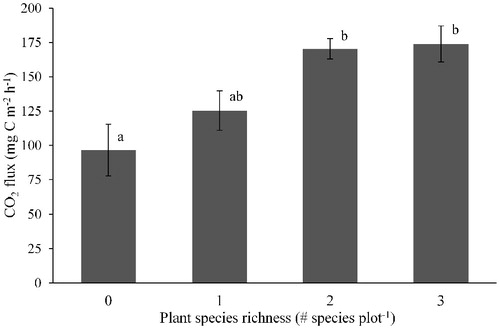
Average CO2 emission across all plots was three times greater in July than in September (). However, soil CO2 emission did not vary significantly across the hydrological gradient (, part b). July CO2 flux was not significantly explained by VWC or temperature, whereas September CO2 flux showed a strong positive correlation with both VWC and temperature (). Plant species richness was the best predictor of July CO2 flux (F = 5.18; P = 0.0039 in one-way ANOVA; ). September CO2 flux was positively related to soil C and N concentration, but showed no correlation with extractable NH4 + or NO3-concentrations ().
METHANE FLUX
Net uptake of atmospheric CH4 by soil predominated on both sampling dates (). Only 3 of the 48 plots (6%) showed net CH4 emission in July, and only 1 of the 24 plots (4%) in September. The remaining plots showed net CH4 uptake. Soil VWC and position on the hydrological gradient were the best predictors of CH4 flux (; , part c). Drier soils near the edge of the meadow consumed roughly five times more CH, than wetter soils near the middle of the meadow. Methane flux was not correlated with soil temperature in July, but was positively correlated with temperature in September when VWC and temperature strongly covaried. There was no correlation between September CH4 flux and soil concentrations of C, N, NH4 +, or NO3 - ().
TABLE 1 Soil chemistry, microclimate, and midday fluxes of carbon dioxide (CO2), methane (CH4), and nitrous oxide (N2O) along a 50-m hydrological gradient in a Sierra Nevada subalpine meadow early (July) and late (September) in the growing season.
NITROUS OXIDE FLUX
Soil N2O fluxes did not vary significantly between July and September, and mean N2O uptake occurred on both dates (). In July, N2O uptake occurred more often in wetter soils near the middle of the meadow, while N2O emission occurred more often in drier soils near the edge of the meadow (, , part d). In September, N2O flux did not show this pattern of hydrological control. Soil N2O flux was also positively related to temperature in July but showed no relationship with temperature in September. There was no correlation between September N2O flux and soil concentrations of C, N, NH4 +, or NO3- ().
FIGURE 1. Variation in (a) soil moisture 0–12 cm deep and fluxes of (b) carbon dioxide (CO2), (c) methane (CH4), and (d) nitrous oxide (N2O) along a 50-m hydrological gradient in a Sierra Nevada subalpine meadow. The gradient extended from the wet middle (0 m) to dry edge (50 m) of the meadow. Soil moisture and gas fluxes (mean ± standard error) were measured in July (black line; n = 8) and September (gray line; n = 4). The solid line indicates that the slope of the linear fit differed from zero at an alpha level of 0.05, and the dashed line indicates that the slope did not differ from zero. Negative fluxes indicate net uptake from the atmosphere to the soil, and positive fluxes indicate net emission from the soil to the atmosphere.
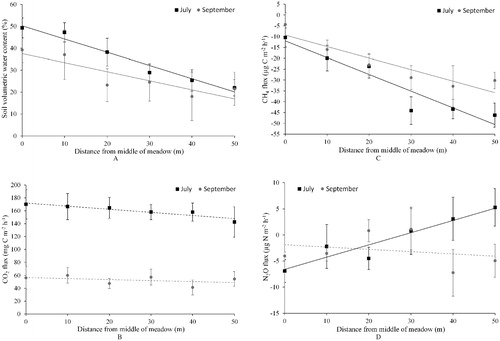
FIGURE 2. Variation in soil CO2 emission in July associated with plant species richness. Bars show means and standard errors. Letters indicate significant differences in Tukey's HSD test at an alpha level 0.05. There were 4, 7, 24, and 11 observations for plant species richness of 0, 1, 2, and 3, respectively.
RADIATIVE FORCING
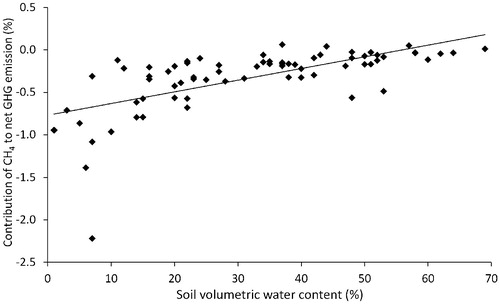
An accounting of CO2, CH4, and N2O fluxes in terms of CO2-equivalents showed that average GHG emission was three times greater in July than in September (). This difference was primarily due to reduced CO2 emission in September because CO2 was responsible for over 98.5% of net GHG emission. Net GHG emission did not vary significantly with soil VWC in July (F = 3.04; P = 0.088; R2 adj = 0.04; y = 0.067x + 11.69), but net GHG emission and soil VWC were positively correlated in September (F = 26.18; P < 0.0001; R2 adj = 0.52; y = 0.082x + 2.35; ). Methane uptake contributed more to GHG emissions reduction in September than in July. Soil N2O fluxes increased net GHG emission in July (by a maximum of 4%), but reduced GHG emission in September (by a maximum of 11%). The “cooling effect” of CH4 uptake increased with drying (linear fit: F = 48.02; P < 0.0001; R2 adj = 0.40; y = 0.014x - 0.77) and was greatest in soils drier than 10% VWC (), or ∼6% GWC.
TABLE 2 Relation between greenhouse gas fluxes (CO2, CH4, and N2O), soil microclimate, and chemistry in a subalpine meadow early (July) and late (September) in the growing season.
TABLE 3 Net greenhouse gas (GHG) emission and relative contribution of methane (CH4) and nitrous oxide (N2O) fluxes to radiative forcing in a subalpine meadow.
FIGURE 3. Relation between soil volumetric water content and net greenhouse gas (GHG) emission in July (solid line) and September (dashed line). Solid line indicates that the slope of the linear regression was significantly different from zero at an alpha level of 0.05, and dashed line indicates that the slope was not significantly different from zero. Net GHG emission in each plot was calculated as the net flux of carbon dioxide equivalents (CO2e) based on the radiative forcing per mole of carbon dioxide (1), methane (25), and nitrous oxide (298).
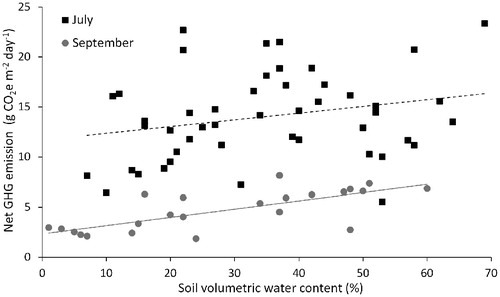
FIGURE 4. Relation between soil volumetric water content and the contribution of methane (CH4) to net greenhouse gas (GHG) emission. The regression indicates a significant linear fit across sampling dates at an alpha level of 0.05. The contribution of CH4 to net GHG emission in each plot was calculated as the CO2-equivalents consumed or produced by soil as CH4 (CO2e methane) divided by the total soil GHG emission including CO2 and N2O (CO2e total), and then multiplied by 100%. Negative values indicate a decrease in CO2etotal and a net cooling effect.
Discussion
Our goal was to capture spatial variability of multiple GHG fluxes to infer their abiotic and biotic controls using a soil moisture gradient. Despite half as much water in surface soil at the edge of the meadow, CO2 emission showed no obvious spatial pattern across the hydrological gradient on either date. Soil moisture was less important than we expected in explaining CO2 fluxes. Soil CO2 emission varied more in time than in space, likely because later in the growing season there was reduced plant root respiration, greater microbial C limitation, and colder temperatures (CitationJiang et al., 2010). Early in the growing season, soil CO2 fluxes (but not CH4 or N2O fluxes) were best explained by a positive correlation with plant species richness. The plots with no aboveground plant growth (i.e., richness = 0) emitted the least amount of CO2. This suggests that the abundance and resource utilization of plants were linked to spatial patterns of soil CO2 emission. Root respiration, exudates, and priming of soil organic matter in the rhizosphere could drive this spatial pattern (CitationBird et al., 2011; CitationGeng et al., 2012; CitationGuenet et al., 2012). Drought conditions can increase the occurrence of bare ground in montane meadows (CitationDebinski et al., 2010), and, in our study, bare ground was associated with roughly one-third less soil CO2 emission. Root respiration, therefore, perhaps accounted for a maximum of 30% of soil respiration.
It was not until later in the dry season that CO2 emission showed signs of water limitation. For example, CO2 emission and soil moisture showed a strong positive correlation in September (mean VWC = 27%) but not in July (mean VWC = 35%). However, the large seasonal reduction in CO2 emission even on the wet side of the hydrological gradient suggests that labile carbon was more limiting than water. And if microbial and plant respiration were water stressed in drier soils, then less CO2 production in shallow soil was apparently compensated by greater CO2 transport from deeper, wetter soil (CitationPacific et al., 2008). Whatever the mechanism, we found that topographic position within the meadow, and associated variation in near-surface soil moisture, had little influence on rates of CO2 emission during the growing season.
We also find it surprising that, at least on our sampling dates, the wet middle of the meadow rarely emitted CH4. In contrast to a Rocky Mountain subalpine meadow (CitationMosier et al., 1993) and a lower-elevation Sierra Nevada wetland (CitationOates et al., 2008), the subalpine meadow that we studied emitted little CH4, perhaps because of a lower water table (CitationSmith et al., 2003) or the coarse-textured, well-drained soils in the High Sierra (USDA NRCS, 2007; CitationBales et al., 2011). It is also likely that we missed pulses of CH4 emission in the middle of the meadow during thawing and postsnowmelt flooding (CitationMosier et al., 1993). The edge of the meadow showed more CH4 uptake, supporting the negative relationship between soil moisture and CH4 consumption in montane meadows (CitationMosier et al., 1993; CitationTorn and Harte, 1996; CitationLin et al., 2009; CitationJiang et al., 2010). Drier soils transport more atmospheric oxygen and CH4, thus inhibiting methanogenesis and reducing diffusional limitation on methanotrophy (CitationConrad, 1996; CitationHanson and Hanson, 1996). Therefore, CH4 fluxes varied more predictably than CO2 and N2O fluxes, showing little temporal variation and a high degree of spatial organization according to soil moisture.
As the first measurements of field N2O fluxes in a high-elevation Sierra Nevada meadow, it surprised us that net N2O consumption was so prevalent. We expected wet soils to emit more N2O because of less oxygen and greater denitrification (CitationSmith et al., 2003). Instead, it appears that nitrification was the main source of N2O (CitationFirestone and Davidson, 1989; CitationStark et al., 2002), at least when surface soil was warm enough (i.e., July) and dry enough (i.e., edge of meadow). Drier conditions increase oxygen diffusion into the soil from the atmosphere and may prevent denitrifying microbes from reducing N2O to dinitrogen gas (N2), thus increasing N2O emission (CitationBurgin and Groffman, 2012). Wetter conditions, on the other hand, can favor the reduction of N2O to N , causing less N2O production (CitationAvrahami and Bohannan, 2009) or net N2O consumption, especially when soil NO3-concentration is sufficiently low (<1 mg N kg-1; CitationRosenkranz et al., 2005; CitationChapuis-Lardy et al., 2007; CitationWu et al., 2013). Observed rates of N2O uptake were greater than those found in other meadows (CitationMosier et al., 1993; CitationFilippa et al., 2009; CitationJiang et al., 2010), and rates of N2O emission were an order of magnitude lower than other meadows (CitationFilippa et al., 2009; CitationLin et al., 2009; CitationHu et al., 2010), but similar to a lowelevation Sierra Nevada wetland (CitationOates et al., 2008). Mosier et al. (Citation1993) found the highest rates of N2O emission in a Rocky Mountain meadow 3 to 7 weeks after snowmelt, which is the time period when we first visited our site. However, the N2O pulse could have happened earlier; during spring thaw, for example (CitationChristensen and Tiedje, 1990). There is evidence from a variety of Sierra Nevada ecosystems—including a wet meadow—that the largest N2O pulse from denitrification occurs during winter instead of summer (CitationWalker et al., 1992). The Sierra Nevada meadow we studied supports this pattern because it was not a strong N2O source during the growing season, and it could perhaps switch from sink to source with future climate-induced soil drying.
Methane and N2O contributed most to the net GHG flux on the dry side of the hydrological gradient, not the wet side as predicted. Net GHG emission was foremost determined by CO2, but CH4 and N2O were more important to account for in drier soils and later in the growing season after plant senescence. In terms of CO2-equivalents, CH4 consumption in drier soils reduced GHG emission by up to 2%. This contribution of CH4 uptake to the net GHG flux was greater than found in a Tibetan Plateau meadow (-0.2%), despite similar ranges of soil moisture and temperature (CitationJiang et al., 2010). Soil N2O production at our site accounted for up to 4% of GHG emission in relatively warm (July) and dry soils (edge of meadow). In colder (September) and wetter soils (middle of meadow), however, N2O consumption reduced net GHG emission by up to 11%. Although the spatially averaged N2O flux for July showed consumption, the negative correlation between CO2 emission and N2O emission (P = 0.0016; R2 adj = 0.18; N = 48) probably explains why N2O showed an overall positive—albeit small—contribution to radiative forcing. Because lower CO2 emission indicates bare ground, perhaps less N uptake by plants resulted in more N available for N2O emission. Unfortunately, we did not measure soil N concentrations earlier in the growing season. Nevertheless, the warming effect of N2O emission at the edge of the meadow slightly outweighed the cooling effect at the middle of the meadow. These results demonstrate the potential for hydrological changes in highelevation meadows to impact both the magnitude and direction of the effects of non-CO2 GHGs on net radiative forcing.
Because of the low sampling frequency (twice during the snow-free season), we had no intention of upscaling to an annual GHG budget, or upscaling beyond this single meadow. We no doubt missed important GHG emissions during freeze-thaw and flooding events in the winter and spring before we could access the site (CitationTeepe et al., 2001; CitationGoldberg et al., 2008; CitationLiptzin et al., 2009). Another limitation of our study is that soil chemistry was measured only on one date; thus we cannot determine the relative importance of hydrology vs. chemistry in explaining GHG fluxes across dates. Our intention—rather—was to use space as a surrogate for time to indicate what happens when the soil dries during the summer and what could happen when the climate dries in the future.
In conclusion, we found no evidence that the wet middle of a montane meadow was a hotspot of GHG emission during the snowfree season compared to the drier edges. Soil CO2 and net GHG emission varied little across the hydrological gradient. However, soil drying enhanced CH4 uptake and N2O emission, at least in the short-term, which highlights the importance of quantifying the balance of non-CO2 gases for GHG budgets in heterogeneous montane landscapes. Other factors could also interact with hydrological changes in highelevation meadows to impact GHG fluxes. For example, recreational packstock use and livestock grazing, which are common in Sierra Nevada meadows, can compact soil (i.e., less gas diffusivity and waterfilled pore space), increase coverage of bare ground, and alter C and N inputs to soil (CitationKosco and Bartolome, 1981; CitationMcClaran, 1989; CitationCole et al., 2004), perhaps creating a more heterogeneous pattern of GHG emission with more hotspots. Furthermore, shifts in meadow plant community composition associated with climate change, exotic species, and conifer encroachment could impact C and N inputs, microclimate (CitationDyer and Moffett, 1999; CitationHaugo and Halpern, 2007; CitationDebinski et al., 2010; CitationZald et al., 2012), and thus GHG fluxes. Amidst all these changes, hydrological gradients in montane meadows can serve as the context for spatial upscaling and an improved understanding of the underlying mechanisms of GHG emissions.
Acknowledgments
We thank NSF-supported REU student Alison Nill for her essential help with site selection, field logistics, field measurements, and data analysis. We thank Elizabeth Ballenger and Eric Berlow for sharing important data regarding site selection. We thank Emma McCorkle, Erin Stacy, and Steven Lee for their help with field measurements, laboratory measurements, and data analysis. We thank Carol, Kira, and Lukas Hart for their help with September gas sampling. We thank Sally Thompson and Vincent Pacific for ideas on interpreting data. We also thank the Resources Management and Science Division at Yosemite National Park and the National Park Service for providing the venue and logistical support for this project. This research was financially supported by the National Science Foundation's Research Experience for Undergraduates Program (Award ID-0649092) and the Kearney Foundation of Soil Science (Kearney-2009.023).
Related Research Data
References Cited
- Avrahami, S. , and Bohannan, B. J. M. , 2009: N2O emission rates in a California meadow soil are influenced by fertilizer level, soil moisture and the community structure of ammonia-oxidizing bacteria. Global Change Biology , 15: 643–655.
- Bales, R. C. , Hopmans, J. W. , O'Geen, A. T. , Meadows, M. , Hartsough, P. C. , Kirchner, P. , Hunsaker, C. T. , and Beaudette, D. , 2011: Soil moisture response to snowmelt and rainfall in a Sierra Nevada mixed-conifer forest. Vado se Zone Journal , 10: 786–799.
- Barnett, T. P. , Adam, J. C. , and Lettenmaier, D. P. , 2005: Potential impacts of warming climate on water availability in snow-dominated regions. Nature , 438: 303–309.
- Bird, J. A. , Herman, D. J. , and Firestone, M. K. , 2011: Rhizosphere priming of soil organic matter by bacterial groups in a grassland soil. Soil Biology and Biochemistry , 43: 718–725.
- Bürgin, A. J. , and Groffman, P. M. , 2012: Soil O2 controls denitrification rates and N2O yield in a riparian wetland. Journal of Geophysical Research , 117: G01010, doi: http://dx.doi.org/10.1029/2011JG001799 .
- Chapuis-Lardy, L. , Wrage, N. , Metay, A. , Chotte, J.-L. , and Bernoux, M. , 2007: Soils, a sink for N2O? A review. Global Change Biology , 13: 1–17.
- Christensen, S. , and Tiedje, J. M. , 1990: Brief and vigorous N2O production by soil at spring thaw. Journal of Soil Science , 41: 1–1.
- Cole, D. N. , van Wagtendonk, J. W. , McClaran, M. P. , Moore, P. E. , and McDougald, N. K, 2004: Response of mountain meadows to grazing by recreational pack stock. Journal of Range Management , 57: 153–160.
- Conrad, R. , 1996: Soil microorganisms as controllers of atmospheric trace gases (H2, CO, CH4, OCS, N2O, and NO). Microbiological Reviews , 60: 609–640.
- Correia, A. C. , Minunno, F. , Caldeira, M. C. , Banza, J. , Mateus, J. , Carneiro, M. , Wingate, L. , Shvaleva, A. , Ramos, A. , Jongen, M. , Bugalho, M. N. , Nogueira, C. , Lecomte, X. , and Pereira, J. S. , 2012: Soil water availability strongly modulates soil CO2 efflux in different Mediterranean ecosystems: model calibration using Bayesian approach. Agriculture Ecosystems and Environment , 161: 88–100.
- Curiel Yuste, J. , Baldocchi, D. D. , Gershenson, A. , Goldstein, A. , Misson, L. , and Wong, S. , 2007: Microbial soil respiration and its dependency on carbon inputs, soil temperature and moisture. Global Change Biology , 13: 2018–2035.
- Debinski, D. M. , Wickham, H. , Kindscher, K. , Caruthers, J. C. , and Germino, M. , 2010: Montane meadow change during drought varies with background hydrologic regime and plant functional group. Ecology , 91: 1672–1681.
- Dyer, J. M. , and Moffett, K. E. , 1999: Meadow invasion from high-elevation spruce-fir forest in south-central New Mexico. The Southwestern Naturalist , 44: 444–456.
- Filippa, G. , Freppaz, M. , Williams, M. W. , Helmig, D. , Liptzin, D. , Seok, B. , Hall, B. , and Chowanski, K. , 2009: Winter and summer nitrous oxide and nitrogen oxides fluxes from a seasonally snow-covered subalpine meadow at Niwot Ridge, Colorado. Biogeochemistry , 95: 131–149.
- Firestone, M. K. , and Davidson, E. A. , 1989: Microbiological basis of NO and N2O production and consumption in soil. In Andreae, M. O. , and Schimel, D. S. (eds.), Exchange of Trace Gases between Terrestrial Ecosystems and the Atmosphere. New York: John Wiley & Sons.
- Fisk, M. C. , Schmidt, S. K. , and Seastedt, T. R. , 1998: Topographic patterns of above- and belowground production and nitrogen cycling in alpine tundra. Ecology , 79: 2253–2266.
- Forster, P. , Ramaswamy, V. , Artaxo, P. , Berntsen, T. , Betts, R. A. , Fahey, D. W. , Haywood, J. , Lean, J. , Lowe, D. C. , Myhre, G. , Nganga, J. , Prinn, R. , Raga, G. , Schulz, M. , and Van Dorland, R. , 2007: Changes in atmospheric constituents and in radiative forcing. In Solomon, S. , Qin, D. , Manning, M. , Chen, Z. , Marquis, M. , Averyt, K. B. , Tignor, M. , and Miller, H. L. (eds.), Climate Change 2007: The Physical Science Basis. Contribution of Working Group I to the Fourth Assessment Report of the Intergovernmental Panel on Climate Change. Cambridge and New York: Cambridge University Press, 129–234.
- Fu, G. , Shen, Z. , Zhang, X. , and Zhou, Y. , 2012: Response of soil microbial biomass to short-term experimental warming in alpine meadow on the Tibetan Plateau. Applied Soil Ecology , 61: 158–160.
- Geng, Y. , Wang, Y. , Yang, K. , Wang, S. , Zeng, H. , Baumann, F. , Kuehn, P. , Scholten, T. , and He, J.-S. , 2012: Soil respiration in Tibetan alpine grasslands: belowground biomass and soil moisture, but not soil temperature, best explain the large-scale patterns. PLoS ONE , 7: e34968, doi: http://dx.doi.org/10.1371/journal.pone.0034968 .
- Giles, M. , Morley, N. , Baggs, E. M. , and Daniell, T. J. , 2012: Soil nitrate reducing processes—Drivers, mechanisms for spatial variation, and significance for nitrous oxide production. Frontiers in Microbiology , 3: doi: http://dx.doi.org/10.3389/fmicb.2012.00407 .
- Goldberg, S. D. , Muhr, J. , Borken, W. , and Gebauer, G. , 2008: Fluxes of climate-relevant trace gases between a Norway spruce forest soil and atmosphere during repeated freeze-thaw cycles in mesocosms. Journal of Plant Nutrition and Soil Science , 171: 729–739.
- Grayson, R. B. , and Western, A. W. , 1998: Towards areal estimation of soil water content from point measurements: time and space stability of mean response. Journal of Hydrology , 207: 68–82.
- Guenet, B. , Juarez, S. , Bardoux, G. , Abbadie, L. , and Chenu, C. , 2012: Evidence that stable C is as vulnerable to priming effect as is more labile C in soil. Soil Biology and Biochemistry , 52: 43–48.
- Hanson, R. S. , and Hanson, T. E. , 1996: Methanotrophic bacteria. Microbiological Reviews , 60: 439–471.
- Hart, S. C. , 2006: Potential impacts of climate change on nitrogen transformations and greenhouse gas fluxes in forests: a soil transfer study. Global Change Biology , 12: 1032–1046.
- Harte, J. , Torn, M. S. , Chang, R.-R. , Feifarek, B. , Kinzig, A. P. , Shaw, R. , and Shen, K. , 1995: Global warming and soil microclimate: results from a meadow-warming experiment. Ecological Applications , 5: 132–150.
- Haugo, R. D. , and Halpern, C. B. , 2007: Vegetation responses to conifer encroachment in a western Cascade meadow: a chronosequence approach. Canadian Journal of Botany , 85: 285–298.
- Hu, Y. , Chang, X. , Lin, X. , Wang, Y. , Wang, S. , Duan, J. , Zhang, Z. , Yang, X. , Luo, C. , Xu, G. , and Zhao, X. , 2010: Effects of warming and grazing on N2O fluxes in an alpine meadow ecosystem on the Tibetan plateau. Soil Biology and Biochemistry , 42: 944–952.
- Hutchinson, G. L. , and Mosier, A. R. , 1981: Improved soil cover method for field measurements of nitrous oxide fluxes. Soil Science Society of America Journal , 45: 311–316.
- Jeong, S. , Zhao, C. , Andrews, A. E. , Bianco, L. , Wilczak, J. M. , and Fischer, M. L. , 2012: Seasonal variation in CH4 emissions from central California. Journal of Geophysical Research , 117: D11306, doi: http://dx.doi.org/10.1029/2011JD016896 .
- Jiang, C. , Yu, G. , Fang, H. , Cao, G. , and Li, Y. , 2010: Short-term effect of increasing nitrogen deposition on CO2, CH4, and N2O fluxes in an alpine meadow on the Qinghai-Tibetan Plateau, China. Atmospheric Environment , 44: 2920–2926.
- Kato, T. , Tang, Y. , Gu, S. , Cui, X. , Hirota, M. , Du, M. , Li, Y. , Zhao, X. , and Oikawa, T. , 2004: Carbon dioxide exchange between the atmosphere and an alpine meadow ecosystem on the Qinghai-Tibetan Plateau, China. Agricultural and Forest Meteorology , 124: 121–134.
- Kato, T. , Tang, Y. , Gu, S. , Hirota, M. , Du, M. , Li, Y. , and Zhao, X. , 2006: Temperature and biomass influences on interannual changes in CO2 exchange in an alpine meadow on the Qinghai-Tibetan Plateau. Global Change Biology , 12: 1285–1298.
- Keel er-Wolf, T. , Moore, P. E. , Reyes, E. T. , Menke, J. M. , Johnson, D. N. , and Karavidas, D. L. , 2012: Yosemite National Park vegetation classification and mapping project report. Fort Collins, Colorado: National Park Service, Natural Resource Technical Report NPS/ YOSE/NRTR-2012/598.
- Kosco, B. H. , and Bartolome, J. W. , 1981: Forest grazing: past and future. Journal of Range Management , 34: 248–251.
- Lin, X. , Wang, S. , Ma, X. , Xu, G. , Luo, C. , Li, Y. , Jiang, G. , and Xie, Z. , 2009: Fluxes of CO2, CH4, and N2O in an alpine meadow affected by yak excreta on the Qinghai-Tibetan Plateau during the summer grazing periods. Soil Biology and Biochemistry , 41: 718–725.
- Liptzin, D. , Williams, M. W. , Helmig, D. , Seok, B. , Filippa, G. , Chowanski, K. , and Hueber, J. , 2009: Process-level controls on CO, fluxes from a seasonally snow-covered subalpine meadow soil, Niwot Ridge, Colorado. Biogeochemistry , 95: 151–166.
- Lowry, C. S. , Deems, J. S. , Loheide, S. P. , and Lundquist, J. D. , 2010: Linking snowmelt-derived fluxes and groundwater flow in a high elevation meadow system, Sierra Nevada Mountains, California. Hydrological Processes , 24: 2821–2833.
- McClaran, M. P. , 1989: Recreational pack stock management in Sequoia and Kings Canyon National Parks. Rangelands , 11: 3–8.
- Mosier, A. R. , Klemedtsson, L. K. , Sommerfeld, R. A. , and Musselman, R. C. , 1993: Methane and nitrous oxide flux in a Wyoming subalpine meadow. Global Biogeochemical Cycles , 7: 771–784.
- Mote, P. W. , Hamlet, A. F. , Clark, M. P. , and Lettenmaier, D. P. , 2005: Declining mountain snowpack in western North America. Bulletin of the American Meteorological Society , 86: 39–49.
- Niklaus, P. A. , Wardle, D. A. , and Tate, K. R. , 2006: Effects of plant species diversity and composition on nitrogen cycling and the trace gas balance of soils. Plant and Soil , 282: 83–98.
- Oates, L. G. , Jackson, R. D. , and Allen-Diaz, B. , 2008: Grazing removal decreases magnitude of methane and the variability of nitrous oxide emissions from spring-fed wetlands of a California oak savanna. Wetlands Ecology and Management , 16: 395–404.
- Pacific, V. J. , McGlynn, B. L. , Riveros-Iregui, D. A. , Welsch, D. L. , and Epstein, H. E. , 2008: Variability in soil respiration across riparian-hillslope transitions. Biogeochemistry , 91: 51–70.
- Pacific, V. J. , McGlynn, B. L. , Riveros-Iregui, D. A. , Epstein, H. E. , and Welsch, D. J. , 2009: Differential soil respiration responses to changing hydrologic regimes. Water Resources Research , 45: W07201, doi: http://dx.doi.org/10.1029/2009WR007721 .
- Pacific, V. J. , McGlynn, B. L. , Riveros-Iregui, D. A. , Welsch, D. L. , and Epstein, H. E. , 2011: Landscape structure, groundwater dynamics, and soil water content influence soil respiration across riparian-hillslope transitions in the Tenderfoot Creek Experimental Forest, Montana. Hydrological Processes , 25: 811–827.
- Riveros-Iregui, D. A. , and McGlynn, B. L. , 2009: Landscape structure control on soil CO2 efflux variability in complex terrain: scaling from point observations to watershed scale fluxes. Journal of Geophysical Research , 114: G02010, doi: http://dx.doi.org/10.1029/2008JG000885 .
- Rosenkranz, P. , Brüggermann, N. , Papen, H. , Xu, Z. , Seufert, G. , and Butterback-Bahl, K. , 2005: N2O, NO and CH4 exchange, and microbial N turnover over a Mediterranean pine forest soil. Biogeosciences Discussions , 2: 673–702.
- Saito, M. , Kato, T. , and Tang, Y. , 2009: Temperature controls on ecosystem CO2 exchange of an alpine meadow on the northeastern Tibetan Plateau. Global Change Biology , 15: 221–228.
- Saleska, S. R. , Harte, J. , and Torn, M. , 1999: The effect of experimental ecosystem warming on CO2 fluxes in a montane meadow. Global Change Biology , 5: 125–141.
- Seager, R. , Ting, M. , Held, I. , Kushnir, Y. , Lu, J. , Vecchi, G. , Huang, H.-P. , Harnik, N. , Leetmaa, A. , Lau, N.-C. , Li, C. , Velez, J. , and Naik, N. , 2007: Model projections of an imminent transition to a more arid climate in southwestern North America. Science , 316: 1181–1184.
- Smith, K. A. , Ball, T. , Conen, F. , Dobbie, K. E. , Massheder, J. , and Rey, A. , 2003: Exchange of greenhouse gases between the soil and atmosphere: interactions of soil physical factors and biological processes. European Journal of Soil Science , 54: 779–791.
- Stark, J. M. , Smart, D. R. , Hart, S. C. , and Haubensak, K. A. , 2002: Regulation of nitric oxide emissions from forest and rangeland soils of western North America. Ecology , 83: 2278–2292.
- Stewart, I. T. , Cay an, D. R. , and Dettinger, M. D. , 2005: Changes toward earlier streamflow timing across western North America. Journal of Climate , 18: 1136–1155.
- Suh, S. , Lee, E. , and Lee, J. , 2009: Temperature and moisture sensitivities of CO2 efflux from lowland and alpine meadows. Journal of Plant Ecology , 2: 225–231.
- Teepe, R. , Brumme, R. , and Beese, F. , 2001: Nitrous oxide emissions from soil during freezing and thawing periods. Soil Biology and Biochemistry , 33: 1269–1275.
- Torn, M. S. , and Harte, J. , 1996: Methane consumption by montane soils: implications for positive and negative feedback with climatic change. Biogeochemistry , 32: 53–67.
- USDA NRCS , 2007: Soil survey of Yosemite National Park, California. U.S. Department of Agriculture, Natural Resources Conservation Service, <http://soils.usda.gov/surve/printed_survey/>.
- Walker, R. F. , Hixson, S. E. , and Skau, C. M. , 1992: Soil denitrification rates in a subalpine watershed of the eastern Sierra Nevada. Forest Ecology and Management , 50: 217–231.
- Western, A. W. , Grayson, R. B. , Blöschl, G. , Willgoose, G. R. , and McMahon, T. A. , 1999: Observed spatial organization of soil moisture and its relation to terrain indices. Water Resources Research , 35: 797–810.
- Whalen, S. C. , 2005: Biogeochemistry of methane exchange between natural wetlands and the atmosphere. Environmental Engineering Science , 22: 73–94.
- WRCC , 2009: Western U.S. Climate Historical Summaries, 1924–2009. Western Regional Climate Center, Desert Research Institute, http://www.wrcc.dri.edu/climsum.html/ .
- Wu, D. , Dong, W. , Oenema, O. , Wang, Y. , Trebs, I. , and Hu, C. , 2013: N2O consumption by low-nitrogen soil and its regulation by water and oxygen. Soil Biology and Biochemistry , 60: 165–172.
- Zald, H. S. J. , Spies, T. A. , Huso, M. , and Gatziolis, D. , 2012: Climatic, landform, microtopographic, and overstory canopy controls of tree invasion in a subalpine meadow landscape, Oregon Cascades, USA. Landscape Ecology , 27: 1197–1212.