
Abstract
While elution processes of ions and solutes from alpine and arctic snowpacks are well known, the scientific knowledge of the effects on microbial cells and their link to glacial surface ecology during this period is very limited. Here we show that dissolved substances are eluted from a High Arctic snowpack according to previous reports, while the microbial cells are retained and most likely also proliferate. Their retention enhances the interaction between the snowpack-derived microorganisms and microbial communities living on the surface of glaciers, a habitat known for its cell retention, especially those associated with debris known as cryoconite. Microbial biomass is retained during all stages of the summer ablation upon these Arctic glaciers, emphasizing the need to explore the feedback between microbial growth and meltwater biogeochemistry. Furthermore, the snowpack stratigraphy at Midtre Lovénbreen, Svalbard, shows a frequently low abundance of cells, typically corresponding to those of cloud water. However, a few layers show higher bacterial numbers (up to 104 cells mL−1) that occur with an increase of dust particles and most likely originate from local sources.
Introduction
During winter, the northern hemisphere experiences the development and subsequent melt of seasonal snow that can cover up to around 50% of its landmasses (CitationRobinson et al., 1993; CitationRobinson and Frei, 2000). The snow cover plays a key role in many ecosystems insulating the ground and influencing nutrient supply to the soil and vegetation beneath (e.g., CitationJones, 1999; CitationBjörkman et al., 2010). It also resembles an ecosystem in its own right as it harbors a range of different microorganisms (CitationJones, 1991, Citation1999; CitationEdwards et al., 2007). The process of snow formation within the atmosphere requires a nucleation surface to initiate freezing (CitationColbeck, 1981). This nucleation surface is usually composed of ice splinters, clay particles, or other water-insoluble substances (CitationKuhn, 2001). Indeed, cloud condensation and ice nucleation within the atmosphere can also be catalyzed by biological agents, such as bacteria or fungal spores (see CitationJayaweera and Flanagan, 1982; CitationMorris et al., 2007; CitationChristner et al., 2008; CitationDelort et al., 2010), even though the significance of these processes might be of minor importance when other nuclei are abundant (CitationJunge and Swanson, 2008; CitationDiehl and Wurzler, 2010; CitationHoose et al., 2010). After deposition from the atmosphere (via dry and wet deposition), snowpack microbial communities may start thriving when the conditions become favorable (CitationChristner, 2002; CitationSegawa et al., 2005; CitationBakermans and Skidmore, 2011). It has been shown that bacteria can grow even prior to deposition in the super-cooled droplets within clouds (CitationSattler et al., 2001) and that snow and ice contain viable cells that are capable of active metabolism, probably as long as liquid water is present (CitationChristner, 2002; CitationPrice and Sowers, 2004; CitationAmato et al., 2009; CitationVaitilingom et al., 2010; CitationBakermans and Skidmore, 2011). Despite the metabolic constraints under such conditions, bacterial growth has relevance for the inoculation process of supraglacial communities, but also for the breakdown or bioaccumulation of biologically active compounds within the snow (e.g., CitationLarose et al., 2011; CitationStibal et al., 2012). The cells released from the snowpack also influence microbial assemblages in underlying lakes and streams, as has been shown by Mindl et al. (Citation2007). Studies of microbial dynamics and cell abundance within polar and alpine glacial snow are therefore required before the full ecological significance of seasonal snow can be understood for these regions.
When a snowflake grows in the atmosphere, or precipitates, it can absorb gases, aerosols, and supercooled droplets (CitationColbeck, 1981; CitationAbbatt, 1997; CitationKuhn, 2001; CitationHoog et al., 2007). The large surface area of snowflakes leads to an efficient scavenging and removal of atmospheric pollutants (CitationChang, 1984; CitationBarrie, 1991; CitationLei and Wania, 2004), which then end up in the snow cover. The snowpack of the High Arctic archipelago of Svalbard is characterized by the dominance of sea salt in its solute (CitationHodgkins and Tranter, 1998) and with a bacterial content that is slightly higher than in Alpine regions (CitationSattler et al., 2001; CitationBauer et al., 2002; CitationAmato et al., 2007). Due to the archipelago's remote location, small human population, and scarce local pollution sources, the region acts as a sink for atmospheric contaminants from long-range transport (CitationRahn et al., 1980; CitationStohl, 2006; CitationHirdman et al., 2010). As an example, a recent study of climatology and precipitation chemistry showed that the total burden of nitrate (NO3 -), ammonium (NH4 +), and sulfate (SO4 2-) to Svalbard is governed by single deposition events that can account for more than 50% of the total annual deposition of these compounds (CitationKühnel et al., 2011). These deposition events are linked to a rapid transport of polluted European air masses, which are forced northward toward Svalbard between incoming Atlantic cyclones and blocking high pressure systems situated over Scandinavia and mid-Europe (CitationKühnel, 2013).
When snow melt starts, elution of its solutes occurs, and the first meltwater will be enriched in ions compared to the snowpack (e.g., CitationLilbaek and Pomeroy, 2008); typically, the first 20–30% of the meltwater will contain 50–80% of the snowpack solutes (CitationJohannessen et al., 1975; CitationBales et al., 1989). However, very little is known about the mobility of bacterial cells within the snowpack during this period. For inorganic ions, the elution sequence typically follows SO4 2-, NO3 -, Cl-, metals and most cations, other anions, NH4 +, and H2O2 (CitationKuhn, 2001, and references therein), but depends on the characteristics of the snowpack, for instance on the amount of melt/freeze cycles before and during melt (CitationColbeck, 1981; CitationBrimblecombe et al., 1986; CitationBales et al., 1989; CitationCragin et al., 1996). The elution of chemical solutes, including nutrients, then affects both the microbial habitats within the snow (CitationHodson, 2006; CitationLarose et al., 2010a), and underlying soils and ice layers (CitationJones, 1991, Citation1999; CitationSchmidt et al., 1999; CitationEdwards et al., 2007), but also ecosystems downstream (e.g., CitationGagne et al., 2009).
The influence of snowpack elution is also important for the understanding of ice core records where the initial signal might be altered due to relocation or loss of ions (e.g., CitationHou and Qin, 2002; CitationGrinsted et al., 2006). Under such melt conditions, the use of microbial cells as more reliable annual stratigraphy markers in the ice core has been undertaken (CitationYoshimura et al., 2000). As the snowpack is inhabited also by active cells (CitationSattler et al., 2001, Citation2002), it is crucial to reveal possible effects on the release or retention of cells in relation to dissolved chemical solutes, which are either a potential substrate for metabolism or necessary as nitrogen source (e.g., NH4 +, NO3 -). A previous study of Arctic snow and meltwater indicates that there is a change in the snow microbial diversity between early and late spring, with a higher diversity in the meltwater than in the snow (CitationLarose et al., 2010a). This insight is strengthened by evidence for bacterial post-depositional processes within high alpine snow (CitationXiang et al., 2009).
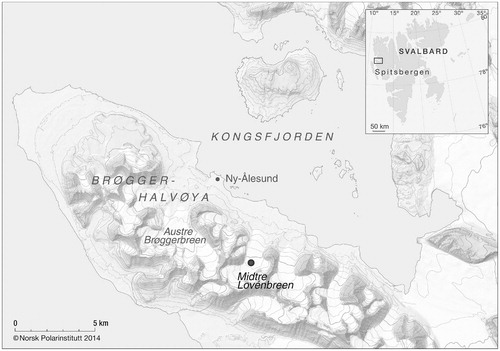
FIGURE 1. Map of sampling location at Midtre Lovénbreen close to Ny-Ålesund, Svalbard (Norsk Polar Institute).
This work aims for a better understanding of cell and ion distribution within High Arctic snowpacks and their relative relocation by meltwater during the summer period. The abundance of cells and the concentrations of ions in the snowpack were assumed to reflect their deposition history, where earlier investigations have shown a homogeneous distribution of cells within Svalbard snow: 2 × 10⁴ to 2 × 10⁵ mL-1 (CitationAmato et al., 2007). On the other hand, deposition of ions, as NO3 - and SO4 2+, are typically event based in this region of the Arctic (CitationKühnel et al., 2011). The elution of ions was assumed to follow the well-established sequences (e.g., CitationKuhn, 2001), while the behavior of microbial cells was assumed to depend on their relative location within the snow crystals (i.e., as ice nuclei or wind deposited) and/or ability to aggregate.
Method
FIELD SAMPLING
Snowpack meltwater was sampled from a snow pit at the High Arctic glacier, Midtre Lovénbreen (N78°52′48.5″; E12°02′27.6″and 268 m a.s.l.), close to the research facilities in Ny-Ålesund, Svalbard (). The experimental set-up of the snow pit (approx. 10 × 4 m) was established on June 16, 2010, when six half-pipe-shaped lysimeters were installed in parallel approximately 10 cm above the superimposed ice to prevent potential inflow of water percolating along the glacial surface (). The establishment of the snow pit, and the work afterward, was conducted using normal precautions to minimize contamination (see CitationTwickler and Whitlow, 1997, and description below). Due to the sporadic onset of snow melt in 2010, with warm conditions already in early May followed by cool conditions until June, the lysimeters were allocated at a site where the snow profiles showed no evidence of metamorphosis in the deeper parts of the snowpack.
The snowpack was sampled according to its stratigraphy at the start of the survey down to the glacial surface to capture concentrations and cell abundance of individual layers. An area of 20 × 20 cm and the full thickness of each layer were collected. A bulk sample of the entire snow column was also sampled along with the stratigraphy samples for comparison. Bulk samples were excavated from the remaining snow at the end of the experiment (30 June 2010), when the individual layers of the snowpack were metamorphosed into a homogeneous snowpack.
Elution was sampled into Nasco Whirl-Pak® bags fixed to the outflow end of the lysimeters. The bags were changed once a day at noon, covering a melt period between 19 and 30 June 2010, and all samples were brought back to the lab for analysis. All sampling equipment (half-pipes, shovels, scrapers, etc.) were precleaned with methanol and rinsed three times with ultrapure water before use. All sampling and following lab work were conducted using sterile, powder-free plastic gloves.
ANALYSIS
For the analysis of bacterial cell abundance, water was brought to Ny-Ålesund, where it was properly mixed in the Whirl-Pak bags and 2 × 50 mL were transferred to sterile centrifuge tubes followed by fixation via formaldehyde addition, with a final concentration of 2%. The 37% formaldehyde used was prefiltered using 0.2 µm pore size Millipore polycarbonate filter. The samples were then kept at 4°C until later analysis at the University of Innsbruck. Samples were incubated with fluorochrome DAPI (4′, 6-diamidino-2 phenylindole) at a final concentration of 0.2% v/v according to Porter and Feig (Citation1980), filtered on GE Polycarbonate filters (GE Water & Process Technologies, 0.22 µm pore size, 25 mm diameter, black), rinsed with ultrapure water and counted at Zeiss Axiophot2 epifluorescence microscope with a magnification of 1000×. The filtering apparatus (Millipore 1225 Sampling Manifold) was washed out with ultrapure water prior to each filtering, and negative samples with ultrapure water were included into each series. The head of the ultrapure water supply (Millipore) was equipped with Millipak® Express (0.22 µm pore size) filter.
In all cases, at least 300 cells per preparation were counted; if the abundance was lower than 1000 cells mL-1, a minimum of 80 grids (15,376 µm2 per grid) were examined. The extremely low cell abundances, sometimes below the normal detection limit expected for this method (CitationDieser, 2002), meant that the whole volume of one sample aliquot (50 mL) was filtered. The abundance of dust mineral particles (MPs) was also recorded on a categorical basis compared to the amount of cells (). The cell counts for the negative controls were below 30 cells mL-1, which approximately represents the magnitude of contamination from the laboratory environment (CitationDieser, 2002).
For chemical examination, melted snow and water samples were filtered in Ny-Ålesund through 0.45 µm membranes (according to CitationHodson, 2006), bottled in 50 mL centrifuge tubes (previously rinsed three times with ultrapure water) and kept frozen until analysis. The filter units and membranes were rinsed three times with ultrapure water between each sample. The samples were shipped to the University of Sheffield and analyzed using two separate Dionex DX 90 chromatographs, with 4400 integrators and AS40 autosamplers. Midrange standards (0 to 2000 µg L-1) showed an anion analytical precision error of 1.6%, 5%,7%, 2.8%, and 1.4% (for NO3 -, SO4 2-, F-, and Cl-, respectively) and 2.5%, 0.06%, 0.2%, 0.08%, and 1.5% for the cations (NH4 +, Na+, K+, Ca2+, and Mg2+, respectively). Repeated analysis from one single filtered snow aliquot gave a precision error of less than 5% for all constituents. A 1 µg L-1 detection limit was imposed for all chromatograms (Chromeleon software), and all analytic blanks were below this level.
FIGURE 2. Schematic sketch of the snow pit at Midtre Lovénbreen where six lysimeters were installed on 19 June 2010. The lysimeters were installed approximately 10 cm above the basal ice layer to prevent any water, flowing on top of the glacier ice, from entering the lysimeters.
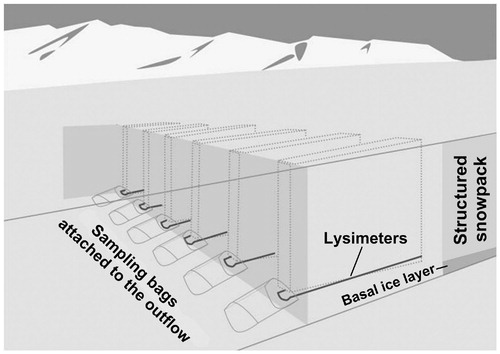
TABLE 1 Conductivity (σcond.), melt index, cell abundance, and the abundance of mineral dust particles (MPs) of the snow layers sampled at the start of the elution measurements. The melt index was calculated as log [Na+/Mg2+] for concentrations in µeg L-1. The abundance of MPs is presented on a categorical scale: 1 = number of MPs apparently lower than number of cells, 2 = abundance of MPs close to the abundance of microbial cells, 3 = abundance of MPs apparently exceeding the number of microbial cells, and 4 = abundance of MPs exceeding the number of microbial cells many times.
Conductivity and pH was measured in Ny-Ålesund using WTW LF 340 with Tetracon 96 sensor for conductivity and WTW pH 320 in combination with Hamilton Flushtrode sensor for pH.
To fully construct an elution sequence of ions, a quantitative lysimeter approach was employed. However, during June 2010 the snowmelt was very rapid and the 2 L Whirl-Pak bags soon filled to the top, making it difficult to capture all outflow from the snowpack. Furthermore, two thick ice layers were found in the snow, which reduced the vertical percolation such that meltwater was on occasion observed flowing along these layers, rather than through them. This indicated that the actual “capture” area of the lysimeters might be different from the surface area of the lysimeter itself.
To evaluate the transfer of ions and cells by surface melt, an energy balance model (CitationBrock and Arnold, 2000) was used to evaluate hourly snow melt and the corresponding decrease of the snowpack water equivalence (z SWE). This model has previously been used in a snowmelt study at this site and is described by Hodson et al. (Citation2005). It uses radiation, humidity, and temperature data from Ny-Ålesund that was provided by the Alfred Wegener Institute (AWI) through S. Debatin. The temperatures for the sampling site were estimated assuming dry adiabatic conditions and 200 m elevation difference. After tuning the model to z SWE change observed during the lysimeter study, hourly melt values were used to produce a cumulative discharge curve for the observation period. The instantaneous flux of major ions and cells was then calculated from the product of the hourly melt and the observed concentrations. These were then used to produce cumulative fluxes after linear interpolation to fill the concentration series. In so doing, and by comparing the form of the various cumulative flux curves, an elution order of the ions and cells was established.
Results
SNOWPACK STRATIGRAPHY
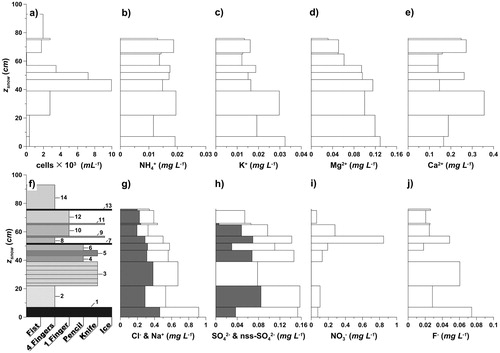
At the start of the survey the snowpack showed distinct stratigraphic characteristics, including several ice layers. These visible layers also showed variability in the concentrations of major ions, bacterial cell abundance, and the abundance of dust mineral particles, MPs ( and ). The major ion sample for layer 14 was lost, while layers 5, 7, and 9 were sampled in conjunction with the layer immediately beneath () due to their thin size and fragile nature. The snowpack stratigraphy () then showed a distinct NO3 - peak of 0.85 mg mL-1 in the combined sample of layers 8 and 9, while cell abundance peaked farther down in the snowpack with a maximum of 1 × 10⁴ cells mL-1 in layers 4 and 5. The lowest cell abundance, down to 30 cells mL-1, was found in layers 10 and 11, hence just at the detection limit estimated for the method (see the section on analysis and CitationDieser, 2002).
The water equivalent-weighted mean conductivity (σ cond. ) was 3.88 ± 1.45 µS cm-1 (in this study, standard deviation is used for range estimates), with a maximum at the bottom layer (recognized as superimposed ice) and the minimum found in the upper snow layers (). The pH of the snowpack varied from layer to layer, with an average of 5.46 ± 0.51 (weighted by snow water equivalent and calculated from H+ concentrations). Also the melt index (log [Na+/Mg2+]; see ), calculated according to Virkkunen et al. (Citation2007), showed distinct variability among the layers. The concentrations of Na+ and Cl- were closely linked () and Cl- accounted for roughly double the mass concentration of Na+ () as expected with marine aerosol. The K+/Na+ and Mg2+/Na+ ratios for the snowpack were up to three times greater than average ocean water (estimated from CitationMillero et al., 2008), and Ca2 +/Na+ ratios exceeded the ocean water ratio by several magnitudes (data not shown). Occasionally, concentrations of NO3 - and F- were below detection limits. The non-sea salt sulfate (nss-SO4 2-), calculated according to Kärkäs et al. (Citation2005) using an ocean SO4 2-/Na+ ratio of 0.252 (CitationMillero et al., 2008), gave some results close to zero or slightly negative (negative values are not presented in ). Overall, there was a generally good correlation between K+, Mg2+, and sea salt (Na+ and Cl-), whereas the correlation between NO3 -, SO4 2-, nss-SO4 2-, and sea salt was low (). A strong negative correlation between SO4 2-, nss-SO4 2-, Mg2+, and the melt index was found and the same is true for pH (). Conversely, SO4 2-, nss-SO4 2-, Mg2+ (and also Cl-) were well correlated with σcond., while Ca2+, the melt index, and pH were negatively correlated with σcond. (). The abundance of cells showed no correlation with any chemical parameters, but occurred consistently with elevated abundance of MPs ( and ).
FIGURE 3. (a) Snowpack thickness (z snow) and cell abundance, (b) ammonium, (c) potassium, (d) magnesium, and (e) calcium at the start of the elution measurements. (f) Snowpack stratigraphy analyzed by the hand test method (ICSI-IAHS, 1981) and numbered individual snow layers; concentrations of (g) chloride and sodium (gray), (h) sulfate and non-sea salt sulfate (gray), (i) nitrate, and (j) fluoride.
SNOWPACK MELTWATER
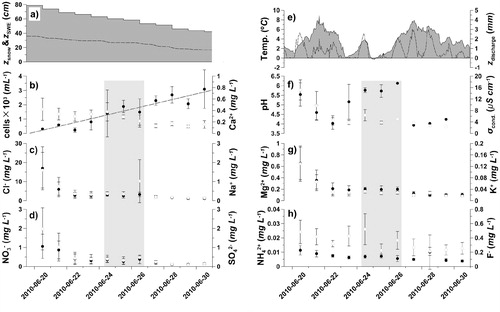
During the elution survey the snowpack height (z snow) above the six lysimeters decreased from 78.8 ± 3.8 to 42.1 ± 1.3 cm (, part a) which is equal to a snow water equivalence (z SWE) loss of 56% over the period (). The modeled change in z SWE and corresponding meltwater discharge (z discharge) are shown in , parts a and e, respectively. The estimated air temperature at the site was continuously above zero, except for the night between 24 and 25 June (, part e).
The cell abundance in the meltwater increased consistently throughout the observation period (257 cells mL-1 day-1, multiple R 2 = 0.59, shown as the regression line in , part b). The average meltwater concentration ranged from 232 to 3092 cells mL-1 (), and a significant number of cells were found to be attached to mineral particles (data not shown). The meltwater concentrations of Cl-, Na+, SO4 2-, Mg2+, K+, and to some extent NO3 - decreased rapidly during the first three sampling days, followed by more stable and low values (). Conversely, Ca2+, NH4 +, and F- showed a more steady decrease with some fluctuations for Ca2+ and F- (). The conductivity also showed a rapid decrease at the beginning followed by an increase from June 24 to 26 that was synchronous with increases in MPs (up to category 3 and 4, ). This coincided with a synchronous increase in pH and bacterial cell abundance, although the day of the outburst-like events responsible for these changes differed between the six lysimeters (data not shown). Finally, the MP concentration was generally lower in the meltwater samples than in the snow profile.
TABLE 2 Correlation matrix for the major ion concentrations, pH, conductivity (σcond.), melt index, and cell abundance of the 14 sampled snow layers in and . Bold numbers indicate strong correlations.
ELUTION FROM THE SNOW
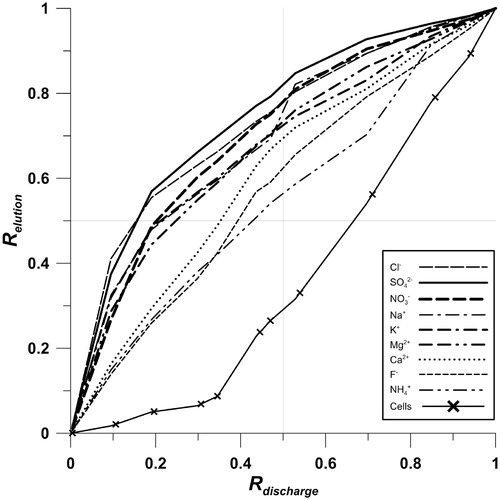
shows the relationship between the cumulative fluxes of the solutes and cells, with the cumulative water flux estimated using the melt model. If no additional sources of the various solutes are assumed, then differences between the curves reveal different elution rates. therefore suggests that Cl-, SO4 2-, NO3 -, Na+, K+, and Mg2+ are preferentially eluted in the initial stage of the survey. By contrast, Ca2+, F-, and NH4 + appear to have an intermediate mobility, while the cells were retained until later on, in accordance with the increasing cell number with time that was described above. Therefore, the snow had lost 50% of the fast-eluting ions during a 20–25% depletion of the z SWE. The ions with intermediate mobility required 30–45% of z SWE depletion, while the cells required 70% of z SWE depletion to reach the 50% elution mark. In summary, ions were removed at a faster rate than liquid water from the snowpack, while bacterial cells were removed at a slower rate, indicating retention of the cells within the snow.
Discussion
SNOWPACK MELTWATER
During the observation period of eleven days, 56% of the z SWE was lost from the snowpack () as a result of melting. The discharge model indicated a strong diurnal pattern for the melt release, whereas the temperature fluctuations were typically smoother (), indicating that net radiative forcing of the melt was more important than sensible heat.
Cell Elution
The cell abundance in the meltwater indicated a steady increase (257 cells mL-1 d-1, ) throughout the survey, while the initial meltwater showed a low abundance (around 19%, 310 ± 57 cells mL-1) compared to the average snow profile concentrations at the start (, ). This increasing trend clearly deviated from the response normally displayed by dissolved constituents (e.g. CitationBrimblecombe et al., 1986). Therefore, the most obvious feature in the elution curve () is the major difference between cell abundance and solute concentration, such that as much as 70% of z SWE loss was needed to elute 50% of the accumulated cells. Similar patterns to these cell transfer dynamics have been described for hydrophobic substances and particles during snow melt, which aggregate and become trapped within the snow or at the snow surface and are thus released only at the very end of the melting period (CitationKuhn, 2001; CitationMeyer et al., 2006; CitationMeyer and Wania, 2008; CitationMeyer et al., 2009a, Citation2009b). Soluble species, on the other hand, will tend to have an elution sequence that is governed by the age of the snow and snow melt characteristics depending on the melt-freeze frequencies (CitationMeyer et al., 2009a). The microscope observation during cell counting revealed that a significant number of cells were attached to mineral particles (MP), while the aggregation between cells was rare. As will be discussed in the section on cell stratigraphy, such co-occurrence of cells and MPs was present already in the snow profile sampled at the start of the survey. Furthermore, a local increase in cell abundance was observed in the meltwater during 24–26 June and in connection with a high abundance of MPs in the runoff (shown as shaded areas in ). This local increase could be the result of the breakthrough and/or washout of the high cell abundance layers seen in the snow profile. The link between cells and particles in the meltwater observed here, together with late elution of the cells, therefore points toward a strong retention of cells within the snowpack and indicates a hydrophobic-like elution response for them.
FIGURE 4. The elution progress and snowpack development of; (a) snow thickness (z snow) and modeled snow water equivalence (z SWE, dotted line); (b) cell counts (with linear regression line) and Ca2+; (c) Cl-and Na+; (d) NO3 -and SO4 2-; (e) estimated air temperature assuming a dry adiabatic lapse rate and 200 m elevation difference from Ny-Ålesund (data provided by AWI; S. Debatin), and modeled meltwater discharge (dotted line); (f) pH and conductivity (σcond.); (g) Mg2+ and K+; and (h) NH4 +with F-. Cell abundance, Cl-, NO3 -, pH, Mg2 +, and NH4 + are given as closed circles, while Ca2+, Na+, SO4 2-, σcond., K+, and F-are given as open circles. Error bars indicate standard deviations. The shaded area between 24 and 26 June indicates samples where the abundance of mineral dust particles (MPs) exceeded the cell counts according to categories 3 and 4 in . Symbols without error estimates indicate single measurements. Dates are given as yyyy-mm-dd.
Downstream Fate of Snow-Derived Cells
Irvine-Fynn et al. (Citation2012) investigated supra-glacial cell fluxes from Midtre Lovénbreen later on in the summer season of 2010, when the glacial snow cover had melted. They found that the supra-glacial ecosystem has an ability to retain microbial cells in surface ice. Our elution data suggest that retention already starts within the snowpack at the onset of snow melt. Snowpack cell retention then introduces an annual supply of viable cells to the surface-glacial microbial community, while some of the easily accessible nutrients (as NO3 -, see section on ion elution) are more readily transferred downstream.
While the z SWE decreased by 56% over the sampling period, the overall cell concentration increased by 165% (). This means that the amount of microbial cells increased from 6.2 × 10⁸ cells m-2 to 7.3 × 10⁸ cells m-2 () during the observed z SWE depletion. However, cells were also lost with the meltwater during the study, accumulating up to 3.4 × 10⁸ ± 0.9 × 10⁸ cells m-2. Using a simple mass balance equation, N increase = N end + N lost − N start, a total cell increase of 4.0 × 10⁷ cells m-2 d-1 could be determined for this period, a matter that deserves a deeper discussion. Such increase can be due to both aeolian cell deposition and cell proliferation, where both processes have been invoked, contributing to the accumulation of microbial biomass upon glacial surfaces (CitationSegawa et al., 2005; CitationIrvine-Fynn et al., 2012). Since the primary objective of the investigation was to better understand the relocation of microbial cells, the sampling design doesn't allow for a simple assessment of these two potential fluxes. There is, however, indirect evidence that the contribution from aeolian inputs was least important: First, the average wind speed in Ny-Ålesund was 2.7 ± 1.6 m s-1 (with a maximum of 7.3 m s-1) during the study period, indicating negligible wind transport for the very sheltered area of Midtre Lovénbreen. Hence, a close link between cells and MPs was found both in meltwater (see section on cell elution) and in the snow profile (see section on cell stratigraphy), indicating a local terrestrial origin and suggesting that wind dispersal strongly influences the aeolian deposition at this site. Second, the surface snow layer (layer 14 in , part a) sampled at the beginning of the study holds a cell abundance (2.0 × 10³ cells mL-1) very close to that found in fresh precipitation (CitationSattler et al., 2001). If aeolian deposition was important, this number would probably have been enhanced, especially since the last major precipitation event was 19 days prior to the sampling occasion (www.eklima.no), giving a long time window for aeolian processes to influence.
Even though the data provided here are insufficient to truly separate cell growth and aeolian deposition, a maximum proliferation scenario (assuming no aeolian deposition), indicates a microbial generation time (G) of 14.4 days using
where B is the initial number of cells, b is the sum of cells eluted and remaining at the end, and t is time. This generation time is in line with that estimated for supercooled cloud droplets and melted snow (10.9 and 56.1 days, respectively) reported by Sattler et al. (Citation2001). Therefore cell proliferation can clearly contribute to the apparent retention of microbial cells in this High Arctic site. It should be noted that although elution will minimize the concentration of productivity-limiting nutrients during the latter stages of snowpack ablation, the early fractions of meltwater moving through the porous snow will be quite enriched and thus capable of stimulating growth. Further, a superimposed ice layer beneath the lysimeters was observed. Freeze-rejection of nutrients will therefore also occur here and further increase the concentration of nutrients in the persistent water phase during the formation of this layer. More studies should therefore establish the timing of nutrient mobilization in these snowpacks and relate them to microbial cell proliferation.
TABLE 3 Concentrations and total loads of the snowpack at the start of the elution study (based on the z SWE weighted layering of the snow profile, , n = 1), and at the end (n = 6) of the survey in 2010.
Ion Elution
The NO3 -, SO4 2-, Na+, Cl-, Mg2+, and K+ concentration in meltwater during the first days of the experiment were an order of magnitude higher than the initial bulk snowpack sample. On the other hand, F- only slightly exceeded the concentration in the bulk sample, and Ca2+ and NH4 + showed similar concentrations in both the snowpack and meltwater. The preferential elution sequence adapted from the modeled meltwater discharge and its measured concentrations () was generally in line with previous estimates (CitationKuhn, 2001) and followed the sequence Cl-, SO4 2- > NO3 -, Na+, K+ > Mg2+ > Ca2+ > F-, NH4 + >> Cells for the first 50% of the total fluxes from the snow. This elution sequence differed from what has been reported previously for Svalbard snow, where NO3 - and SO4 2- were found to be preferentially eluted compared to Cl-, while K+ and Na+ were typically found to be eluted later (CitationGoto-Azuma et al., 1994). However, snow melt had already occurred during early May and removed ions prior to this study (see section on ion stratigraphy). With such washout, the elution sequence would change due to the altered concentration ratios in the remaining snow (CitationBrimblecombe et al., 1986). In this case, our data would simply reflect an elution sequence from a later stage in the melt process. However, we still observed a nonlinear removal of snowpack solute, in favor of the earlier observed fraction during snowmelt (CitationJohannessen et al., 1975; CitationBales et al., 1989). Certain solutes might also be influenced by nonconservative behavior throughout the experiment, including the dissolution of solutes from dust (or adsorption of solutes onto the dust surface). For example, the F- concentrations in the meltwater were constantly above those in the initial bulk sample and remained higher also in bulk samples at the end of the sampling period (), while NH4 + remained low most likely as a consequence of assimilation (CitationHodson, 2006). The acquisition of F- from supra-glacial debris weathering is known to occur at this site (CitationIrvine-Fynn, 2008). The same pattern of higher final concentrations can also be seen for NO3 -. It is known that atmospheric NO3 - within the Arctic can occur in association with aerosols (CitationHara et al., 1999; CitationTeinilä et al., 2003) and with bacteria (CitationHill et al., 2007). If particles and bacteria remain in the snowpack rather than following the meltwater, as our results suggest, an elevated concentration of associated chemicals (such as NO3 -) might be expected in the remaining snow. This is because both nitrification, which is typical among bacteria associated with debris (CitationHodson et al., 2005), and cell-lysis, which may be caused by osmotic stress in the very diluted meltwater (CitationHarding et al., 2011), might release solutes to the surrounding snow and meltwater. Furthermore, chemical dry deposition and sublimation of snow-water could also influence the snowpack concentrations and thereby the elution response. However, an earlier study of snow-water sublimation in Ny-Ålesund, which can be important during dry snow conditions, found that the snowpack rather gained water through condensation then lost water through sublimation during snowmelt (CitationTakeuchi et al., 1995). Dry deposition of NO3 - can also occur, but for this study site, such addition was discounted on the basis of a measurement and modeling study that found negligible fluxes in comparison to the total deposition (CitationBjörkman et al., 2013).
FIGURE 5. Preferential elution of major ions and cells given as a ratio of the total accumulated elution (R elution) in comparison to the ratio of total accumulated meltwater discharge (R discharge).
SNOWPACK STRATIGRAPHY
The snowpack at the start of the survey showed distinct visible layers and the concentration profiles indicated clear heterogeneous patterns for both cells and major ions (). For the major ions, such heterogeneity is well known in Svalbard snow and precipitation (CitationVirkkunen et al., 2007; CitationKrawczyk et al., 2008; CitationKühnel et al., 2011), where high loads of NO3 -, NH4 +, and nss-SO4 - have been interpreted as a result of rapid transport from lower latitudes (CitationSimoes and Zagorodnov, 2001; CitationHodson et al., 2005; CitationKühnel et al., 2011). With this being the case, we believe that microbial cells, like other contaminants, are likely to demonstrate a similar distinct heterogeneity within this region.
CELL STRATIGRAPHY
In comparison to bacterial abundance earlier reported in snow from the Ny-Ålesund region (CitationAmato et al., 2007), or the Austrian Alps (CitationSattler et al., 2001), the cell abundance in our snow layers was one to two orders of magnitude lower. The snowpack sampled in 2010 also showed a clear difference to the two sites Amato et al. (Citation2007) sampled in 2004, when the cell abundance was rather homogeneous throughout the snowpack compared to the distinct layering of our 2010 data (). One possible explanation for this can be the relative isolation of the sampling location upon Midtre Lovénbreen, which is more sheltered (CitationRasmussen and Kohler, 2007) than the two sites studied by Amato et al. (Citation2007). The snowpack at the interior of the Midtre Lovénbreen glacial valley in the present study is far less exposed to the winds that flow over the Kongsvegen glacier and along the coastal plain of Kongsfjord (CitationBeine et al., 2001; CitationRasmussen and Kohler, 2007), the sites used by Amato et al. (Citation2007). The cell abundance showed no correlation with any of the investigated major ions or snow properties (). If the locally exposed rock and soil act as the major source of bacterial cells, a close link between Ca2+ and cell abundance could be expected (CitationMiteva et al., 2009). Even though the abundance of cells and Ca2+ is uncorrelated, the maximum number of cells was found in layers with high MP levels, pointing toward an episodic crustal source of cells to the snowpack. Hence, the higher cell abundance found among snow layers 4–6 (, part a) would then likely be from local outcrops during wind distribution events. On the other hand, the relative isolation of our study site most likely explains why the cell numbers in other layers of the snowpack resemble the low numbers found in cloud water (CitationSattler et al., 2001). Taking the distinct oceanic influence upon snowpack chemistry into account (see next section on ion stratigraphy), our observations suggest that the typical origin of snowpack cells was from the marine-influenced air responsible for precipitation in this region (e.g., CitationHisdal, 1998). However, the layers with the maximum numbers of cells, strongly influencing the total cell burden, originate from local terrestrial sources, as supported by the cells' association with debris.
Ion Stratigraphy
For the major ions, the high correlation between Na+ and Cl- ( and ) confirms that the site is influenced by proximity to open ocean, whereas K+, Mg2+, and Ca2+ showed higher ratios to Na+ than would be expected from purely oceanic sources (data not shown) revealing a dissolution of local dust (CitationKang et al., 2001). Further, no significant correlations were found between NO3 -, nss-SO4 2- and sea salt, or between SO4 2- and sea salt, which clearly indicated that these substances originate from other sources. For the Arctic, large atmospheric transportation regimens have been pointed out as the major contributors of NO3 - and SO4 2- (CitationRahn et al., 1980; CitationFisher et al., 2011;Citation Kühnel et al., 2011; CitationKühnel, 2013). However, atmospheric SO4 2- concentrations can also be influenced by biogenic production of DMS (dimethyl sulfide) in the sea ice-free ocean regions of the Arctic (CitationSharma et al., 2012) and have been shown to influence the snow cover in the Ny-Ålesund region (CitationLarose et al., 2010b).
Even though the site location was chosen by minimal visible snow metamorphosis, the calculated melt index (CitationVirkkunen et al., 2007) and low NO3 - and SO4 2- concentrations in the upper snow layers (, ) demonstrated that an influence of snow melt, prior to the start of the survey, cannot be ruled out. During such melt, the top layers of the snowpack are likely the first ones to be eluted (CitationBales et al., 1989). However, the high NO3 - concentrations found around layers 9 and 8 corresponded well to other sites in the area sampled earlier during the winter of 2010 (Björkman et al., unpublished data), which suggests that the early snow melt rather percolated horizontally along the surface snow layers than vertically into the snowpack, and did not alter the concentration profile preserved in the deeper layers substantially.
Conclusion
The removal of microbial cells from a High Arctic snowpack resembles an elution sequence similar to that of hydrophobic compounds (e.g., CitationMeyer et al., 2009a), a process that helps glaciers retain a microbial biomass upon their surface, even after the demise of the snow cover (CitationIrvine-Fynn et al., 2012). The snowpack and the glacier surface therefore act as an accumulator of cell biomass during the melt season. This suggests that wet snowpacks, even on the surface of High Arctic glaciers, are likely to be dynamic ecosystems in their own right. The relocation of both nutrients and biomass during melting therefore requires consideration in the future. In our study, a clear ion elution sequence was observed that resembled earlier reports (CitationBrimblecombe et al., 1986) and caused high concentrations of ions in snowpack runoff at the start of the snow melt, which rapidly decreased as snow melt proceeded. Cl-, SO4 2- , NO3 -, Na+, and K+ experienced a 50% elution before 20–25% of the snowpack water content was lost. By contrast, cell removal only reached the 50% level after ∼70% snowpack depletion.
In contrast to our expectations, the calculated cell budget between the initial and final snowpack (including the cell loss by elution) revealed a significant increase of the total cell numbers, that is, more than twice the original number. Assuming aeolian deposition processes to be low, this suggests cell proliferation as a contribution to the observed “retention effect.”
Precipitation was the major cell contributor to the snowpack upon Midtre Lovénbreen. An overall low cell concentration was therefore found within the snowpack stratigraphy, where snow layers frequently showed cell abundances similar to those of cloud water (CitationSattler et al., 2001). This was in contrast to the nearby and more wind exposed sites examined by Amato et al. (Citation2007). However, layers of higher dust deposition were concomitant with one order of magnitude higher cell abundances, indicating that wind dispersal from locally exposed rocks supplements the atmospheric cell input.
Acknowledgments
This project was part of the Marie Curie Initial Training Network-funded project “Sources, sinks and impacts of atmospheric nitrogen deposition in the Arctic” (NSINK, Project No.: 215503), and field work was enabled by Arctic Field Grant. The project has also benefited from the logistic support from the staff at the Sverdrup Station, Norwegian Polar Institute. The authors would also gratefully like to thank the Italian Research Council (CNR) for their hospitality when using the laboratory facilities in Dirigibile Italia, and the Alfred Wegener Institute (AWI), which provided us with meteorological data through S. Debatin.
Related Research Data
References Cited
- Abbatt, J. P. D. , 1997: Interaction of HNO3 with water-ice surfaces at temperatures of the free troposphere. Geophysical Research Letters , 24: 1479–1482.
- Amato, P. , Hennebelle, R. , Magand, O. , Sancelme, M. , Delort, A. M. , Barbante, C. , Boutron, C. , and Ferrari, C. , 2007: Bacterial characterization of the snow cover at Spitzberg, Svalbard. FEMS Microbiology Ecology, 59: 255–264.
- Amato, P. , Doyle, S. , and Christner, B. C. , 2009: Macromolecular synthesis by yeasts under frozen conditions. Environmental Microbiology , 11: 589–596.
- Bakermans, C. , and Skidmore, M. , 2011: Microbial respiration in ice at subzero temperatures (-4° C to -33° C). Environmental Microbiology Reports , 3: 774–782.
- Bales, R. C. , Davis, R. E. , and Stanley, D. A. , 1989: Ion elution through shallow homogeneous snow. Water Resources Research , 25: 1869–1877.
- Barrie, L. A. , 1991: Snow formation and the processes in the atmosphere that influence its chemical composition. In Davies, T. D. , Tranter, M. , and Jones, H. G. (eds.), Seasonal Snowpacks. NATO ASI Series. Berlin, Springer-Verlag, 1–20.
- Bauer, H. , Kasper-Giebl, A. , Loflund, M. , Giebl, H. , Hitzenberger, R. , Zibuschka, F. , and Puxbaum, H. , 2002: The contribution of bacteria and fungal spores to the organic carbon content of cloud water, precipitation and aerosols. Atmospheric Research , 64: 109–119.
- Beine, H. J. , Argentini, S. , Maurizi, A. , Mastrantonio, G. , and Viola, A. , 2001: The local wind field at Ny-Alesund and the Zeppelin mountain at Svalbard. Meteorology and Atmospheric Physics , 78: 107–113.
- Björkman, M. P. , Morgner, E. , Björk, R. G. , Cooper, E. J. , Elberling, B. , and Klemedtsson, L. , 2010: A comparison of annual and seasonal carbon dioxide effluxes between sub-Arctic Sweden and High-Arctic Svalbard. Polar Research , 29: 75–84.
- Björkman, M. P. , Kühnel, R. , Partridge, D. G. , Roberts, T. J. , Aas, W. , Mazzola, M. , Viola, A. , Hodson, A. , Ström, J. , and Isaksson, E. , 2013: Nitrate dry deposition in Svalbard. Tellus B , 65: 19071, http://dx.doi.org/10.3402/tellusb.v65i0.19071.
- Brimblecombe, P. , Tranter, M. , Tsiouris, S. , Davis, T. D. , and Vincent, C. E. , 1986: The chemical evolution of snow and meltwater. In Modelling Snowmelt-Induced Processes (Proceedings of the Budapest Symposium, July 1986). IAHS Publ. no. 155: 283–295.
- Brock, B. W. , and Arnold, N. S. , 2000: A spreadsheet-based (Microsoft Excel) point surface energy balance model for glacier and snow melt studies. Earth Surface Processes and Landforms , 25: 649–658.
- Chang, T. Y. , 1984: Rain and snow scavenging of HNO3 vapor in the atmosphere. Atmospheric Environment , 18: 191–197.
- Christner, B. C. , 2002: Incorporation of DNA and protein precursors into macromolecules by bacteria at -15°C. Applied and Environmental Microbiology , 68: 6435–6438.
- Christner, B. C. , Cai, R. , Morris, C. E. , McCarter, K. S. , Foreman, C. M. , Skidmore, M. L. , Montross, S. N. , and Sands, D. C. , 2008: Geographic, seasonal, and precipitation chemistry influence on the abundance and activity of biological ice nucleators in rain and snow. Proceedings of the National Academy of Sciences of the United States of America , 105: 18854–18859.
- Colbeck, S. C. , 1981: A simulation of the enrichment of atmospheric pollutants in snow cover runoff. Water Resources Research , 17: 1383–1388.
- Cragin, J. H. , Hewitt, A. D. , and Colbeck, S. C. , 1996: Grain-scale mechanisms influencing the elution of ions from snow. Atmospheric Environment , 30: 119–127.
- Delort, A. M. , Vaitilingom, M. , Amato, P. , Sancelme, M. , Parazols, M. , Mailhot, G. , Laj, P. , and Deguillaume, L. , 2010: A short overview of the microbial population in clouds: potential roles in atmospheric chemistry and nucleation processes. Atmospheric Research , 98: 249–260.
- Diehl, K. , and Wurzler, S. , 2010: Air parcel model simulations of a convective cloud: bacteria acting as immersion ice nuclei. Atmospheric Environment , 44: 4622–4628.
- Dieser, M. , 2002: Grenzwertbestimmung bei Standardmethoden der aquatischen Mikrobiologie zur Ermittlung bakterieller Abundanz und Sekundärproduktion. Thesis, Institute of Ecology, University of Innsbruck, Innsbruck, 89 pp.
- Edwards, A. C. , Scalenghe, R. , and Freppaz, M. , 2007: Changes in the seasonal snow cover of alpine regions and its effect on soil processes: a review. Quaternary International , 162: 172–181.
- Fisher, J. A. , Jacob, D. J. , Wang, Q. Q. , Bahreini, R. , Carouge, C. C. , Cubison, M. J. , Dibb, J. E. , Diehl, T. , Jimenez, J. L. , Leibensperger, E. M. , Lu, Z. F. , Meinders, M. B. J. , Pye, H. O. T. , Quinn, P. K. , Sharma, S. , Streets, D. G. , van Donkelaar, A. , and Yantosca, R. M. , 2011: Sources, distribution, and acidity of sulfate-ammonium aerosol in the Arctic in winter-spring. Atmospheric Environment , 45: 7301–7318.
- Gagne, F. , Poissant, L. , and Blaise, C. , 2009: Ecotoxicity of snowpack collected from selected sites in Quebec, Canada. Water Air and Soil Pollution , 201: 121–133.
- Goto-Azuma, K. , Nakawo, M. , Jiankang, H. , Watanabe, O. , and Azuma, N. , 1994: Melt-induced relocation of ions in glaciers and in a seasonal snowpack. Snow and Ice Covers: Interactions with the Atmosphere and Ecosystems , 223: 287–297.
- Grinsted, A. , Moore, J. C. , Pohjola, V. , Martma, T. , and Isaksson, E. , 2006: Svalbard summer melting, continentality, and sea ice extent from the Lomonosovfonna ice core. Journal of Geophysical Research-Atmospheres , 111: D07110, doi: http://dx.doi.org/10.1029/2005JD006494.
- Hara, K. , Osada, K. , Hayashi, M. , Matsunaga, K. , Shibata, T. , Iwasaka, Y. , and Furuya, K. , 1999: Fractionation of inorganic nitrates in winter Arctic troposphere: coarse aerosol particles containing inorganic nitrates. Journal of Geophysical Research-Atmospheres , 104: 23671–23679.
- Harding, T. , Jungblut, A. D. , Lovejoy, C. , and Vincent, W. F. , 2011: Microbes in High Arctic snow and implications for the cold biosphere. Applied and Environmental Microbiology , 77: 3234–3243.
- Hill, K. A. , Shepson, P. B. , Galbavy, E. S. , Anastasio, C. , Kourtev, P. S. , Konopka, A. , and Stirm, B. H. , 2007: Processing of atmospheric nitrogen by clouds above a forest environment. Journal of Geophysical Research-Atmospheres , 112: 16 pp., doi: http://dx.doi.org/10.1029/2006JD008002.
- Hirdman, D. , Sodemann, H. , Eckhardt, S. , Burkhart, J. F. , Jefferson, A. , Mefford, T. , Quinn, P. K. , Sharma, S. , Strom, J. , and Stohl, A. , 2010: Source identification of short-lived air pollutants in the Arctic using statistical analysis of measurement data and particle dispersion model output. Atmospheric Chemistry and Physics , 10: 669–693.
- Hisdal, V. , 1998: Svalbard Nature and History. Oslo: Norwegian Polar Institute.
- Hodgkins, R. , and Tranter, M. , 1998: Solute in High Arctic glacier snow cover and its impact on runoff chemistry. Annals of Glaciology , 26: 156–160.
- Hodson, A. , 2006: Biogeochemistry of snowmelt in an Antarctic glacial ecosystem. Water Resources Research , 42: W11406, doi: http://dx.doi.org/10.1029/2005WR004311.
- Hodson, A. J. , Mumford, P. N. , Kohler, J. , and Wynn, P. M. , 2005: The High Arctic glacial ecosystem: new insights from nutrient budgets. Biogeochemistry , 72: 233–256.
- Hoog, I. , Mitra, S. K. , Diehl, K. , and Borrmann, S. , 2007: Laboratory studies about the interaction of ammonia with ice crystals at temperatures between 0 and -20°C. Journal of Atmospheric Chemistry , 57: 73–84.
- Hoose, C. , Kristjansson, J. E. , and Burrows, S. M. , 2010: How important is biological ice nucleation in clouds on a global scale? Environmental Research Letters , 5: 024009, doi: http://dx.doi.org/10.1088/1748-9326/5/2/024009.
- Hou, S. G. , and Qin, D. H. , 2002: The effect of postdepositional process on the chemical profiles of snow pits in the percolation zone. Cold Regions Science and Technology , 34: 111–116.
- ICSI-IAHS, 1981: Avalanche Atlas: Illustrated International Avalanche Classification. Paris: UNESCO.
- Irvine-Fynn, T. D. L. , 2008: Modelling runoff from the maritime Arctic cryosphere: water storage and routing at Midtre Lovénbreen. Thesis, Department of Geography, University of Sheffield, Sheffield, U.K., 359 pp.
- Irvine-Fynn, T. D. L. , Edwards, A. , Newton, S. , Langford, H. , Rassner, S. M. , Telling, J. , Anesio, A. M. , and Hodson, A. J. , 2012: Microbial cell budgets of an Arctic glacier surface quantified using flow cytometry. Environmental Microbiology , 14: 2998–3012.
- Jayaweera, K. , and Flanagan, P. , 1982: Investigations on biogenic ice nuclei in the Arctic atmosphere. Geophysical Research Letters , 9: 94–97.
- Johannessen, M. , Dale, T. , Gjessing, E. T. , A., H. , and Wright, R. F. , 1975: Acid precipitation in Norway: the regional distribution of contaminants in snow and the chemical concentration processes during snowmelt. In Isotopes and Impurities in Snow and Ice; XVI Assembly of the International Union of Geodesy and Geophysics, 118: 116–120.
- Jones, H. G. , 1991: Snow chemistry and biological activity: a particular perspective of nutrient cycling. In Davies, T. D. , Tranter, M. , and Jones, H. G. (eds.), Seasonal Snowpacks: Processes for Compositional Change. NATO Series G. Berlin: Springer-Verlag, 21–66.
- Jones, H. G. , 1999: The ecology of snow-covered systems: a brief overview of nutrient cycling and life in the cold. Hydrological Processes , 13: 2135–2147.
- Junge, K. , and Swanson, B. D. , 2008: High-resolution ice nucleation spectra of sea-ice bacteria: implications for cloud formation and life in frozen environments. Biogeosciences , 5: 865–873.
- Kang, S. , Qin, D. , Mayewski, P. A. , and Gjessing, Y. , 2001: Snow chemistry in Svalbard, Arctic. Bulletin of Glaciological Research , 18: 9–13.
- Kärkäs, E. , Teinila, K. , Virkkula, A. , and Aurela, M. , 2005: Spatial variations of surface snow chemistry during two austral summers in western Dronning Maud Land, Antarctica. Atmospheric Environment , 39: 1405–1416.
- Krawczyk, W. E. , Bartoszewski, S. A. , and Siwek, K. , 2008: Rain water chemistry at Calypsobyen, Svalbard. Polish Polar Research , 29: 149–162.
- Kuhn, M. , 2001: The nutrient cycle through snow and ice, a review. Aquatic Sciences , 63: 150–167.
- Kühnel, R. , 2013: Reactive nitrogen: transport to and deposition at the High Arctic site Ny-Ålesund, Svalbard. Oslo: Faculty of Mathematics and Natural Sciences, University of Oslo, No . 1300, 60 pp.
- Kühnel, R. , Roberts, T. J. , Björkman, M. P. , Isaksson, E. , Aas, W. , Holmén, K. , and Ström, J. , 2011: 20-Year climatology of NO3 - and NH4+ wet deposition at Ny-Ålesund, Svalbard. Advances in Meteorology , 2011: 1–10.
- Larose, C. , Berger, S. , Ferrari, C. , Navarro, E. , Dommergue, A. , Schneider, D. , and Vogel, T. M. , 2010a: Microbial sequences retrieved from environmental samples from seasonal Arctic snow and meltwater from Svalbard, Norway. Extremophiles , 14: 205–212.
- Larose, C. , Dommergue, A. , De Angelis, M. , Cossa, D. , Averty, B. , Marusczak, N. , Soumis, N. , Schneider, D. , and Ferrari, C. , 2010b: Springtime changes in snow chemistry lead to new insights into mercury methylation in the Arctic. Geochimica et Cosmochimica Acta , 74: 6263–6275.
- Larose, C. , Dommergue, A. , Marusczak, N. , Coves, J. , Ferrari, C. P. , and Schneider, D. , 2011: Bioavailable mercury cycling in polar snowpacks. Environmental Science & Technology , 45: 2150–2156.
- Lei, Y. D. , and Wania, F. , 2004: Is rain or snow a more efficient scavenger of organic chemicals? Atmospheric Environment , 38: 3557–3571.
- Lilbaek, G. , and Pomeroy, J. W. , 2008: Ion enrichment of snowmelt runoff water caused by basal ice formation. Hydrological Processes , 22: 2758–2766.
- Meyer, T. , and Wania, F. , 2008: Organic contaminant amplification during snowmelt. Water Research , 42: 1847–1865.
- Meyer, T. , Lei, Y. D. , and Wania, F. , 2006: Measuring the release of organic contaminants from melting snow under controlled conditions. Environmental Science & Technology , 40: 3320–3326.
- Meyer, T. , Lei, Y. D. , Muradi, I. , and Wania, F. , 2009a: Organic contaminant release from melting snow. 1. Influence of chemical partitioning. Environmental Science & Technology , 43: 657–662.
- Meyer, T. , Lei, Y. D. , Muradi, I. , and Wania, F. , 2009b: Organic contaminant release from melting snow. 2. Influence of snow pack and melt characteristics. Environmental Science & Technology , 43: 663–668.
- Millero, F. J. , Feistel, R. , Wright, D. G. , and McDougall, T. J. , 2008: The composition of Standard Seawater and the definition of the Reference-Composition Salinity Scale. Deep-Sea Research Part I-Oceanographic Research Papers , 55: 50–72.
- Mindl, B. , Anesio, A. M. , Meirer, K. , Hodson, A. J. , Laybourn-Parry, J. , Sommaruga, R. , and Sattler, B. , 2007: Factors influencing bacterial dynamics along a transect from supraglacial runoff to proglacial lakes of a High Arctic glacier. FEMS Microbiology Ecology , 59: 307–317.
- Miteva, V. , Teacher, C. , Sowers, T. , and Brenchley, J. , 2009: Comparison of the microbial diversity at different depths of the GISP2 Greenland ice core in relationship to deposition climates. Environmental Microbiology , 11: 640–656.
- Morris, C. E. , Kinkel, L. L. , Xiao, K. , Prior, P. , and Sands, D. C. , 2007: Surprising niche for the plant pathogen Pseudomonas syringae. Infection Genetics and Evolution , 7: 84–92.
- Porter, K. G. and Feig, Y. S. , 1980: The use of DAPI for identifying and counting aquatic microflora. Limnology and Oceanography , 25: 943–948.
- Price, P. B. , and Sowers, T. , 2004: Temperature dependence of metabolic rates for microbial growth, maintenance, and survival. Proceedings of the National Academy of Sciences of the United States of America , 101: 4631–4636.
- Rahn, K. A. , Joranger, E. , Semb, A. , and Conway, T. J. , 1980: High winter concentrations of SO2 in the Norwegian Arctic and transport from Eurasia. Nature , 287: 824–826.
- Rasmussen, L. A. , and Kohler, J. , 2007: Mass balance of three Svalbard glaciers reconstructed back to 1948. Polar Research , 26: 168–174.
- Robinson, D. A. , and Frei, A. , 2000: Seasonal variability of northern hemisphere snow extent using visible satellite data. Professional Geographer , 52: 307–315.
- Robinson, D. A. , Dewey, K. F. , and Heim, R. R. , 1993: Global snow cover monitoring-An update. Bulletin of the American Meteorological Society , 74: 1689–1696.
- Sattler, B. , Puxbaum, H. , and Psenner, R. , 2001: Bacterial growth in supercooled cloud droplets. Geophysical Research Letters , 28: 239–242.
- Sattler, B. , Wille, A. , Waldhuber, S. , Sipiera, P. , and Psenner, R. , 2002: Various ice ecosystems in alpine and polar regions-An overview. In Lacoste, H. (ed.), Proceedings of the Second European Workshop on Exo-Astrobiology , 223–226.
- Schmidt, I. K. , Jonasson, S. , and Michelsen, A. , 1999: Mineralization and microbial immobilization of N and P in Arctic soils in relation to season, temperature and nutrient amendment. Applied Soil Ecology , 11: 147–160.
- Segawa, T. , Miyamoto, K. , Ushida, K. , Agata, K. , Okada, N. , and Kohshima, S. , 2005: Seasonal change in bacterial flora and biomass in mountain snow from the Tateyama Mountains, Japan, analyzed by 16S rRNA gene sequencing and real-time PCR. Applied and Environmental Microbiology , 71: 123–130.
- Sharma, S. , Chan, E. , Ishizawa, M. , Toom-Sauntry, D. , Gong, S. L. , Li, S. M. , Tarasick, D. W. , Leaitch, W. R. , Norman, A. , Quinn, P. K. , Bates, T. S. , Levasseur, M. , Barrie, L. A. , and Maenhaut, W. , 2012: Influence of transport and ocean ice extent on biogenic aerosol sulfur in the Arctic atmosphere. Journal of Geophysical Research-Atmospheres , 117: doi: http://dx.doi.org/10.1029/2011JD017074.
- Simoes, J. C. , and Zagorodnov, V. S. , 2001: The record of anthropogenic pollution in snow and ice in Svalbard, Norway. Atmospheric Environment , 35: 403–413.
- Stibal, M. , Telling, J. , Cook, J. , Mak, K. M. , Hodson, A. , and Anesio, A. M. , 2012: Environmental controls on microbial abundance and activity on the Greenland Ice Sheet: a multivariate analysis approach. Microbial Ecology , 63: 74–84.
- Stohl, A. , 2006: Characteristics of atmospheric transport into the Arctic troposphere. Journal of Geophysical Research-Atmospheres , 111: 17, doi: http://dx.doi.org/10.1029/2005JD006888.
- Takeuchi, Y. , Kodama, Y. , and Nakabayashi, H. , 1995: Characteristics of evaporation from snow and tundra surface in Spitsbergen in the snowmelt season 1993. Proceedings of the NIPR Symposium on Polar Meteorology and Glaciology , 9: 54–65.
- Teinilä, K. , Hillamo, R. , Kerminen, V. M. , and Beine, H. J. , 2003: Aerosol chemistry during the NICE dark and light campaigns. Atmospheric Environment , 37: 563–575.
- Twickler, M. , and Whitlow, S. , 1997: Appendix B. In Mayewski, P. A. , and Goodwin, I. D. (eds.), Guide for the collection and analysis of ITASE snow and firn samples. Bern: International Trans-Antarctic Scientific Expedition (ITASE), Past Global Changes, report 97-1.
- Vaitilingom, M. , Amato, P. , Sancelme, M. , Laj, P. , Leriche, M. , and Delort, A. M. , 2010: Contribution of microbial activity to carbon chemistry in clouds. Applied and Environmental Microbiology , 76: 23–29.
- Virkkunen, K. , Moore, J. C. , Isaksson, E. , Pohjola, V. , Peramaki, P. , Grinsted, A. , and Kekonen, T. , 2007: Warm summers and ion concentrations in snow: comparison of present day with Medieval Warm Epoch from snow pits and an ice core from Lomonosovfonna, Svalbard. Journal of Glaciology , 53: 623–634.
- Xiang, S. R. , Shang, T. C. , Chen, Y. , Jing, Z. F. , and Yao, T. D. , 2009: Changes in diversity and biomass of bacteria along a shallow snow pit from Kuytun 51 Glacier, Tianshan Mountains, China. Journal of Geophysical Research-Biogeosciences , 114: 10, doi: http://dx.doi.org/10.1029/2008JG000864.
- Yoshimura, Y. , Kohshima, S. , Takeuchi, N. , Seko, K. , and Fujita, K. , 2000: Himalayan ice-core dating with snow algae. Journal of Glaciology , 46: 335–340.