
Abstract
In order to determine the distribution and morphometric characteristics of thermokarst lakes on the Qinghai-Tibet Plateau, SPOT-5 satellite images were acquired from the Chumaerhe High Plateau to Beiluhe Basin within a 10-km-wide corridor along the Qinghai-Tibet Railway. A total of 2163 water bodies, having a total area of 1.09 × 10⁷ m2, were identified in the study area using unsupervised classification and image interpretation. Several shape metrics (area, perimeter, circularity index, elongation index, orientation of major axis, and curvature of lake shoreline) were determined for lakes from the imagery, and bathymetric profiles of lake bottoms were derived using ground-penetrating radar. The results highlighted significant morphometric differences between lakes larger than 5000 m2 among three subregions: the Chumaerhe High Plain (CHP), the Hoh Xil Hill region (HXR), and the Beluhe Basin region (BBR). The lakes in CHP usually have a more regular outline and smooth lake bottoms, while the lakes in HXR often have the greatest depths and the most complex shorelines. The most elongated and largest lakes were typically in BBR. Other than a minor NE-SE peak in HXR and BBR, the major axis orientation for lakes in the three subregions is mostly ENE-WSW. The differences in lake morphology between the three subregions are associated with differences in ground-ice content, local relief, and topography. The dominant factors controlling the development of orientated thermokarst lakes in the region are the prevailing summer wind direction and solar insolation.
Introduction
Permafrost underlies about 20% of the land surface of China and over 1,500,000 km2 of the Qinghai-Tibet Plateau (QTP) (CitationZhou et al., 2000). The permafrost in the plateau is characterized by high ice contents and warm ground temperatures (CitationZhou et al., 2000) and has experienced noticeable warming during the past 40–50 years (CitationCheng and Wu, 2007). Mean annual ground temperatures (MAGT) and active-layer thicknesses have been increasing in the past two decades, and the permafrost has undergone significant degradation (CitationJin et al., 2006, Citation2008). Thermokarst refers to irregular land-surface morphology resulting from the thaw of ice-rich permafrost, and is one of the most common features caused by permafrost degradation (Citationvan Everdingen, 2005). Thermokarst lakes form in the depressions created by the thaw of ice-rich permafrost (CitationHerbert, 1997). They are widespread on the QTP and influence the local ecology, geomorphology, hydrology, and climate.
Previous studies of thermokarst lakes have investigated their evolution and development (CitationBurn and Smith, 1990; CitationKääb and Haeberli, 2001; CitationJorgenson and Shur, 2007; CitationSmith et al., 2005), the carbon release caused by permafrost thaw (CitationPhelps et al., 1998; CitationWalter et al., 2006, Citation2007; CitationSchuur et al., 2009; CitationZona et al., 2009; CitationKarlsson et al., 2010), their role as an indicator of regional water and ecological balances (CitationSmith et al., 2005; CitationRiordan et al., 2006; CitationOsterkamp et al., 2009; CitationPohl et al., 2009), and their morphometry and orientation using remote-sensing methods (CitationHinkel et al., 2005; CitationMorgenstern et al., 2011; CitationSjöberg et al., 2012). Most of these studies were carried out in Arctic regions. Previous studies of thermokarst lakes on the QTP have commonly been field-based investigations on a single lake, or restricted to lakes in a limited area (CitationLin et al., 2010; CitationNiu et al., 2011). Thermokarst lake inventories covering large areas of the QTP are lacking in the published literature. In addition, morphometric properties of thermokarst lakes, and particularly the lake orientation, have not been widely investigated on the QTP.
Several studies have suggested that the formation of oriented lakes in permafrost regions is caused by the prevailing summer wind direction (CitationRex, 1961; CitationCarson and Hussey, 1962; CitationHinkel et al., 2005). Other studies have found that the oriented morphology of thermokarst lakes is also controlled by the amount of solar insolation (CitationUlrich et al., 2010), sand dunes (CitationSellmann et al., 1975), snow cover distribution (CitationPayette et al., 2004; CitationSeppälä, 2004), and local topography (CitationPelletier, 2005). However, the pattern of orientation of thermokarst lakes on QTP and the factors influencing their formation remain unknown.
This study aims to address the knowledge gaps outlined above by providing the first regional thermokarst lake inventory and characterizing morphometric properties of thermokarst lakes on the QTP, and by examining potential controls on lake morphology and orientation. The results will improve our understanding of permafrost characteristics in the region and be useful to future regional studies of permafrost dynamics. This study uses SPOT-5 satellite imagery in a representative region spanning from the Chumaerhe High Plain to the Beiluhe Basin within a 10-km-wide corridor along the Qinghai-Tibet Railway (QTR) to investigate thermokarst lakes in a relatively large area. The objectives of this paper are (1) to identify thermokarst lakes with remotely sensed imagery of the study region, (2) to analyze the morphological characteristics of thermokarst lakes using the lake metrics described by Morgenstern et al. (Citation2011) and with lake depth profiles derived from ground-penetrating radar (GPR), (3) to compare shape metrics of the lakes between the three subregions using spatial statistics and morphometric analyses, and (4) to explain factors controlling regional variations in thermokarst lake morphometry and orientation.
Study Area
The study area consists of a 10-km-wide N-S transect along the Qinghai-Tibet Transportation corridor, which extends for about 139 km (). The region is underlain by continuous permafrost (CitationRan et al., 2012). Data from two meteorological stations () show that the dominant wind direction in summer has been ENE-WSW for the past ten years (, part a). The mean annual air temperature (MAAT) in the study region is around -4 °C. The lowest air temperature during this period was -30 °C at the end of January, and the highest was approximately 25 °C in July. Precipitation in the region falls predominantly between May and August.
Topographic features in the study area vary significantly along the N-S transect. Based on the regional topography, we divided the study area into three subregions: the Chumarhe High Plateau (CHP), the Hoh Xil Hill region (HXR), and the Beiluhe Basin region (BBR) (). The main characteristics of the three subregions are presented in . The CHP is located in terrain with little topographic relief: 90% of the region's area has slope gradients below 4°. According to geological prospecting data for the QTR, the substrate consists of silty clay with a thickness of 2–4 m, overlying loose Quaternary sand with a thickness of 2–5 m. Below these two layers are well-weathered sandstone and mudstone. The surficial cover consists of sparse alpine grasslands (coverage <10%), interspersed with bare, sandy areas (CitationLi et al., 1996). The mean annual ground temperature (MAGT, at 15 m depth) is between -1.5 and -0.5 °C, and the depth of the active layer ranges from 1.5 to 3 m (CitationLiu and Wu, 2000; CitationWu et al., 2002, Citation2004). The volumetric ice content of the permafrost ranges from 30% to 50% in about 35% of the region, and below 30% in about 60% of the region (CitationZhou et al., 2000; CitationLu et al., 2012).
HXR is dominated by hilly terrain. Other than piedmont and riverbed areas, the slope in this region is typically greater than 8°. The land surface is covered with 3–5 m deep of Quaternary diluvial sandy clay in the piedmont, and sand and gravel in riverbeds and valleys. Vegetation is mainly alpine meadow with coverage greater than 40%, other than in riverbed areas. The MAGT is between -2.5 and -0.5°C, and the depth of the active-layer depths are from 1.5 to 2.5 m (CitationLiu and Wu, 2000; CitationWu et al., 2002, Citation2004). Other than in high mountain areas, the permafrost in this region is ice-rich, particularly in piedmont areas (volumetric ice content > 50%) (CitationZhou et al., 2000; CitationLu et al., 2012).
BBR is a basin region between Fenghuoshan Mountain and HXR, comprised of floodplains and terraces along the Beluhe and Xiushuihe Rivers. The terrain is relatively flat, with about 80% of the region having a slope gradient below 8°. The river terraces are covered with 1–2 m deep alluvial or pluvial sand, while floodplains are blanketed with sandy gravel of 2–5 m deep. Most of the region (60%) is alpine meadow, with vegetation cover greater than 45%, and the rest of the area is alpine grassland with greater than 30% cover. The MAGT is between -2.0 and -0.5 °C, and the depth of the active layer is between 1.5 and 2.0 m (CitationLiu and Wu, 2000; CitationWu et al., 2002, Citation2004). The permafrost is characteristically ice-rich, with 70% of the region having volumetric ice contents greater than 30%, and 20% of the area having ice contents higher than 50% (CitationZhou et al., 2000; CitationLu et al., 2012).
Data and Methods
REMOTELY SENSED DATA AND IMAGE PROCESSING
Two SPOT-5 scenes used to map thermokarst lakes in the study region were acquired in October 2010. These images have a spatial resolution of 10 m. The SPOT-5 images were orthorectified using ENVI 4.6 image processing software. Ground control points were selected from the 1:100,000 topographic map or by manual selection in the field using the high-precision Global Positioning System (GPS). The selection of ground control points ensured that (1) the points were easily recognizable (e.g., road intersections and building boundaries), (2) there were an adequate number of evenly distributed points across the study region, and (3) the points did not change over time.
The image was mosaicked using the image Mosaic module of ENVI 4.6, based on the geographic coordinate mosaic method. We chose the edge feathering method that uses 50% of the hybrid to fusion by input specified distance value on the edge of the top image and bottom image. The overlap of roads and rivers in the mosaicked images matched very well, and no gaps existed between different images, which demonstrated the high precision of the image mosaic.
Since the ground cover on QTP is relatively uniform, the Kmeans unsupervised classification in ENVI 4.6 was used to delineate water bodies in the study area. Water bodies can be easily distinguished from other land cover types, such as vegetation and bare ground, because they are strong absorbers of infrared wavelengths. Therefore, we applied band 4 (SWIR: 1.58–1.75 μm) of the SPOT-5 multispectral images for the water body classification. We then compared classification results with the actual distribution of water bodies. We found the most accurate classification was produced when six classes were used with a change threshold of 13. Rivers and small streams were manually removed from the classification image, leaving only the thermokarst lakes shown in . To ensure the accuracy of the classification results, we compared them with field investigation results from September 2011. From a randomly selected group of 80 lakes, 78 were interpreted correctly as thermokarst lakes (97.5%). The other two lakes were very small and dried up in September 2011.
MORPHOMETRIC ANALYSES
As the extracted water body was raster data, it was converted into vector polygons, and the subsequent data processing and analyses were performed in ArcGIS 9.3. We calculated morphometric variables including area, perimeter, circularity index, elongation index, and the orientation of the major axis for lakes with a circularity index below 0.95 using the methodology described in Morgenstern et al. (Citation2011) (). In addition, we calculated the curvature of lakeshores for 30 randomly selected lakes in each subregion to characterize the lake shoreline sinuosity. For each of these lakes, we calculated the curvature of 2000 discrete points and used the average value to represent the curvature of the shoreline. To analyze the distributions of the morphometric variables, we used the Kolmogorov-Smirnov test in SPSS 17.0. The results indicated that none of the morphometric variables were normally distributed. Therefore, the rank-based Kruskal-Wallis test was used to illustrate the lake morphometric differences among the three subregions, and the Mann-Whitney U test was used to further examine differences between pairs of subregions.
FIGURE 1. Location of the study area on the Qinghai-Tibet Plateau. The interpreted thermokarst lakes and the sites of meteorological stations are also shown in this figure. (Revised from two SPOT-5 multispectral images with spatial resolution of 10 m, National Centre for Space Studies, France).
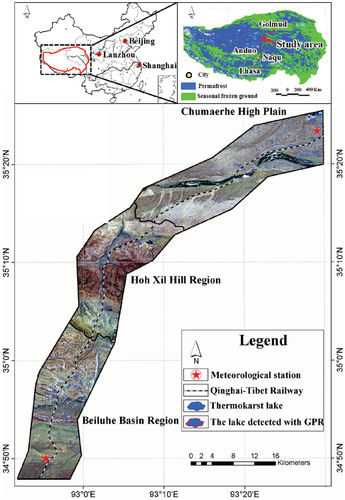
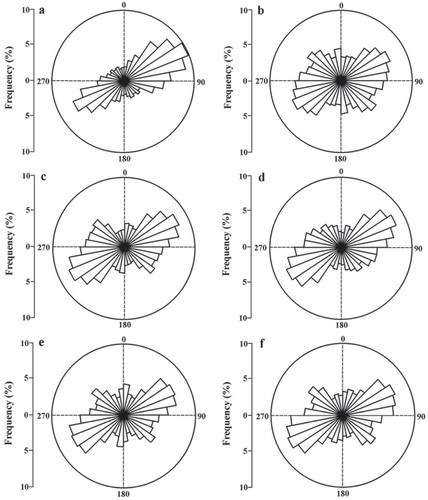
FIGURE 2. (a) Frequency distribution of summer wind direction in the study area. Frequency distributions of major axis orientation for (b) lakes <5000 m2 in the study area, (c) lakes >5000 m2 in the study area, (d) lakes >5000 m2 in Chumaerhe High Plain (CHP), (e) lakes >5000 m2 in Hoh Xil Hill region (HXR), and (f) lakes >5000 m2 in Beluhe Basin region (BBR). 0° = North, 90° = East, 180° = South, 270° = West. (The meteorological data in CHP was provided by the Key Laboratory of Plateau Atmospheric Physics Research in Cold and Arid Regions, and the meteorological data in BBR was provided by the Beiluhe Research Station of Cold and Arid Regions Environmental and Engineering Research Institute.)
LAKE DEPTH PROFILES
Geophysical methods have been widely used to identify physical structures of the subsurface because of the close relationships between physical properties of geologic materials and their electromagnetic signatures (CitationDavis and Annan, 1989; CitationDallimore and Davis, 1987). The difference between the electromagnetic properties of ice, water, and the sediments under lake bottoms makes GPR an effective method for determining lake depth profiles in the field.
The GPR unit used in this study was a pulseEKKO PRO, manufactured by SSI Inc., Canada. Based on considerations of the desired resolution and the depths of lakes in the study area, a 100 MHz antenna was employed. The velocity of pulse propagation was determined by common midpoint (CMP) velocity surveys and verified with a borehole drilled through the lake ice. The EKKO View Deluxe software was used for editing and plotting the data. The bathymetric profiles of lake bottoms were investigated in detail using the GPR. We first measured the depths of 50 randomly selected lakes in CHP, 35 in HXR, and 45 in BBR by boring a hole through the lake ice. Based on the measured lake depths and lake area data acquired from the SPOT-5 images, we selected 15 lakes in January 2013 and an additional 3 lakes in April 2013 with different lake depth and lake size range for the GPR investigations. Of the 18 lakes, lakes 1–7 are in CHP, lakes 8–12 are in HXR, and lakes 13–18 are in BBR.
TABLE 1 Characteristics of the three subregions. (MAGT refer to mean annual ground temperature at the depth of -15 m). CHP = Chumarhe High Plateau; HXR = Hoh Xil hill region; BBR = Beiluhe basin region.
TABLE 2 Overview of morphometric variables calculated for the thermokarst lakes (after CitationMorgenstern et al., 2011).
Results
ALL LAKES IN THE STUDY AREA
We classified 2163 lakes with a total area of 1.09 × 10⁷ m2 within the study area. The largest lake was 4.49 × 10⁵ m2 and the smallest was 100 m2, which corresponds to the area of one pixel of SPOT-5 imagery. The frequency distribution of the areas of all lakes () is strongly skewed toward lower values, indicating that small lakes are much more abundant than larger ones.
In our field investigation, we found that many small lakes were very shallow and commonly disappeared during the dry season. Over 90% of these lakes have an area less than 5000 m2 and did not possess a retrogressive lakeshore caused by thermal erosion. Inclusion of these small lakes would have dramatically skewed the results of morphometric analyses in the study area. Therefore, the lakes were classified into two size groups according to the mean area (5039 m2), either >5000 m2 (large) or <5000 m2 (small). The descriptive statistics for the shape metrics of these two groups revealed significant differences in lake morphometry (). The mean circularity index and elongation index of large lakes were 0.57 and 1.39, respectively, and 0.69 and 1.18 for small lakes. This indicates that the large lakes were more elongated than the small lakes. , parts b and c, show the frequency distributions of major axis orientations for the two lake size groups. The major axis orientation of lakes larger than 5000 m2 shows a significant ENE-WSW peak, while the orientation of lakes smaller than 5000 m2 is nearly uniformly distributed in every direction. This may be because the small lakes do not enlarge appreciably through preferential erosion of the lakeshore.
REGIONAL ANALYSIS
Descriptive statistics for thermokarst lakes in the three subregions (CHP, HXR, and BBR) are presented in . These regions occupied different proportions of the study area: 41% is in CHP, 28% is in HXR, and 31% is in BBR. The summary statistics show that thermokarst lakes cover about 1.3% of the total area of CHP, 0.6% of HXR, and 1.6% of BBR (). Lake density (number of lakes per km2) in HXR and BBR was 2.1 and 2.5, respectively, while in CHP it was 3.5. These data indicated that BBR had the highest lake area coverage, while CHP had the highest lake density.
The morphometric variables of thermokarst lakes varied largely between the three subregions (), particularly for the large lakes. The Kruskal-Wallis test indicated that the lakes larger than 5000 m2 had significantly different areas and perimeters (p < 0.005) in the three subregions (). There were no significant differences in area or perimeter for the lakes smaller than 5000 m2 (). The Mann-Whitney U test further illustrated that the differences primarily existed between BBR and the other two regions (CHP and HXR), while there was no significant difference between CHP and HXR (). The detailed metrics listed in show that the lake areas and perimeters in BBR were much greater than in CHP and HXR.
FIGURE 3. Frequency diagram of all lakes in the study area.
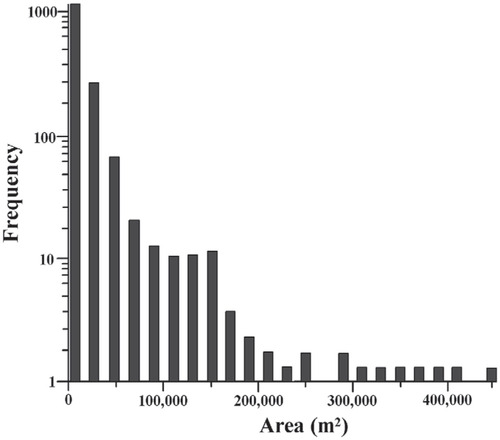
TABLE 3 Descriptive statistics of thermokarst lakes in the study area.
TABLE 4 Descriptive statistics of the thermokarst lakes in the three subregions.
The Kruskall-Wallis test also revealed significant differences (p < 0.01) in the circularity and elongation indices of large lakes between the three subregions (). These differences mainly existed between BBR and the other two regions (). The results of these analyses, and the metrics provided in indicated that the thermokarst lakes are more elongated in BBR than the other two regions.
Significant differences (p < 0.05) in major axis orientation also existed for large lakes between the three subregions (). (parts d-f) shows the frequency distribution of major axis orientation for lakes with areas larger than 5000 m2 in the three subregions. These results indicate that the large lakes in the study area shared the same peak in major axis orientation (ENE-WSW), albeit with different frequencies. Lakes in CHP were only strongly oriented ENE-WSW. In HXR, there were two small peaks in the NW-SE and N-S directions, as well as a major ENE-WSW peak. The major axis orientation of lakes in BBR usually had a weak NW-SE peak and the major ENE-WSW peak.
The depths of lakes based on the GPR data () and manual measurements are shown in . The results suggest that the lakes in HXR were deeper than the lakes in BBR and CHP. The maximum recorded depth for lakes in the CHP was 1.97 m, while the maximum depth was 2.95 m in HXR. The depths of lakes in BBR (maximum: 2.16 m; minimum: 0.91 m) falls between those observed in CHR and HXR. The ice thickness on the lakes in winter was also obtained from the GPR profiles. The maximum ice thickness was 0.63 m in CHP, 0.53 m in HXR, and 0.52 m in BBR ().
TABLE 5 Descriptive statistics of morphometric variables of thermokarst lakes >5000 m2 in the three subregions (morphometric variables of thermokarst lakes <5000 m2 are also shown in brackets). “Normal” refers to the Shapiro-Wilk test for distribution normality at the 0.10 significance level; n = non-normal; N refers to lake number.
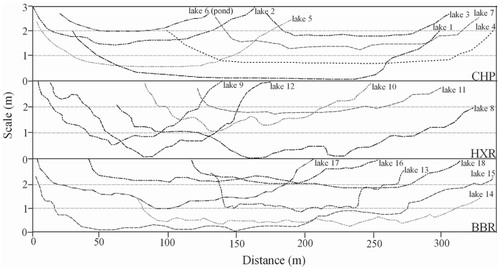
The differences of bathymetric profiles in the three subregions are shown in . All of the seven selected lakes in CHP had a smooth and regular lake bottom, while the profiles are more complicated in HXR and BBR, with the exception of lake 11 in HXR and lake 18 in BBR. In addition, the curvature of shorelines in HXR was significantly greater than those in CHP and BBR (), which indicates that lakes in HXR had more complex shorelines than lakes in CHP and BBR.
In summary, significant spatial differences existed in shape metrics of thermokarst lakes in the study area. In CHP, the lakes typically had more regular shoreline shapes and smoother lake bottoms, but they were also smaller and shallower than in the other two regions. In HXR, the lakes were commonly deeper, and had more complex shorelines and lake bottom profiles. In BBR, the lakes were bigger and were usually more elongated than in the other two regions.
TABLE 6 Results of rank-based Kruskal-Wallis test for morphometric variables of lakes >5000 m2 and <5000 m2 among the three subregions.
TABLE 7 Results of rank-based Mann-Whitney-U test for morphometric variables of lakes >5000 m2 between pairs of subregions.
Discussion
REGIONAL DIFFERENCES IN LAKE MORPHOMETRY
Significant differences existed in the morphometric characteristics of large thermokarst lakes in the three subregions (). Some studies (CitationSellmann et al., 1975; CitationHinkel et al., 2005) on the Arctic coastal plain of Alaska have noted that lake size and shape are closely related with ground-ice content, local relief, and surface age. However, the factors contributing to the differences in morphometric characteristics of thermokarst lakes on QTP are not clear, so here we discuss the relations observed in our investigation.
The formation of large thermokarst lakes in permafrost regions requires sediments with high ice contents, and low surface relief. The thaw of ice-rich ground causes subsidence and encourages lake development in resulting depressions. Flat ground limits drainage and allows water bodies to persist. Compared to HXR, the flat terrain of CHP and BBR provides more favorable conditions for the development of large lakes in these two regions. However, the permafrost in BBR has higher ice contents than in CHP, which contributes to the formation of larger lakes in BBR.
FIGURE 4. Ground penetrating radar profile of lake-13 in BBR.
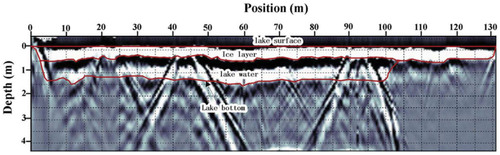
FIGURE 5. The bathymetric profiles of lake bottom in the study area. Lakes No.1–7 are in CHP, lakes No.8–12 are in HXR, and No.13–18 are in BBR.
The shorelines in HXR are much more sinuous than in the other two regions (). The majority of the thermokarst lakes in HXR are located in lowland areas of the piedmont region, since the steeper terrain does not allow large water bodies to form. The lowland areas in HXR have irregular, rolling topography, which may lead to the complex lakeshores observed in the region. In contrast, the terrain in CHP and BBR is flat, and shoreline morphology is mainly controlled by shoreline retrogression along the oriented axes rather than the local topography. Therefore, the lakeshores in CHP and BBR are more rounded than in HXR.
According to Sellmann et al. (Citation1975), elongated lakes are more likely to be found in low-relief terrain with high ground-ice content. The thaw of ice-rich terrain allows continual lakeshore enlargement, while low-relief terrain ensures that the elongation of the lakeshore is not affected by surrounding topography. HXR commonly has high ground-ice contents and rolling topography, while CHP usually has low-relief terrain and relatively low ground-ice content, so the most elongated lakes were most commonly found in BBR, which had both high ice content and low-relief terrain. The circularity index of elongated lakes is lower than that of nearcircular lakes, so the values of this index in CHP and HXR were much higher than in BBR.
The deepest lakes were located in HXR, which may be due to the high ground-ice contents and rolling topography in this region. The GPR profiles indicated that lakes in CHP usually have smoother bottoms than in HXR and BBR. This is likely due to the sandy substrate and sparse vegetation cover in the region. Strong winds commonly deposit large volumes of sand into the lakes, contributing to the smooth lake bottoms in the region. The lakes in HXR and BBR were mainly distributed in alpine meadow areas where the vegetation cover is greater than 30%, so the winds cannot carry large amount of sediment into the lakes. As a result, the lake bottoms maintain their original morphology.
THE DEVELOPMENT OF ORIENTED THERMOKARST LAKES
Although the large (>5000 m2) thermokarst lakes in this study are not typical of oriented lakes that have been described in the Arctic Coastal Plain of northern Alaska (CitationBlack and Barksdale, 1949; CitationSellmann et al., 1975; CitationHinkel et al., 2005), they still show distinct oriented patterns. There are many postulated reasons for the formation of the oriented lakes in permafrost regions. The following discussion presents the apparent controls on lake orientation in the study region.
The prevailing summer winds in the study area are ENEWSW (, part a), parallel to the major axis of oriented lakes. Therefore, the lake orientation in the study area may be the result of the long-term prevailing summer winds. According to observations from a field investigation of one oriented lake, enlargement occurs as the result of lakeshore collapse. However, when the collapsed materials covered the exposed ground ice, the rate of shoreline retrogression decreased. In summer, waves carry away the slumped materials and expose ground ice in the lakeshore that is perpendicular to the summer winds. This results in the lakeshore eroding more rapidly in the downwind direction, thereby forming oriented lakes with major axes parallel to the prevailing summer winds. This result is similar to those found in a study of oriented lakes in Northeastern European Russia (CitationSjoberg et al., 2012), but differs from results from several studies in the North American Arctic Coastal Plain, which suggested that lakes were oriented perpendicular to the prevailing summer wind directions because wind-driven circulation resulted in the thermo-mechanical erosion of ice-rich permafrost (CitationCarson and Hussey, 1962; CitationCote and Burn, 2002; CitationHinkel et al., 2005).
On the QTP, abundant convective clouds usually occur between 12:00 and 18:00 (CitationYe and Gao, 1979; CitationZhang, 1988). Therefore, the highest incident insolation also occurs before noon, causing the NW (SE-facing) slopes to receive the most solar radiation (CitationSun et al., 2008). The lakes in HXR and BBR show a minor NW-SE peak in major axis orientation, which may be the result of the solar insolation distribution. Field investigations showed that more than 70% of such lakes are developed in regions with SE-facing slopes. In addition to the major ENEWSW peak in lake orientation and the minor NW-SE peak, lakes in HXR also had a weak N-S peak. This may be the result of other controlling factors such as preexisting microtopographic orientations (e.g., CitationPayette et al., 2004) observed in sub-Arctic regions. Many rectangular borrow pits were excavated in HXR parallel to the Qinhai-Tibet Highway (QTH) during the highway construction. Since much of the highway runs N-S in HXR (), lakes that developed in these rectangular borrow pits usually have major axes in the same direction. Such lakes are commonly found along the QTH, but are quite small in CHP and BBR, with only a few larger examples in HXR having areas larger than 5000 m2.
In summary, the orientation of large thermokarst lakes in most of the study region is associated with the prevailing summer winds, but solar insolation is also important in regions with SE-facing slopes. Preexisting microtopographic orientation, such as rectangular pits along the roadway, also influenced lake orientation in HXR, but was seldom a factor in the other regions.
THERMOKARST EXTENT AND POTENTIAL FUTURE LAKE DEVELOPMENT
Large thermokarst lakes (>5000 m2) covered only 1.0% of the study area. This coverage is much lower than the 20% lake coverage of the western Arctic coastal plain in Alaska (CitationHinkel et al., 2005), the 30% lake coverage of the Tuktoyaktuk Peninsula in Arctic Canada (CitationCote and Burn, 2002), or the 5.2% lake coverage on the Yedoma landscapes in the Lena Delta in Russia (CitationMorgenstern et al., 2011). If lakes smaller than 5000 m2 are included, the coverage on the QTP is still less than 1.5%. According to borehole data from the study region, ice-rich permafrost exists only from 2 to 4 m below the active layer, underlying the well-weathered sandstone and mudstone, which has an ice content less than 10%. In contrast, high ground-ice contents (>20% in volume) occur in the Arctic to depths of 10–20 m below the active layer (CitationBrown et al., 1997). In addition, active layers in the Arctic are much shallower than on the QTP, so the ground ice there may be more easily exposed to initiate thermokarst lakes. These two factors offer an explanation for the low areal coverage of thermokarst lakes on the QTP.
Of the 700 large lakes in the study area, the majority were in undisturbed tundra surfaces, while a small proportion were located in old thermokarst lake basins. For the lakes developed in tundra surfaces outside older thermokarst basins, the surrounding ice-rich permafrost facilitated continuous slumping and retrogression of lakeshores, resulting in large lakes. Monitoring of one thermokarst lake in BBR that developed in undisturbed tundra indicated that the lakeshore retreated 5.2 m between 2007 and 2012. In contrast, lakes located in old thermokarst basins may not increase in size significantly because the basin sediments are ice poor. The high rate of evapotranspiration on the QTP may even cause some lakes to shrink. However, the gradual increase in precipitation (CitationWu et al., 2005; CitationGe et al., 2008), and the low permeability of the mudstone substrate may prevent the disappearance of lakes found in old thermokarst lake basins. The majority of the small lakes (<5000 m2) are situated on tundra surfaces outside older thermokarst basins. With climate warming and the associated thaw of permafrost (CitationCheng and Wu, 2007; CitationJin et al., 2006), these small lakes may enlarge over time. Therefore, if temperature and precipitation continue to increase, the number of thermokarst lakes and the area they cover may increase in the future.
Conclusions
The following conclusions can be drawn from the above analyses:
(1) Based on SPOT-5 satellite imagery, 2163 water bodies with a total area of 1.09 × 10⁷ m2 were detected within the study area. Of these water bodies, 700 were lakes larger than 5000 m2. These large lakes had a total area of 9.3 × 10⁶ m2 and covered 1.0% of the study area.
(2) Significant differences in morphometric characteristics existed between the three subregions for thermokarst lakes larger than 5000 m2. Loose surface sediments and sparse vegetation contributed to the formation of smooth lake bottoms in CHP. Rolling topography and relatively high ground-ice contents in HXR were associated with the greatest lake depths and most complex shorelines. High ice contents and low slope gradients provided favorable conditions for the development of large and elongated lakes in BBR.
(3) Except for two minor NE-SE and N-S peaks, the major axis of orientation of lakes larger than 5000 m2 was ENE-WSW in the three subregions. The orientation of large lakes in most of the study region is controlled by the prevailing summer wind direction, but solar insolation was important in areas with SE-facing slopes. In addition, preexisting microtopographic conditions, such as rectangular pits along the roadbed, also controlled lake orientation, mainly in HXR.
(4) The shape metrics derived from remotely sensed imagery can be used to make broad interpretations of surface processes, and the study has demonstrated the utility of this approach. However, this study only examined lakes along a narrow N-S transect. In future studies, the morphological characteristics of thermokarst lakes should be examined on a larger scale on the QTP.
Acknowledgments
This work was supported by the Western Project Program of the Chinese Academy of Sciences (KZCX2-XB3-19), the State Key Development Program of Basic Research of China (973 Plan, 2012CB026101), the Foundation for Innovative Research Groups of the National Natural Science Foundation of China (Grant No. 41121061), the Foundation for Excellent Youth Scholars of CAREERI (CAS 51Y251941).
Related Research Data
References Cited
- Black, R. F. , and Barksdale, W. L. , 1949: Oriented lakes of northern Alaska. Journal of Geology , 57: 105–118.
- Brown, J. , Ferrians, O. J. , Heginbottom, J. A. , and Melnikov, E. S. , 1997: Circum-Arctic map of permafrost and ground-ice conditions. Denver, Colorado: USGS Circum-Pacific Map Series, scale 1:10,000.
- Burn, C. R. , and Smith, M. W. , 1990: Development of thermokarst lakes during the Holocene at sites near Mayo, Yukon Territory. Permafrost and Periglacial Processes , 1: 161–175.
- Carson, C. E. , and Hussey, K. M. , 1962: The oriented lakes of Arctic Alaska. Journal of Geology , 70: 417–439.
- Cheng, G. D. , and Wu, T. H. , 2007: Responses of permafrost to climate change and their environmental significance, Qinghai-Tibet Plateau. Journal of Geophysical Research: Earth Surface (2003–2012) , 112: F02S03, http://dx.doi.org/10.1029/2006JF00063.
- Cote, M. M. , and Burn, C. R. , 2002: The oriented lakes of Tuktoyaktuk Peninsula, western Arctic coast, Canada: a GIS-based analysis. Permafrost and Periglacial Processes , 13: 61–70.
- Dallimore, S. R. , and Davis, J. L. , 1987: Ground-probing radar investigations of massive ground ice and near surface geology in continuous permafrost. Current Research, Part A, Geological Survey of Canada, Paper 87-1A: 913–918.
- Davis, J. L. , and Annan, A. P. , 1989: Ground-penetrating radar for high-resolution mapping of soil and rock stratigraphy. Geophysical Prospecting , 37: 531–551.
- Ge, S. , Tang, X. P. , and Lu, H. Y. , 2008: Climatic characteristics of rainfall and rainy days during the last 35 years over the Qinghai-Xizang Plateau. Acta Geographica Sinica , 63: 924–930 (in Chinese with English abstract).
- Herbert, B. , 1997: Dictionary of Geotechnical Engineering. New York, Springer.
- Hinkel, K. M. , Frohn, R. C. , Nelson, F. E. , Eisner, W. R. , and Beck, R. A. , 2005: Morphometric and spatial analysis of thaw lakes and drained thaw lake basins in the western Arctic Coastal Plain, Alaska. Permafrost and Periglacial Processes , 16: 327–341.
- Jin, H. J. , Zhao, L. , Wang, S. L. , and Jin, R. , 2006: Modes of degradation and thermal regimes of permafrost along the Qinghai-Tibet Highway. Science in China , 49: 1170–;1183 (in Chinese with English abstract).
- Jin, H. J. , Yu, Q. H. , and Wang, S. L. , 2008: Changes in permafrost environments along the Qinghai-Tibet engineering corridor induced by anthropogenic activities and climate warming. Cold Regions Science and Technology , 53: 317–333.
- Jorgenson, M. T. , and Shur, Y. , 2007: Evolution of lakes and basins in northern Alaska and discussion of the thaw lake cycle. Journal of Geophysical Research: Earth Surface (2003–2012) , 112: F02S17, http://dx.doi.org/10.1029/2006JF000531.
- Kääb, A. , and Haeberli, W. , 2001: Evolution of a high mountain thermokarst lake in the Swiss Alps. Arctic, Antarctic and Alpine Research , 33: 385–390.
- Karlsson, J. , Christensen, T. R. , Crill, P. , Forster, J. , Hammarlund, D. , Jackowicz-Korczynski, M. , Kokfelt, U. , Roehm, C. , and Rosen, P. , 2010: Quantifying the relative importance of lake emissions in the carbon budget of a subarctic catchment. Journal of Geophysical Research: Biogeosciences (2005–2012) , 115: G03006, http://dx.doi.org/10.1029/2010JG001305.
- Li, B. Y. , Gu, G. A. , and Li, S. D. , 1996: The Series of the Comprehensive Scientific Expedition to the Hoh Xil Region—Physical Environment of Hoh Xil Region, Qinghai. Beijing: Science Press, Chapters 1, 2, 6, and 7.
- Lin, Z. J. , Niu, F. J. , Xu, Z. Y. , Xu, J. , and Wang, P. , 2010: Thermal regime of a thermokarst lake and its influence on permafrost, Beiluhe Basin, Qinghai-Tibet Plateau. Permafrost and Periglacial Processes , 21: 315–324.
- Liu, Y. Z. , and Wu, Q. B. , 2000: Study on ground temperature field in permafrost regions of Qinghai-Tibet Plateau. Highway , 2: 4–8 (in Chinese with English abstract).
- Lu, J. H. , Cheng, H. , Niu, F. J. , Lin, Z. J. , and Liu, H. , 2012: Zoning evaluation on occurrence degree of thermokarst lake along Qinghai-Tibet Railway. Journal of Catastrophology , 27(4): 60–64 (in Chinese with English abstract).
- Morgenstern, A. , Grosse, G. , Gunther, F. , Fedorova, I. , and Schirrmeister, L. , 2011: Spatial analyses of thermokarst lakes and basins in Yedoma landscapes of the Lena Delta. The Cryosphere Discussions , 5: 1495–1545.
- Niu, F. J. , Lin, Z. J. , Liu, H. , and Lu, J. H. , 2011: Characteristics of thermokarst lakes and their influence on permafrost in Qinghai-Tibet Plateau. Geomorphology , 132: 222–233.
- Osterkamp, T. E. , Jorgenson, M. T. , Schuur, E. A. G. , Shur, Y. L. , Kanevskiy, M. Z. , Vogel, J. G. , and Tumskoy, V. E. , 2009: Physical and ecological changes associated with warming permafrost and thermokarst in interior Alaska. Permafrost and Periglacial Process , 20: 235–256.
- Payette, S. , Delwaide, A. , Caccianiga, M. , and Beauchemin, M. , 2004: Accelerated thawing of subarctic peat land permafrost over the last 50 years. Geophysical Research Letters , 31: L18208, http://dx.doi.org/10.1029/2004GL020358.
- Pelletier, J. D. , 2005: Formation of oriented thaw lakes by thaw slumping. Journal of Geophysical Research: Earth Surface (2003–2012), 110: F02018, http://dx.doi.org/10.1029/2004JF000158.
- Phelps, A. R. , Peterson, K. , and Jeffries, M. O. , 1998: Methane efflux from high-latitude lakes during spring ice melt. Journal of Geophysical Research: Atmospheres (1984–2012) , 103(D22): 29029–29036.
- Pohl, S. , Marsh, P. , Onclin, C. , and Russell, M. , 2009: The summer hydrology of a small upland tundra thaw lake: implications to lake drainage. Hydrological Processes , 23: 2536–2546.
- Ran, Y. H. , Li, X. , Cheng, G. D. , Zhang, T. J. , Wu, Q. B. , Jin, H. J. , and Jin, R. , 2012: Distribution of permafrost in China-an overview of existing permafrost maps. Permafrost and Periglacial Processes , 23: 322–333.
- Rex, R. W. , 1961: Hydrodynamic analysis of circulation and orientation of lakes in northern Alaska. In Rauch, G. O. (ed.), Geology of the Arctic. Toronto: University of Toronto Press, 1021–1043.
- Riordan, B. , Verbyla, D. , and McGuire, A. D. , 2006: Shrinking ponds in subarctic Alaska based on 1950–2002 remotely sensed images. Journal of Geophysical Research: Biogeosciences (2005–2012) , 111: G04002, http://dx.doi.org/10.1029/2005JG000150 .
- Schuur, E. , Vogel, J. , Crummer, K. , Lee, H. , Sickman, J. , and Osterkamp, T. , 2009: The effect of permafrost thaw on old carbon release and net carbon exchange from tundra. Nature , 459: 556–559.
- Sellmann, P. V. , Brown, J. , Lewellen, R. I. , McKim, H. , and Merry, C. , 1975: The Classification and Geomorphic Implications of Thaw Lakes on the Arctic Coastal Plain, Alaska. United States Army, CRREL Research Report 344, 21 pp.
- Seppälä, M. ., 2004: Wind as a Geomorphic Agent in Cold Climates. Cambridge, United Kingdom: Cambridge University Press.
- Sjöberg, Y. , Hugelius, G. , and Kuhry, P. , 2012: Thermokarst lake morphometry and erosion features in two peat plateau areas of northeast European Russia. Permafrost and Periglacial Process , 24: 75–81.
- Smith, L. C. , Sheng, Y. , MacDonald, G. M. , and Hinzman, L. D. , 2005: Disappearing Arctic lakes. Science , 308: 1429.
- Sun, L. P. , Dong, X. F. , Zhou, Y. , Zhao, X. Z. , Wang, G. , and Chen, J. , 2008: The effect of embankment slope orientation along the Qinghai Tibet routes and related radiation mechanism. Journal of Glaciology and Geocryology , 30: 610–616 (in Chinese with English abstract).
- Ulrich, M. , Morgenstern, A. , Gunther, F. , Reiss, D. , Bauch, K. E. , Hauber, E. , Rossler, S. , and Schirrmeister, L. , 2010: Thermokarst in Siberian ice-rich permafrost: comparison to asymmetric scalloped depressions on Mars. Journal of Geophysical Research: Planets (1991–2012) , 115: E10009, http://dx.doi.org/10.1029/2010JE003640.
- van Everdingen, R. O. , 2005: Multi-Language Glossary of Permafrost and Related Ground-Ice Terms. National Snow and Ice Data Center/World Data Center for Glaciology, Boulder, available at http://nsidc.org/fgdc/glossary.
- Walter, K. M. , Zimov, S. , Chanton, J. P. , Verbyla, D. , and Chapin, F. S., III , 2006: Methane bubbling from Siberian thaw lakes as a positive feedback to climate warming. Nature , 443(7107): 71–75.
- Walter, K. M. , Edwards, M. E. , Grosse, G. , Zimov, S. , and Chapin, F. S., III , 2007: Thermokarst lakes as a source of atmospheric CH4 during the last deglaciation. Science , 318(5850): 633–636.
- Wu, Q. B. , Liu, Y. Z. , and Tong, C. J. , 2002: Interactions between the permafrost and engineering environments in the cold regions. Journal of Engineering Geology , 8: 281–287 (in Chinese with English abstract).
- Wu, Q. B. , Cheng, G. D. , and Ma, W. , 2004: The impact of climate warming on Qinghai-Tibetan Railroad. Science in China, Series D , 47 (Supplement I): 122–130 (in Chinese with English abstract)
- Wu, S. H. , Yin, Y. H. , Zheng, D. , and Yang, Q. Y. , 2005: Climate changes in the Tibetan Plateau during the last three decades. Acta Geographica Sinica , 60(1): 3–11 (in Chinese with English abstract).
- Ye, D. Z. , and Gao, Y. X. , 1979: Meteorology on the QTP. Beijing: Science Press, 1–79.
- Zhang, J. J. , 1988: Meteorological Research Progress on the QTP. Beijing: Science Press, 14–61.
- Zhou, Y. W. , Guo, D. X. , and Qiu, G. Q. , 2000: Permafrost in China. Beijing: Science Press, 403–404.
- Zona, D. , Oechel, W. C. , Kochendorfer, J. , Paw, U. K. T. , Salyuk, A. N. , Olivas, P. C. , Oberbauer, S. F. , and Lipson, D. A. , 2009: Methane fluxes during the initiation of a large-scale water table manipulation experiment in the Alaskan Arctic tundra. Global Biogeochemical Cycles , 23: GB2013, http://dx.doi.org/10.1029/2009GB003487 .