
Abstract
The Lancang River Basin (LRB) crosses from the higher inland Tibet Plateau to lower south Asia. Glaciers in upper reaches of the basin are significant reservoirs of freshwater and are considered to contribute substantially to the runoff of the Lancang River. In this study, we present the results of glacier inventories of the LRB and demonstrate its changes during the past 40 years, based on investigations conducted during two periods: the first (1968–1975) and the second (2005–2010) glacier inventory of China. Total area of the 423 measured glaciers in the LRB decreased by 98.50 ± 26.61 km2 from 328.16 ± 20.29 km2 in 1968–1975 to 229.66 ± 16.48 km2 in 2005–2010, indicating a loss in total glacier area of about 30% ± 8% during the past 40 years (at a mean area loss rate of 0.75% ± 0.2% a-1), which is comparable to glacier changes in other regions of high Asia. Southern glaciers in the LRB have experienced greater area loss than the northern inland Tibet regions, indicating more sensitivity of temperate glaciers to climate warming. The general warming trend but with less significant precipitation changes during the past 50 years (1960–2010), which has been confirmed by the observation of several meteorological stations across from the south to the north of the basin, could be one of the main causes accounting for the overall glacier recessions in the LRB.
Introduction
In mountainous areas, global climate change is manifested by a series of effects: the fragility related to mountain glacier shrinkage that characterizes high-altitude ecosystems (CitationHaugland and Beatty, 2005; CitationBaker and Moseley, 2007; CitationHodson et al., 2008), natural hazards (CitationRichardson and Reynolds, 2000; CitationFischer et al., 2006; CitationHuggel, 2009), and watershed hydrology (CitationImmerzeel et al., 2010 [add to reference list]; CitationKaser et al., 2010; CitationLiu et al., 2010; CitationGain et al., 2011 [add to reference list]; CitationSchaner et al., 2012; CitationSorg et al., 2012). In recent years, many studies have reported increased glacier loss from various mountainous regions across the world (CitationOerlemans, 1994, Citation2005; CitationBolch et al., 2012; CitationPathak, 2012; CitationSorg et al., 2012; CitationYao et al., 2012). Investigating the current extension of glaciers and its recent variations is important for evaluating the water resources they represent and also the perspective of climate changes they indicate (CitationLeclercq and Oerlemans, 2012). It is increasingly urgent, therefore, to monitor glacier change at regional or basin scale (CitationRadić and Hock, 2010). Multi-temporal satellite imagery and older aerial photography have been used extensively in the past decade to quantify glacier changes in mountainous areas throughout the world (CitationPaul, 2002; CitationSchmidt and Nüsser, 2009; CitationShangguan et al., 2009; CitationBolch et al., 2010; CitationNarama et al., 2010; CitationYao et al., 2012). The Global Land and Ice Measurements from Space (GLIMS) project was initiated with the goal of mapping the world's glaciers using satellite imagery (CitationKargel et al., 2005). Remote-sensing methods are useful for detecting multi-period glacier changes, especially for glaciers in remote regions where traditional field-based glaciological investigations are limited (CitationPaul et al., 2004).
There have been recent efforts to document the glacier area loss in different mountain regions (CitationLi et al., 2008; CitationKang et al., 2010) or drainage basins (e.g., CitationLiu et al., 2006; CitationShangguan et al., 2009) of western China, but none of these inventories has emphasized on the whole LRB. The Lancang River originates at the inland high Tibetan Plateau; flows through China to Myanmar, Laos, Thailand, Cambodia, and Vietnam; is here renamed the Mekong River; and then ultimately merges into the South China Sea. In recent years, construction of a cascade of hydropower dams on the Lancang River in southwestern China's Yunnan has highlighted the ecological and socio-economic issues that have attracted increasing regional and global attentions (CitationHe et al., 2006; CitationGrumbine and Xu, 2011; CitationRasanen et al., 2012). Few studies have been concerned with the cryosphere changes occurring in the upper reaches of the basin, which could alter the runoff generation and its seasonal distribution in the downstream (CitationHe et al., 2006; CitationQin and Ding, 2010). Hence, in this study we will analyze glacier changes in the LRB by comparing the latest results of the glacier inventory of China (GIC 2nd; 2005–2010) derived from multi-type satellite imagery with an earlier glacier inventory (GIC 1st; 1968–1975) derived from aerial photography.
Study Area
The LRB in China is the Upper Mekong Basin (), which makes up 24% of the total area of the Mekong River basin (CitationMRC, 2010). From the Tibetan Plateau in the north, the Lancang River runs through narrow and deep valleys to the south in Yunnan province, with about 189,000 km2 of watershed area and 474 to 6358 m a.s.l. of elevation range in China. According to the runoff records at the Jinghong station, the Lancang River annually discharges ∼61.7 km3 of water from China to its downstream basin, accounting for about 13.5% of the total Mekong River annual discharge (CitationMRC, 2010).
FIGURE 1. (a) Map showing the location of the Lancang River Basin (LRB) overlaid on the Shuttle Radar Topography Mission (SRTM) digital elevation model (DEM) and glacier distribution in its upper part. Glacier in the (b) upper and (c) lower region (black box) are zoomed in and blue boxes with numbers and drainage codes indicate the investigated subregions listed in and .
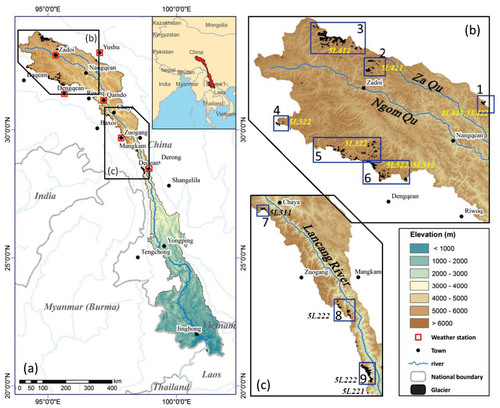
A concise summary of the GIC 1st has been provided by Shi (Citation2008). Glaciers are concentrated in its two major source regions, the Za Qu and Ngom Qu, the most highly glacierized tributaries in the upper LRB. The physical regime of glaciers in the LRB crosses the boundary between subcontinental type glaciers in its upper source region and maritime type glaciers in its middle reaches (CitationShi, 2008). Most glaciers in the LRB are small cirque or hanging glaciers, except for several larger valley glaciers in the eastern Meili Snow Mountain, located at the middle part the LRB and also the southernmost glacierized region in the basin (box 9 in ). Maritime glaciers in the middle part of the LRB have lower ice terminals and some of them are debris-covered. The Mingyong Glacier (also called the Nainuogeru Glacier) is the biggest glacier in the basin (CitationMoseley, 2006; CitationBaker and Moseley, 2007) with an area of 12.55 km2 in 2009 (based on the GIC 2nd) and extending 11.5 km from 6740 m to 2700 m a.s.l.
Based on the GIC 1st, it was estimated that about 4.43 × 10⁸ to 7.16 × 10⁸ m3 of the annual runoff in the LRB is contributed from glacial runoff (CitationShi, 2008; CitationKang et al., 2009). To summarize glacier changes for each hydrological regime, following the coding rules for drainage districts of China, the glacierized part of LRB is divided into eight sub-drainage basins coded as 5L412, 5L421, 5L422, 5L322, 5L312, 5L311, 5L222, and 5L221 (), and further into 23 fifth-level sub-basins.
Data and Method
GLACIER INVENTORY
Outlines of glaciers in the LRB for the two investigated periods are analyzed spatially and compared to identify their changes. For the GIC 1st, in which glacier coverage was mainly derived from topographical maps that are based on aerial photos taken between 1968 and 1975, eight 1:100,000 topographic maps were used for the determination of glacier extents. The geographic projections of these topographic maps were based on the Beijing Geodetic Coordinate System 1954 (BJ54). To delineate glacier outlines, all topographic maps were scanned and geo-referenced. Glacier outlines were then digitized on those maps and the map projection was transformed to WGS-84 projection based on a parameter transformation model (CitationShangguan et al., 2009; CitationXu et al., 2013; CitationWei et al., 2014).
TABLE 1 Landsat TM images used during the GIC 2nd for the Lancang River Basin (LRB).
The GIC 2nd is based on multimission satellite imagery (e.g., Landsat TM/ETM+, ASTER, and SPOT) acquired between 2005 and 2010 (CitationLiu et al., 2015). For the LRB, we use eight Landsat TM5 scenes to map the recent glacial ice coverage (). The TM4/TM5 ratio image with a threshold (CitationPaul, 2002) is used to delineate the glaciers. Debris-covered glaciers are digitized manually with assistance from the Google Earth images. The raw ice polygons are visually checked for classification errors such as persistent seasonal snow, rock outcrops, and moraines.
Ice coverage on each Landsat image is divided into individual glacier polygons using topographical ridgelines, or ice divides, which are computed using watershed delineation based on the Shuttle Radar Topography Mission (SRTM V4, available from http://srtm.csi.cgiar.org/) digital elevation model (DEM) (CitationReuter et al., 2007; CitationJarvis et al., 2008). The 90 m resolution SRTM DEM is resampled to 30 m (same as the Landsat TM5 images) and thus is used to derive glacial hypsometry and aspects. According to the GLIMS guidelines for the world glacier inventory (CitationPaul et al., 2009), we obtain the mean aspect of a glacier by calculating mean sine and cosine values for each glacier. Parameters derived in this way for glaciers of the GIC 2nd may be slightly biased compared with the actual values due to surface movements and changes in ice thickness and extent.
For both investigations, ice patches larger than 0.01 km2 are mapped and the similar resolution of these two data sources for glacier mapping makes the comparison of glacier changes reliable. Method of error analysis for glacier area and its changes is following Wei et al. (Citation2014) and Bolch et al. (Citation2010). For glacier outlines of the GIC 1st, which are derived from the 1:100,000 topographic maps, line pixel error (λ1) is estimated to ±27 m. For mapping results based on Landsat TM images for the GIC 2nd, line pixel error (λ2) is ±30 m, the resolution of Landsat scenes. The error of glacier area Sλ is defined as
where n is the total count of pixels along the outline of ice coverage, and λi is the line pixel errors. The error for calculation of changes in glacier area dS
λ is obtained by
CLIMATIC OBSERVATIONS ACROSS THE LRB
The entire LRB is characterized by different climatic patterns. The water vapor gradually reduces as the intruding southwest air mass moves north, and there is little precipitation in the inland region. Temperature generally increases from north to south and annual precipitation generally decreases from south to north. He and Zhang (Citation2005) has presented climate change in LRB from 1960 to 2000 based on 19 meteorological stations across LRB from the middle part to the south. Here we will analyze the air temperature and precipitation data from six weather stations located in the upper region of the Lancang River. Locations and general characteristics of these meteorological stations are shown in and . Some of these stations were not included in the study of He and Zhang (Citation2005), and they represent the climatic conditions for the source region of the LRB. Meteorological data (1960–2012) from these weather stations are used to characterize the climatic background and its recent trend in the upper region of the LRB over the past 50 years.
Results and Discussion
GLACIER CHANGES IN THE LRB
Based on the two inventories, the total area of the 423 measured glaciers in the LRB decreases by 98.50 ± 26.61 km2 from 328.16 ± 20.29 km2 in 1968–1975 to 229.66 ± 16.48 km2 in 2005–2010, indicating a total glacier area loss of ∼30% ± 8%, or 0.75% ± 0.20% a-1 during the past 40 years. Numbers and area of glaciers in each sub-drainage basins are summarized for the two investigation periods (). The average glacier size decreased by 0.28 km2 from 1968–1975 (0.78 km2) to 2005–2010 (0.49 km2). Based on the two inventories, a total of 33 small glaciers in the LRB with areas varying from 0.01 to 0.47 km2 has disappeared at the time of the GIC 2nd. Total numbers of glaciers, however, increased from 423 to 466 due to the disintegration of some ice bodies with the thinning of the glacier surface (CitationPaul et al., 2004). gives a detailed view of glacier outline changes for each sub-region indexed by nine boxes in , which are also distinguished for each drainage basin.
TABLE 2 General characteristics of the selected meteorological stations in the upper LRB.
FIGURE 2. Glacier change in the nine investigated subregions labeled in . Glacier outline for the glacier inventory of China (GIC) 1st is depicted by black hollow polygons; filled polygons are of the GIC 2nd and colored by different drainage codes listed in .
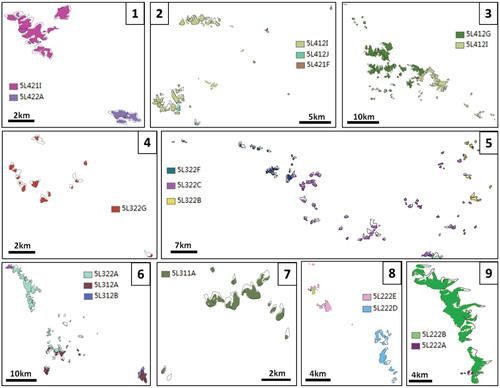
TABLE 3 Comparison of the GIC 1st and the GIC 2nd glacier inventories for the LRB.
Generally, high glacier area loss rates in the LRB are found in its southern regions (boxes 7, 8, and 9) whereas the lowest are found in the north (-0.08% ± 0.65% a-1 , 5L412F in ). An overall annual glacier area decrease rate of 0.75 ± 0.20% a-1 during the past 40 years in the LRB is remarkable when compared to glacier changes in other high Asian mountain regions (). Monsoonal temperate glaciers in the eastern Himalayas and southeastern Tibet are believed to be more sensitive to climate warming (CitationFujita and Ageta, 2000; CitationFujita, 2008). Previous studies have suggested that the glacier shrinkage rate generally decreases from the southern and eastern Tibet Plateau to the continental interior (CitationYao et al., 2012). In southeastern Tibet, the contemporary annual glacier area loss rate has been determined to ∼0.91% a-1 (CitationYao et al., 2012), whereas the annual glacier area loss rate in the inner Tibet Plateau has been assessed to 0.27% ± 0.15% a-1 (CitationWei et al., 2014). The observed glacier area changes in the LRB fall between these estimates and are consistent with decreasing glacier area loss rates toward the inner Tibet Plateau.
TABLE 4 Glacier area reduction rates in some high Asia mountain regions.
GLACIER CHANGES FOR DIFFERENT ALTITUDE, ASPECT, AND GLACIER SIZE
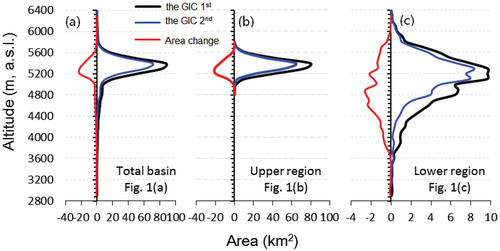
Glaciers in the LRB are distributed in the upper and middle part of the basin and no glacier is found in a latitude below 28°N (). presents the distribution of glacial area with elevation, which is summarized in 100 m elevation intervals based on the SRTM DEM, both for all glaciers in the LRB and for glaciers located in its upper and lower regions, as well as comparisons of glacier area changes between the GIC 1st and the GIC 2nd. Mapping results based on the GIC 1st show that about 73.3% of glacier area in the LRB is distributed in the upper region (, part b). For the total basin and the upper region (, parts a and b), glacier area reaches its maximum at about 5400 m a.s.l. Most of the loss in glacier area occurred between 5000 and 5500 m a.s.l.; the largest area loss (∼22 km2) occurred between elevations of 5200 and 5300 m a.s.l., with little change (<0.5 km2) in glacier extents above 5800 m a.s.l. and below 3800 m a.s.l. The elevation of maximum glacier area loss is about 100 m lower than the elevation of maximum glacier coverage. For the lower region (, part c), the maximum glacier area occurred at about 5200 m a.s.l.; the largest area loss (∼2.2 km2) occurred between 4800 and 4900 m a.s.l., ∼400 m lower than the upper region. The lowest altitude of glaciers (glacier terminal) in the LRB occurred at the lower region in eastern Meili Snow Mountain range, where the lowest altitude has risen by 182 m from 2871 to 3053 m a.s.l. between the GIC 1st and the GIC 2nd.
The glacier area distribution and their changes in eight aspects are plotted in . It shows that glacier cover in the LRB was predominantly oriented to the northeast, north, and east: with the total area amounting to 99.25 km2 (31%), 83.65 km2 (26%), and 50.99 km2 (15%), respectively, for the inventory of GIC 1st. At the time of the GIC 2nd, these values shifted slightly to 65.85 km2 (29%), 61.19 km2 (27%), and 33.16 km2 (15%), respectively. The glacial area reducing rate in each aspect is nearly the same (-31% in average), except for less reduction in the southeast (-16.5%).
The numbers of glaciers and areas for seven classes based on the GIC 1st are shown in , part a. Results show that 332 glaciers, or 78.5% of the glaciers in the entire study area, have an area of less than 1 km2, while their total area is only 110.79 km2 (33.8%). There are seven glaciers larger than 5 km2 and their total area accounts for about 16.0% of total glacier area in the LRB. For each glacier, the change in its surface area is compared with its initial size (area in the GIC 1st). , part b, shows the percentage changes in glacier area as a function of glacier area. It is obvious that percentages of area reduction of small glaciers are usually higher than those of larger glaciers. For the smaller glaciers (area less than 1 km2), there is a clear tendency toward loss of a greater percentage of their area over the study period. The larger glaciers (area larger than 5 km2), however, are less likely to have lost much percentage of their area, although the absolute area loss of larger glaciers is more remarkable. That is coincident with those studies of glacier change in some other mountainous regions around the world, for example, the European Alps (CitationHaeberli and Hoelzle, 1995), Tarim Basin in China (CitationShangguan et al., 2009) and western Canada (CitationBolch et al., 2010). In North America, however, DeBeer and Sharp (Citation2007) and Hoffman et al. (Citation2007) reported very limited area changes of the smallest glaciers and they suggested that most of the small glaciers are situated in locations that favor ice preservation by enhancing mass input and/or reducing ablation rates (CitationDeBeer and Sharp, 2009). This discrepancy may be due to the different status of small glaciers. One critical transition point is whether the small glaciers have retreated to an upper limited part, such as the regional equilibrium line altitude (ELA), above or below which altitude the regime of mass balance will result in the stability or shrinkage of the glacier (CitationRamirez et al., 2001). For glaciers in the LRB, our result suggests that, during our inventory period, the small glaciers in the LRB have shown more sensitivity to climate changes than larger glaciers.
FIGURE 3. Hypsometry and its changes of (a) all glaciers in the LRB and (b) glaciers in the upper and (c) lower region.
CLIMATE CHANGES IN THE UPPER REGION OF LRB
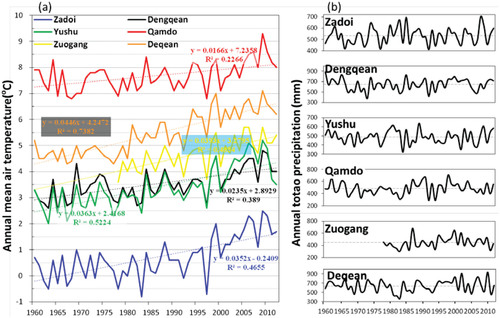
According to the report of He and Zhang (Citation2005), over the period of 1960–2000, mean annual air temperature across the middle to the south part of the LRB increased at the rate of 0.01 to 0.04 °C a-1, and the lowermost reaches of Lancang River experienced a much more dramatic temperature increase and precipitation decrease than the upper reaches. At the upper reaches of LRB, for the six meteorological stations analyzed in this study (), they show uniform upward trends in annual mean air temperature changes over the past 50 years (, part a). Between 1960 and 2012, the rate of increase in annual mean air temperature at these station averaged 0.33 °C 10a-1 and ranges from 0.17 to 0.45 °C 10a-1. It could be also found that the southern part of the basin experienced more remarkable temperature increases, such as at the Deqean, the most southern station, with an increasing rate of 0.45 °C 10a-1. For the northern part of the basin, the warm trend is likely more remarkable at higher elevations. At the elevation of about 4000 m a.s.l. at the Zadoi Station, annual mean air temperature has risen at least 2 degrees from below zero to nearly 2 °C. This means a ∼300 m upshift of the 0 °C isothermal layer, which could lead to a remarkable increase of ablation area and also of the ice melt rate during the summer. The precipitation (, part b) in the upper region of LRB shows less noticeable trends but more fluctuations over the past 50 years (e.g., the annual total precipitation at the Deqean Station varied from 373 to 937 mm between 1960 and 2012). Since no significant precipitation trends have been observed at all stations, one can assume that glacier recession in the LRB is primarily due to the air temperature increase. The relatively higher area loss rate of monsoonal temperature glaciers in the south is likely the result of the sharper air temperature increase during the past 50 years.
FIGURE 4. Aspect frequency distribution of glacier area and its changes in the LRB.
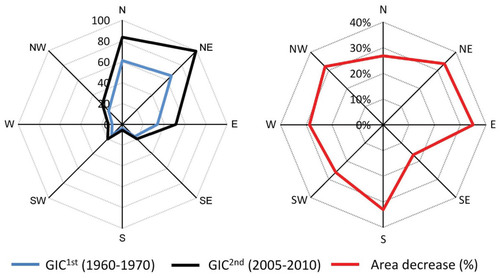
FIGURE 5. (a) Numbers and area distribution of the GIC 1st for different glacier area classes. (b) Relative changes in area plot against glacier area for 423 investigated glaciers in the LRB.
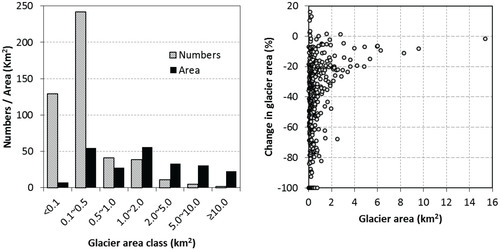
FIGURE 6. (a) Annual mean air temperature and (b) total precipitation variations at six meteorological stations (see ) over the period 1960–2012. Trend lines of air temperature are delineated by linear functions and R 2 values; dashed lines in panel (b) indicate mean annual total precipitation during the observation period.
Conclusions
We have presented a comprehensive inventory of glacier changes in the LRB for the period between 1968–1975 (the GIC 1st) and 2005–2010 (the GIC 2nd). During the past 40 years, glaciers in the LRB have experienced area loss with a mean rate of 0.75% a-1, which is comparable to glacier changes in some other high Asia mountain regions. High glacier area loss rates in the LRB are found in the southern regions for those small hanging or cirque glaciers in Meili Snow Mountain range. In the northern part of the LRB, the mean glacier area loss rate was lower than the area loss rate of the entire LRB. The maximum glacier area loss occurred at an elevation of approximately 5250 m a.s.l., which was 100 m lower than the highest glacier coverage in the LRB. Generally, small glaciers show higher area loss rate than larger glaciers. The differences in the rate of decrease in area for individual glaciers are mostly influenced by glacier size, whereas the area loss rates in certain aspects are not remarkable. The general warming trend during the past 50 years seems to be the main cause of the overall glacier recessions in the LRB, whereas the precipitation changes are less significant and therefore of secondary importance.
Acknowledgments
The authors are very grateful to two anonymous reviewers for their comments to improve the manuscript, and Ludwig Braun and Susan Braun-Clarke for their help in polishing the language. This work was funded by a program supported by the Ministry of Science and Technology (MOST) of China (grants 2012BAC19B07 and 2013BAC10B01) and the National Natural Science Foundation of China (grant 41371094). The data sets used in the study were a result of an immediate past project from the MOST (grant 2006FY110200). Satellite images were from the U.S. Geological Survey (USGS).
Related Research Data
References Cited
- Baker, B. B. , and Moseley, R. K. , 2007: Advancing treeline and retreating glaciers: implications for conservation in Yunnan, P.R. China. Arctic, Antarctic, and Alpine Research , 39: 200–209.
- Bolch, T. , Menounos, B. , and Wheate, R. , 2010: Landsat-based inventory of glaciers in western Canada, 1985–2005. Remote Sensing of Environment, 114: 127–137.
- Bolch, T. , Kulkarni, A. , Kääb, A. , Huggel, C. , Paul, F. , Cogley, J. G. , Frey, H. , Kargel, J. S. , Fujita, K. , Scheel, M. , Bajracharya, S. , and Stoffel, M. , 2012: The state and fate of Himalayan glaciers. Science , 336: 310–314.
- DeBeer, C. M. , and Sharp, M. J. , 2007: Recent changes in glacier area and volume within the southern Canadian Cordillera. Annals of Glaciology , 46: 215–221.
- DeBeer, C. M. , and Sharp, M. J. , 2009: Topographic influences on recent changes of very small glaciers in the Monashee Mountains, British Columbia, Canada. Journal of Glaciology , 55(192): 691–700.
- Fischer, L. , Kääb, A. , Huggel, C. , and Noetzli, J. , 2006: Geology, glacier retreat and permafrost degradation as controlling factors of slope instabilities in a high-mountain rock wall: the Monte Rosa east face. Natural Hazards and Earth System Sciences , 6: 761–772.
- Fujita, K. , 2008: Effect of precipitation seasonality on climatic sensitivity of glacier mass balance. Earth and Planetary Science Letters , 276: 14–19, http://dx.doi.org/10.1016/j.epsl.2008.08.028.
- Fujita, K. , and Ageta, Y. , 2000: Effect of summer accumulation on glacier mass balance on the Tibetan Plateau revealed by mass-balance model. Journal of Glaciology , 46: 244–252.
- Gain, A. K. , Immerzeel, W. W. , Sperna Weiland, F. C. , and Bierkens, M. F. P. , 2011: Impact of climate change on the stream flow of the lower Brahmaputra: trends in high and low flows based on discharge-weighted ensemble modelling. Hydrology and Earth System Sciences , 15(5): 1537–1545, http://dx.doi.org/10.5194/hess-15-1537-2011.
- Grumbine, R. E. , and Xu, J. C. , 2011: Mekong hydropower development. Science , 332: 178–179.
- Haeberli, W. , and Hoelzle, M. , 1995: Application of inventory data for estimating characteristics of and regional climate-change effects on mountain glaciers: a pilot study with the European Alps. Annals of Glaciology , 21: 206–212.
- Haugland, J. E. , and Beatty, S. W. , 2005: Vegetation establishment, succession and microsite frost disturbance on glacier forelands within patterned ground chronosequences. Journal of Biogeography , 32: 145–153.
- He, D. M. , Feng, Y. , Gan, S. , Magee, D. , and You, W. H. , 2006: Transboundary hydrological effects of hydropower dam construction on the Lancang River. Chinese Science Bulletin , 51: 16–24, http://dx.doi.org/10.1007/s11434-006-0016-9.
- He, Y. L. , and Zhang, Y. P. , 2005: Climate change from 1960 to 2000 in the Lancang River valley, China. Mountain Research and Development , 25: 341–348.
- Hodson, A. , Anesio, A. M. , Tranter, M. , Fountain, A. , Osborn, M. , Priscu, J. , Laybourn-Parry, J. , and Sattler, B. , 2008: Glacial ecosystems. Ecological Monographs , 78: 41–67.
- Hoffman, M. J. , Fountain, A. G. , and Achuff, J. M. , 2007: 20th-century variations in area of cirque glaciers and glacierets, Rocky Mountain National Park, Rocky Mountains, Colorado, USA. Annals of Glaciology , 46: 349–354.
- Huggel, C. , 2009: Recent extreme slope failures in glacial environments: effects of thermal perturbation. Quaternary Science Reviews , 28: 1119–1130.
- Immerzeel, W. W. , van Beek, L. P. H. , and Bierkens, M. F. P. , 2010: Climate change will affect the Asian water towers. Science , 328(5984): 1382–1385, http://dx.doi.org/10.1126/science.1183188.
- Jarvis, A. , Reuter, H. I. , Nelson, A. , and Guevara, E. , 2008: Hole-filled seamless SRTM data V4. International Centre for Tropical Agriculture (CIAT), available from http://srtm.csi.cgiar.org.
- Kang, E. , Liu, C. H. , Xie, Z. C. , Li, X. , and Shen, Y. P. , 2009: Assessment of glacier water resources based on the Glacier Inventory of China. Annals of Glaciology , 50: 104–110.
- Kang, S. , Xu, Y. , You, Q. , Flugel, W.-A. , Pepin, N. , and Yao, T. , 2010: Review of climate and cryospheric change in the Tibetan Plateau. Environmental Research Letters , 5: http://dx.doi.org/10.1088/1748-9326/1085/1081/015101.
- Kargel, J. S. , Abrams, M. J. , Bishop, M. P. , Bush, A. , Hamilton, G. , Jiskoot, H. , Kaab, A. , Kieffer, H. H. , Lee, E. M. , Paul, F. , Rau, F. , Raup, B. , Shroder, J. F. , Soltesz, D. , Stainforth, D. , Stearns, L. , and Wessels, R. , 2005: Multispectral imaging contributions to global land ice measurements from space. Remote Sensing of Environment , 99: 187–219.
- Kaser, G. , Großhauser, M. , and Marzeion, B. , 2010: Contribution potential of glaciers to water availability in different climate regimes. PNAS , 107: 20223–20227.
- Leclercq, P. W. , and Oerlemans, J. , 2012: Global and hemispheric temperature reconstruction from glacier length fluctuations. Climate Dynamics , 38: 1065–1079.
- Li, X. , Cheng, G. D. , Jin, H. J. , Kang, E. , Che, T. , Jin, R. , Wu, L. Z. , Nan, Z. T. , Wang, J. , and Shen, Y. P. , 2008: Cryospheric change in China. Global and Planetary Change, 62: 210–218.
- Liu, Q. , Liu, S. , Zhang, Y. , Wang, X. , Zhang, Y. , Guo, W. , and Xu, J. , 2010: Recent shrinkage and hydrological response of Hailuogou glacier, a monsoon temperate glacier on the east slope of Mount Gongga, China. Journal of Glaciology , 56: 215–224.
- Liu, S. , Ding, Y. , Shangguan, D. , Zhang, Y. , Li, J. , Han, H. , Wang, J. , and Xie, C. , 2006: Glacier retreat as a result of climate warming and increased precipitation in the Tarim river basin, northwest China. Annals of Glaciology , 43: 91–96.
- Liu, S. , Yao, X. , Guo, W. , Xu, J. , Shangguan, D. , Wei, J. , Bao, W. , and Wu, L. , 2015: The contemporary glaciers in China based on the Second Chinese Glacier Inventory. Acta Geographica Sinica , 70(1): 3–6, http://dx.doi.org/10.11821/dlxb201501001.
- Lu, A. , Yao, T. , Liu, S. , Ding, L. , and Li, G. , 2002: Glacier change in the Geladandong area of the Tibetan Plateau monitored by remote sensing. Journal of Glaciology and Geocryosphere , 24(5): 559–562 (in Chinese with English abstract).
- MRC [Mekong River Commission] , 2010: State of Basin Report 2010. Vientiane: Mekong River Commission, <http://www.mrcmekong.org/>, accessed 10 September 2014.
- Moseley, R. K. , 2006: Historical landscape change in northwestern Yunnan, China. Mountain Research and Development , 26: 214–219.
- Narama, C. , Kääb, A. , Duishonakunov, M. , and Abdrakhmatov, K. , 2010: Spatial variability of recent glacier area changes in the Tien Shan Mountains, Central Asia, using Corona (∼1970), Landsat (∼2000), and ALOS (∼2007) satellite data. Global and Planetary Change , 71: 42–54.
- Oerlemans, J. , 1994: Quantifying global warming from the retreat of glaciers. Science , 264: 243–245.
- Oerlemans, J. , 2005: Extracting a climate signal from 169 glacier records. Science , 308: 675–677.
- Pathak, J. , 2012: Measuring glacier changes in the Himalayas. Environmental Development , 4: 172–183, http://dx.doi.org/10.1016/j.envdev.2012.09.008.
- Paul, F. , 2002: Changes in glacier area in Tyrol, Austria, between 1969 and 1992 derived from Landsat 5 Thematic Mapper and Austrian Glacier Inventory data. International Journal of Remote Sensing , 23: 787–799.
- Paul, F. , Kääb, A. , Maisch, M. , Kellenberger, T. , and Haeberli, W. , 2004: Rapid disintegration of Alpine glaciers observed with satellite data. Geophysical Research Letters , 31: L21402, http://dx.doi.org/10.1029/2004gl020816.
- Paul, F. , Barry R. G. , Cogley, J. G. , Frey, H. , Haeberli, W. , Ohmura, A. , Ommanney, C. S. L. , Raup, B. , Rivera, A. , and Zemp, M. , 2009: Recommendations for the compilation of glacier inventory data from digital sources. Annals of Glaciology , 50(53): 119–126.
- Qin, D. , and Ding, Y. , 2010: Key issues on cryospheric changes, trends and their impacts. Advance in Climate Change Research , 1: 1–10.
- Radić, V. , and Hock, R. , 2010: Regional and global volumes of glaciers derived from statistical upscaling of glacier inventory data. Journal of Geophysical Research , 115: http://dx.doi.org/10.1029/2009JF001373.
- Ramirez, E. , Francou, B. , Ribstein, P. , Descloitres, M. , Guerin, R. , Mendoza, J. , Gallaire, R. , Pouyaud, B. , and Jordan, E. , 2001: Small glaciers disappearing in the tropical Andes: a case-study in Bolivia: Glaciar Chacaltaya (16 degrees S). Journal of Glaciology , 47(157): 187–194.
- Rasanen, T. A. , Koponen, J. , Lauri, H. , and Kummu, M. , 2012: Downstream hydrological impacts of hydropower development in the Upper Mekong Basin. Water Resources Management , 26: 3495–3513.
- Reuter, H. I. , Nelson, A. , and Jarvis, A. , 2007: An evaluation of void filling interpolation methods for SRTM data. International Journal of Geographical Information Science , 21: 983–1008.
- Richardson, S. D. , and Reynolds, J. M. , 2000: An overview of glacial hazards in the Himalayas. Quaternary International , 65/66: 31–47.
- Schaner, N. , Voisin, N. , Nijssen, B. , and Lettenmaier, D. P. , 2012: The contribution of glacier melt to streamflow. Environmental Research Letters , 7: http://dx.doi.org/10.1088/1748-9326/1087/1083/034029.
- Schmidt, S. , and Nüsser, M. , 2009: Fluctuations of Raikot Glacier during the past 70 years: a case study from the Nanga Parbat massif, northern Pakistan. Journal of Glaciology, 55(194): 949–959.
- Schmidt, S. , and Nüsser, M. , 2012: Changes of high altitude glaciers from 1969 to 2010 in the Trans-Himalayan Kang Yatze Massif, Ladakh, northwest India. Arctic, Antarctic, and Alpine Research , 44(1): 107–121.
- Shangguan, D. , Liu, S. , Ding, Y. , Ding, L. , Xiong, L. , Cai, D. , Li, G. , Lu, A. , Zhang, S. , and Zhang, Y. , 2006: Monitoring the glacier changes in the Muztag Ata and Konggur mountains, east Pamirs, based on Chinese Glacier Inventory and recent satellite imagery. Annals of Glaciology , 43: 79–85.
- Shangguan, D. , Liu, S. Y. , Ding, Y. , Ding, L. , Xu, J. , and Li, J. , 2009: Glacier changes during the last forty years in the Tarim Interior River basin, northwest China. Progress in Natural Science , 19: 727–732.
- Shi, Y. , 2008: Concise Glacier Inventory of China. Shanghai: Shanghai Popular Science Press, 205 pp.
- Sorg, A. , Bolch, T. , Stoffel, M. , Solomina, O. , and Beniston, M. , 2012: Climate change impacts on glaciers and runoff in Tien Shan (Central Asia). Nature Climate Change , 2: 725–731.
- Wang, L. , Xie, Z. , Wang, X. , Liu, S. , Ding, L. , and Shangguan, D. , 2011a: The glacier area changes in the Qangtang Plateau based on the multi-temporal grid method and its sensitivity to climate change. Journal of Mountain Science , 8: 882–893.
- Wang, S. , Zhang, M. , Li, Z. , Wang, F. , Li, H. , Li, Y. , and Huang, X. , 2011b: Response of glacier area variation to climate change in Chinese Tianshan mountains in the past 50 years. Journal of Geographical Sciences, 21(2): 263–273.
- Wei, J. , Liu, S. , Guo, W. , Yao, X. , Xu, J. , Bao, W. , and Jiang, Z. , 2014: Surface-area changes of glaciers in the Tibetan Plateau interior area since the 1970s using recent Landsat images and historical maps. Annals of Glaciology , 55: 213–222.
- Xu, J. , Liu, S. , Zhang, S. , Guo, W. , and Wang, J. , 2013: Recent changes in glacial area and volume on Tuanjiefeng Peak Region of Qilian Mountains, China. PloS One , 8: e70574, http://dx.doi.org/10.1371/journal.pone.0070574.
- Yao, T. , Thompson, L. , Yang, W. , Yu, W. , Gao, Y. , Guo, X. , Yang, X. , Duan, K. , Zhao, H. , and Xu, B. , 2012: Different glacier status with atmospheric circulations in Tibetan Plateau and surroundings. Nature Climate Change , 2: 663–667.