
Abstract
Portable open-path laser (OPL) instruments provide a way to measure real-time, in situ atmospheric methane (CH4) concentrations at a variety of spatial and temporal scales. Our results suggest that OPL instruments may be simple and effective tools for monitoring atmospheric CH4 dynamics near ground-level in Arctic landscapes. We used a CH4 detecting OPL instrument at seven different field sites in southwest Greenland during the summer of 2012 to monitor atmospheric CH4 concentrations in the presence of local CH4 sources and sinks. Measurements with the OPL were conducted for deployments between 0.4 and 40 h over path lengths between 10 and 300 m. These measurements were checked against periodic grab samples analyzed in the field lab using cavity-enhanced absorption spectroscopy. Mean concentrations of atmospheric CH4 measured with the OPL across all field sites ranged from 1.72 (±0.12) to 1.88 (±0.15) ppm by volume (ppmv). The median atmospheric CH4 concentration measured using cavity-enhanced absorption spectroscopy was 1.82 ± 0.04 ppmv. Slightly elevated CH4 concentrations were measured downwind of one lake and in a subglacial cave. OPL measurements of atmospheric CH4 concentrations agreed with results from cavity-enhanced absorption spectroscopy (<3% difference). OPL technology may be a useful tool for extended CH4 monitoring studies in the Arctic and may help in our understanding of atmospheric CH4 concentrations at spatial and temporal scales not accessible to other forms of measurement.
Introduction
Methane (CH4) is an important greenhouse gas. One molecule of CH4 is 20 times more effective in terms of radiative forcing than one molecule of carbon dioxide (CO2 (CitationLashof and Ahuja, 1990). Average global concentrations of atmospheric CH4 have risen from 0.75 ppm by volume (ppmv) during pre-industrial times to 1.82 ppmv in 2012 (CitationCraig and Chou, 1982; CitationDlugokencky et al., 2009; CitationAdushkin and Kudryavtsev, 2010; CitationWMO, 2013). Over the next 100 years, CH4 is expected to contribute 25% of the radiative forcing increase of the atmosphere (CitationIPCC, 2013). Arctic CH4 sources are under greater scrutiny due to the potential for increased CH4 emissions from features such as thawing permafrost, CH4 hydrates, and glacial margins in a warming climate (CitationZimov et al., 1997; CitationWalter et al., 2006; CitationShakhova et al., 2009; CitationWalter Anthony et al., 2012).
The potential for increased CH4 emissions from Arctic environments has resulted in numerous CH4 studies from different Arctic landscapes. Flux chambers have been used to measure CH4 flux at spatial scales of a few square meters or less to study the influences of vegetation, water table, and soil conditions on CH4 flux (CitationTorn and Chapin, 1993; CitationSchimel, 1995; CitationChristensen et al., 2000; CitationTuretsky et al., 2014). Eddy covariance has been used in recent years to study Arctic CH4 fluxes at scales from hectares to km2 (CitationFriborg et al., 2000; CitationHargreaves et al., 2001; CitationWille et al., 2008; CitationSachs et al., 2008; CitationTagesson et al., 2012; CitationKowalska et al., 2013). A major strength of the eddy covariance method is that surface-atmospheric dynamics are not interrupted during the flux measurement. Despite the extensive data sets of atmospheric CH4 concentrations collected during eddy covariance studies, relatively few atmospheric CH4 concentrations from these studies have been published. The atmospheric CH4 concentration measurements that have been published are from locations far from CH4 source areas in the Arctic, but are critical for demonstrating a long-term increase in atmospheric CH4 concentrations globally (CitationAdushkin and Kudryavtsev, 2010; CitationDlugokencky et al., 2011; CitationKirschke et al., 2014).
Open-path laser (OPL) technology has proven to be a successful measurement technique for monitoring CH4 and other biogenic gases downwind of anthropogenic sources such as confined animal feeding operations (CitationHarper et al., 2009, Citation2010), and in known areas of geological CH4 seepage (CitationBaciu et al., 2007). OPL measurement of atmospheric CH4 concentration can provide in situ, real-time CH4 concentration measurements. OPL technology can also measure CH4 concentrations at spatial scales in between those of other measurement systems, providing average atmospheric CH4 concentrations over path lengths from 10 m to 1 km. We deployed a portable OPL to study ground-level atmospheric CH4 in a range of environments along the ice-free margin of southwest Greenland.
As validation of the OPL method, we present results from a series of OPL atmospheric CH4 monitoring studies in the vicinity of local CH4 sources and sinks, complemented by other methods that work on smaller spatial and temporal scales. Study sites were selected for their potential to influence local atmospheric CH4 concentrations. We monitored atmospheric CH4 concentrations near lakes, in subglacial, upland, and urban environments. Micrometeorological variables were also evaluated to examine their influence on CH4 concentrations and included air temperature, atmospheric pressure, wind speed, and wind direction.
Methods
FIELD AREA
The Kangerlussuaq region is characterized by continuous permafrost, a low Arctic continental climate, and about 160 mm yr-1 of precipitation (CitationAnderson et al., 2001, Citation2009; CitationWillemse et al., 2004; CitationAebly and Fritz, 2009). The region is located in the rain shadow of the Sukkertoppen Ridge of the Greenland Ice Sheet, which blocks the southwesterly winds that would otherwise bring higher rainfall to the region (CitationOhmura and Reeh, 1991 ). The 180-km-long ice-free margin of West Greenland contains >20,000 lakes (CitationPerren et al., 2012), and many have fringing wetlands.
Wetlands and lakes are the largest natural source of CH4 to the atmosphere, and Arctic wetlands exhibit increased CH4 emission during the spring and fall due to permafrost freeze/thaw dynamics (CitationMastepanov et al., 2008, Citation2013). The lakes in the region begin to freeze in mid-September and begin to thaw in late May to mid-June. Mean annual air temperature is -6 °C (CitationAnderson et al., 2001), with maximum temperatures of 20 °C in June to early August when mean temperatures exceed 8 °C. The depth of the seasonally active layer, the top layer of soil above the continuous permafrost that thaws annually, ranges from 25 to 70 cm below the surface. The flora is described as an Arctic Mountain Tundra community (CitationUNEP/GRID-Arendal, 2006).
Atmospheric CH4 concentrations in Greenland are routinely measured at Summit Station and currently show an intra-annual variation of about 0.05 ppmv. The highest concentrations occur in January (1.91 ppmv in 2013) and the lowest concentrations occur in July (1.86 ppmv in 2012) (CitationNOAA, 2013). The lower concentrations during summer are due to greater hydroxyl radical production in the troposphere during Arctic summer (CitationIPCC, 2013).
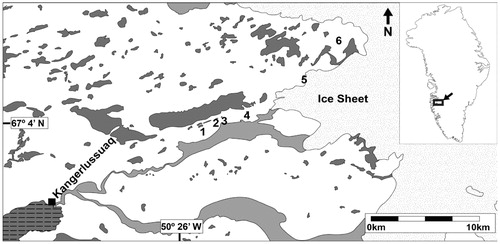
The OPL studies were conducted at seven different locations near Kangerlussuaq, Greenland (67°04.888′N. 050°21.084′W; ) including near-lake (Sites 1, 2, 3, 4), upland (Site 6), subglacial (Site 5), and urban (Kangerlussuaq) environments. The locations were selected to represent a range in potential to serve as local CH4 sources or sinks. Small lakes located in relatively narrow and steep-sided valleys () represented potential CH4 source areas, as small lakes and fringing wetlands can contain elevated CH4 in sediments and water columns that lead to locally elevated flux rates (CitationRepo et al., 2007; CitationBastviken et al., 2008; CitationJuutinen et al., 2009). The narrow valleys reduced boundary layer mixing, improving the chance that the OPL would detect emitted CH4. The subglacial site was selected because of low boundary layer mixing and reports by other investigators of methane emission from this subglacial environment (CitationDieser et al., 2014) (). The upland environment was selected because of the potential for soil methanotrophic communities in drier upland soils to reduce atmospheric CH4 concentrations (CitationChristiansen et al., 2014). Monitoring the atmospheric CH4 concentration in Kangerlussuaq served as a control with respect to remote field sites—the area is dominated by highly compacted soils and paved roads. The compacted soils and paved roads are stable substrates that minimize potential alignment changes in the open-path laser.
FIGURE 1. The approximate site locations of each open-path laser (OPL) time series of the summer 2012 field campaign in relation to the Greenland Ice Sheet and Kangerlussuaq. One of transects was measured in Kangerlussuaq. Other field locations are labeled by numbers. 1 = South Twin Lake, 2 = Potentilla Lake, 3 = Tear Drop Lake, 4 = Epidote Vein Valley (EVV) Lakes, 5 = Subglacial Cave, and 6 = GAP Ridge. All field site names are informal. The dark gray shapes are lakes, the light gray shapes represent glacial meltwater streams, and the dark gray shape with horizontal hatching is the northeast end of Søndre Strømfjord. Numerous smaller lakes are not depicted.
OPEN-PATH LASER
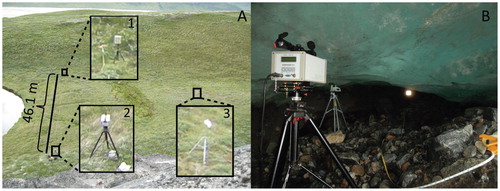
An open-path tunable diode laser for CH4 detection (GasFinder 2.0, Boreal Laser Inc., Spruce Grove, Alberta, Canada, wave-length = 1.653 µm) was used to measure atmospheric CH4 concentrations in the field. The OPL measures the average concentration of CH4 in the air along the path of measurement. A retro-reflector with six corner cube mirrors was used to redirect the laser beam back to the detector. Both the OPL and retro-reflector have tripod mounts for use in portable field settings ().
The response time of the OPL system to increased CH4 concentration was evaluated in the laboratory prior to field deployment. Ambient CH4 concentration in indoor air was monitored for 18 h (data sampling rate = 0.3 to 1 s-1 over a path length of 48 m. CH4 was released into the laboratory to cause artificial spikes at approximately 3:30 p.m., 8:00 p.m,, and 7:00 a.m. (steady-state concentration of each spike ∼3 times ambient). The 8:00 p.m. spike consisted of a triple release of CH4. A small increase in the baseline CH4 concentration was observed at 1:00 a.m. The increase in CH4 concentration observed during the night may have been the result of a natural gas release from a central steam plant located next door to the lab building. The stability of the background CH4 concentration (1.99 ± 0.08 ppmv) was notable and the response to CH4 spikes was less than 15 seconds ().
FIGURE 2. Field deployments of the OPL in (A) open-atmospheric and (B) subglacial settings. The deployment of the system in A is at Site 2. Box 1 is the retroreflector mirror, box 2 is the OPL source/detector, and box 3 is the met station. The path length of measurement is 46.1 m. Note the steep valley walls. In the subglacial setting the OPL source/detector is in the foreground, the met station is the object behind the OPL source/detector and the retroreflector mirror is the bright spot towards the right and middle of photo. The path length between the OPL and the retroreflector is 10.3 m.
In the field, the OPL was set to record average CH4 concentrations every 73 seconds. The duration of OPL time series ranged from 0.42 to 37.17 h, and path lengths ranged from 10.3 to 283.3 m (). The difference in path length reflects the varying width or length of study lakes or reflects the available space for measurement. The orientation of the OPL was generally perpendicular to the prevailing wind direction. A perpendicular orientation for the OPL was used to maximize the possibility of detecting CH4 emitted from potential upwind source areas (CitationHarper et al., 2009, Citation2011). In a few cases, the OPL was oriented parallel to the predominant wind direction in order to increase the path length over a potential CH4 source. The height of the OPL above the ground or water surface was about 1 m. Atmospheric grab samples were collected at the height of the OPL laser beam during active measurement periods by pulling air into a syringe and immediately transferring it into a Tedlar bag. Air samples were analyzed for CH4 concentrations using independent methods to check the accuracy of the OPL system.
FIGURE 3. Laboratory CH4 concentration measured with OPL ([CH4]OPL). The “x” symbols along the x-axis show the times of methane addition.
![FIGURE 3. Laboratory CH4 concentration measured with OPL ([CH4]OPL). The “x” symbols along the x-axis show the times of methane addition.](/cms/asset/ce3a8534-2340-4e4e-97f4-de6f3b9cd3b0/uaar_a_11957861_f0003.jpg)
A portable micrometeorological (met) station (Vantage Vue, Davis Instruments Corp., Hayward, California, U.S.A.) was used to record air temperature, wind speed and direction, atmospheric pressure, and relative humidity at each of the OPL field sites. The met station recorded at 1-minute intervals. The met station was placed in a location that captured the dominant wind flow patterns in the environment and was typically located within 100 m of the OPL (, ).
CH4 concentrations reported by the OPL are affected by changes in ambient temperature and ambient pressure. A temperature correction coefficient was calculated using:
where Tcc is the temperature correction coefficient and T is the measured temperature in °C at the time of the OPL measurement (Boreal Laser, personal communication, 2012). A pressure correction coefficient was calculated using:
where Pcc is the pressure correction coefficient and p is the atmospheric pressure in kPa, and b is a constant equal to 28291.072 as determined by Boreal Laser during their measurements of the OPL's response to differing pressures (Boreal Laser personal communication, 2012). Typically, concentrations of atmospheric CH4 reported in the literature are measured in air samples that have been stripped of their water vapor (CitationDlugokencky et al., 1994). Since OPL measurements were made in open atmosphere, ambient water vapor was unavoidable during the measurement. In order to compare OPL measurements with published values from dry air we corrected OPL measurements for the presence of ambient water vapor using a water vapor correction coefficient Vcc as follows:
where PH2O is the partial pressure of water vapor in the atmosphere in kPa at the time of the OPL measurement. The corrected CH4 concentration, [CH4] i , was calculated by taking the product of the correction coefficients and the OPL reported CH4 concentration, [CH4]m(ppmv) as follows:
TABLE 1 The geographical and temporal characteristics of each open-path laser (OPL) field measurements campaign in the summer of 2012.
Data quality also varied with instrumental parameters in addition to atmospheric conditions. Data collected when light levels were outside of this optimal range recommended by Boreal Laser (<2000 or >12,000 relative light units—the unit of infrared light intensity that is measured by the Boreal Laser) were discarded. The OPL reports an instrument R 2, a measure of how well the absorption spectrum of the atmospheric measurement matches the absorption spectrum of the internal CH4 calibration cell; the reported R 2 values corresponded to a percent uncertainty, a, associated with all [CH4] i . We eliminated all [CH4] i with an a of >2%. Furthermore, if a period of data contained at least 25% of a values >2%, that portion of a time series was also discarded. High frequency variations in the R 2 value corresponded with anomalous CH4 measurements. Data obtained during these oscillations were also discarded from analysis (). The amount of data discarded from each analysis ranged from 0% to 68% ().
LAKE WATER AND SEDIMENT METHANE
Dissolved methane concentrations were measured in water samples collected from lakes within or bordering OPL study sites. Adapting common headspace equilibration methods (CitationMcAuliffe, 1971; CitationFendinger and Adams, 1986), a 500 mL aliquot of lake water from a Kemmerer bottle was transferred to a 1 L Erlenmeyer flask fitted with a three-way luerlock inlet and three-way luerlock valve attached to a stopper. The stopper was affixed to the flask, the valves were closed, and the flask was shaken vigorously for 1 minute to partition the dissolved gases into the headspace. Headspace gases were then displaced into an attached Tedlar bag by injecting water through the three-way valve into the flask. The concentration of dissolved CH4 in the water samples was calculated by adding the CH4 concentration of the headspace gas to the amount of CH4 remaining in the aqueous phase after gas stripping, which was calculated by applying Henry's Law and correcting gas solubility for temperature (CitationLide and Frederikse, 1995).
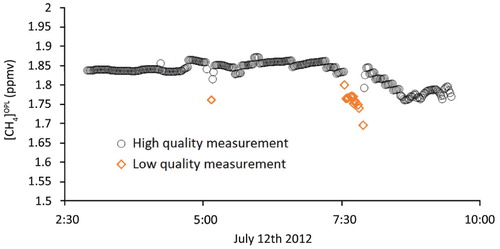
FIGURE 4. OPL time series from Kangerlussuaq (Site 1) showing both high quality (black circles) and low quality data (orange diamonds) obtained with the OPL. Low quality data were removed prior to analysis.
Entrained methane gas in littoral sediments was sampled by stirring the sediments and trapping emitted bubbles in a large plastic funnel outfitted with a gas-tight sampling tube and three-way luerlock valve affixed to the neck. Gas samples were transferred from the funnel into Tedlar bags using a gas-tight syringe. Air samples were generally analyzed within 24 hours at the field laboratory.
SOIL METHANE
CH4 in dry and water-saturated soils within OPL study sites was sampled with a soil gas sampling probe (Retract-A-Tip, AMS, American Falls, Idaho, U.S.A.). Samples were withdrawn from the base of the active layer, just above the permafrost. In dry soils, sampling syringes were flushed three times with their total volume of soil pore gas before the sample was injected into a 1 L Tedlar bag. In water-saturated soils, dissolved methane from soil pore-water was collected by stripping 70 mL of water with 70 mL of air. The syringe was shaken vigorously for 1 minute to extract the dissolved gas. The sample gas was then transferred to a 1 L Tedlar bag. The dissolved concentration of CH4 in the saturated soil samples was calculated using the same procedure for calculating dissolved CH4 in lake water.
ANALYTICAL METHODS
Cavity-Enhanced Absorption Spectrometry
The CH4 concentrations of collected gas samples were analyzed in a laboratory at the Kangerlussuaq International Science Support center using a cavity-enhanced, near-infrared tunable diode laser absorption spectrometry system (Methane Carbon Isotope Analyzer [MCIA]) produced by Los Gatos Research Inc., Mountain View, California (CitationMortazavi et al., 2013). The MCIA uses a laser operating near 1.656 µm and measures the concentration of CH4 in air by summing the 12C and 13C isotopologues of CH4. A pretreatment station removes CO2 and water vapor prior to the gas entering the cavity. The MCIA was calibrated at a concentration of 50 ppmv using a well-characterized laboratory standard.
Gas Chromatography
To determine the validity of CH4 measurements made with the MCIA. a subset of CH4 samples was analyzed on a gas chromatograph. About 50 to 60 mL of gas were transferred to an evacuated 50 mL glass serum vial from Tedlar bags for measurement of CH4 concentration using a Varian 450 gas chromatograph with a flame ionization detector (GC-FID) produced by Agilent Technologies, Palo Alto, California. Samples were carried by helium (15 mL min-1) onto a HayeSep Q column (80/100 mesh, 1.22 m by 0.16 cm).
Peak areas for the GC-FID were converted to concentrations using two linear least squares regression equations, one for samples <100 ppmv and another for samples >100 ppmv. Measured CH4 concentrations by MCIA and GC-FID yielded similar results ([CH4]GC = 1.008[CH4]MCIA - 0.1671, r 2 = 0.998) (). All results reported for discrete field samples will be based upon MCIA analyses conducted in the field laboratory.
FIGURE 5. Methane concentrations measured with the gas chromatograph ([CH4]GC) versus methane concentrations measured with the methane carbon isotope analyzer ([CH4]MCIA). The independent measurements show a high degree of agreement. The inset graph shows the relationship between measurements for concentrations less than 15 ppmv. The linear least squares regression equation that related CH4 concentration measurements from the Methane Carbon Isotope Analyzer (MCIA) to the gas chromatograph with a flame ionization detector (GC-FID) was y = 1.008x - 0.1671 and had an r 2 of 0.998.
![FIGURE 5. Methane concentrations measured with the gas chromatograph ([CH4]GC) versus methane concentrations measured with the methane carbon isotope analyzer ([CH4]MCIA). The independent measurements show a high degree of agreement. The inset graph shows the relationship between measurements for concentrations less than 15 ppmv. The linear least squares regression equation that related CH4 concentration measurements from the Methane Carbon Isotope Analyzer (MCIA) to the gas chromatograph with a flame ionization detector (GC-FID) was y = 1.008x - 0.1671 and had an r 2 of 0.998.](/cms/asset/1d7fe4de-b28a-42ab-a8e1-b02357a41a02/uaar_a_11957861_f0010.jpg)
NUMERICAL ANALYSES
The uncertainty of individual methane concentrations obtained with the OPL, e, was assessed using
where e is the uncertainty associated with the corrected CH4 concentration, [CH4] i , m is the uncertainty in the path length of the OPL, and L is the measured path length in meters. The uncertainty of the path length of the laser was assessed by repeatedly measuring the distance with a measuring tape, a laser range finder, or by determining distance using precise locations in Google Earth. The detection limit for the open-path laser is 1 ppmv times meters divided by L: (ppmv · m) L -1. A longer path length improves the sensitivity of the measurement and minimizes the uncertainty associated with the path length. However, longer path lengths also average the CH4 concentration in a larger parcel of atmosphere, which dilutes the influence of point source CH4 emissions. The average uncertainty, U, of the average CH4 concentration, [CH4], for a time series was calculated by summing the average e and twice the standard deviation of the [CH4] i . We calculated a U of ±0.08 ppmv or ±4% of the [CH4] during the test of the OPL under ideal conditions in the laboratory ().
The met station and the OPL recorded data at different rates. This prevented direct ordered-pairs statistical analysis on the raw data. Therefore, linear interpolation of the met station data was used to create an ordered pair of met station data and OPL data for statistical analysis. In time series analyses, the correlation of a parameter of interest with time may cause a false correlation with another parameter of interest that may or may not be correlated with time. A way to prevent false relationships from obscuring actual relationships in parameters of interest is to examine the rate of change of the parameters with respect to time. Linear regression models were used to assess the relationships between the changes in atmospheric CH4 concentration with respect to time for consecutive measurements (Δ[CH4] i Δt -1) and the change in atmospheric parameters with respect to time for consecutive measurements (temperature, ΔT Δt -1; wind speed, ΔW Δt -1; atmospheric pressure, Δp Δt -1). Wind direction was relatively constant for the individual time series and did not factor into potential changes in CH4 concentrations.
Results
Corrected atmospheric CH4 concentrations, [CH4] i , measured by OPL for all time series in the study ranged from 1.58 (±0.04) to 1.98 (±0.04) ppmv (). Different time series exhibited different amounts of variation in the measured [CH4] i . For example, a time series exhibiting limited variation was obtained on 12 July between two buildings in Kangerlussuaq (). In contrast, we observed large variations in [CH4] i on 20 and 21 July at Site 2 ().
[CH4] i measured by the OPL were generally in agreement with the MCIA measurements of discrete air samples collected at the same time and place (mean difference <3%). The methane concentrations measured with the MCIA showed a high degree of consistency between field sites with a median concentration of 1.82 ± 0.04 ppmv (). The mean of the absolute difference between the OPL and MCIA from all sites was 0.04 ppmv (standard deviation = 0.05 ppmv; n = 10). CH4 concentrations measured by MCIA and OPL were similar at Tear Drop Lake (Site 3, MCIA 1.81 ± 0.04 ppmv vs. OPL 1.82 ± 0.04 ppmv and MCIA 1.80 ± 0.04 ppmv vs. OPL 1.82 ± 0.04 ppmv; ) and the Subglacial Cave (Site 5, MCIA 1.90 ± 0.04 ppmv vs. OPL 1.90 ± 0.08 ppmv; ). OPL time series with large variations in [CH4] i . exhibited larger disagreements with MCIA results (). The average absolute difference between the MCIA and OPL results from 20 and 21 July was 0.10 ppmv. Eliminating low confidence data from these time series yielded a mean absolute difference between the OPL and MCIA of 0.02 ppmv (standard deviation = 0.04 ppmv; n = 7; ).
Changes in CH4 concentrations over the course of a time series showed limited relationships with changes in nearby micrometeorological conditions (all r 2 values < 0.18). The change in corrected CH4 concentration measurements with time (Δ[CH4] i Δt -1) vs. air temperature with time (ΔT Δt -1), and wind speed with time (ΔW Δt -1) was statistically significant in three of the OPL time series performed and was not significant in the others (). The change in corrected CH4 concentration measurements with time (Δ[CH4] i Δt -1) vs. the change in atmospheric pressure with time (Δp Δt -1) was not significant at any site. In the Kangerlussuaq time series, the observed relationship between the CH4 concentration change and the wind speed change was significant (Δ[CH4] i Δt -1 = -0.003 ΔW Δt -1). At Site 4 (Epidote Vein Valley, EVV), the relationships between the CH4 concentration change and the wind speed change and the CH4 concentration change and the temperature change were both significant (Δ[CH4] i Δt -1 = 0.0013 ΔW Δt -1; Δ[CH4] i Δt -1 = 0.0102 ΔT Δt -1).
Average atmospheric CH4 concentrations, [CH4], from all sites ranged from 1.72 to 1.88 ppmv (). These results are consistent with the mean atmospheric CH4 concentration for July 2012 of 1.86 ppmv measured at Summit Station, Greenland (CitationNOAA, 2013). Note that Summit Station is the only source of year-round data for trace gas concentrations in Greenland. The average OPL uncertainty, U, associated with six of the time series was within 0.04 ppmv of the OPL U of ±0.08 ppmv observed under ideal conditions in the laboratory. In the other two studies, the OPL U was twice that observed in the laboratory (±0.15 ppmv or 8% of the [CH4], and ±0.16 ppmv or 9% of the [CH4]). [CH4] from the subglacial cave, upland, and urban environments showed no difference from near-lake and near-wetland environments (two-tailed t-test, t = 0.77, p = 0.48, df = 4).
The CH4 concentration in gas bubbles collected from littoral sediments near OPL transects ranged from 32% to 38% by volume (320,000 to 380,000 ppmv) and occasional ebullition was observed during July sampling periods. All nearby lakes were thermally stratified at the time of the study. CH4 concentrations in the well-mixed surface (epilimnetic) waters of the study lakes ranged from 2.5 to 26 µM (60 to 620 ppmv equivalents). The active layer of upland soils was unsaturated with water, and CH4 concentrations obtained from upland soil gas samples were all below 1.86 ppmv, the mean concentration of tropospheric methane reported at Summit Station for this time of year (CitationNOAA, 2013). Wetland soils were all saturated with water, and CH4 concentrations in the soil-pore water were elevated compared to water in equilibrium with the atmosphere (0.003 µM) and ranged from 0.09 to 3.2 µM (2.2 to 77 ppmv equivalents).
Discussion
Despite evidence of active CH4 production and consumption in close proximity to OPL time-series measurements, strong deviations in atmospheric CH4 concentrations (>2.5 ppmv) were not measured in our OPL time-series studies. Ground-level CH4 concentrations were determined by OPL in southwestern Greenland for a variety of Arctic landscapes using path lengths ranging from 10 to 280 m and time periods between 0.4 and 37 h. All OPL measurements of ground-level methane concentrations were consistent with the mean value of 1.84 ppmv CH4 reported by others for Arctic air samples (CitationDlugokencky et al., 2009; CitationAdushkin and Kudryavtsev, 2010), and with the mean CH4 concentration reported for July 2012 at Summit Station, Greenland, of 1.86 ppmv (CitationNOAA, 2013). Measurements made with OPL also were in good agreement with independent measurements of samples collected on-site and analyzed using cavity-enhanced laser absorption spectrometry and gas chromatography.
FIGURE 6. [CH4] for the following OPL campaigns: (A) Kangerlussuaq, (B) Site 1, (C) Site 2, (D) Site 4, (E) Site 3, (F) Site 6, (G) Site 7, and (H) Site 2. Gaps in the OPL time series are due to losses of data fidelity. Circles represent OPL [CH4]i, squares represent concentrations of methane in independent onsite air samples measured by MCIA (MCIA precision = 0.04 ppmv), and the dashed lines indicate the average of the measurements collected with the OPL. The uncertainty associated with each measurement for each time series is as follows: (A) a = 0.04 ppmv, (B) a = 0.07 ppmv, (C) a = 0.04 ppmv, (D) a = 0.04 ppmv, (E) a = 0.04 ppmv, (F) a = 0.08 ppmv, (G) a = 0.07 ppmv, and (H) a = 0.04 ppmv.
![FIGURE 6. [CH4] for the following OPL campaigns: (A) Kangerlussuaq, (B) Site 1, (C) Site 2, (D) Site 4, (E) Site 3, (F) Site 6, (G) Site 7, and (H) Site 2. Gaps in the OPL time series are due to losses of data fidelity. Circles represent OPL [CH4]i, squares represent concentrations of methane in independent onsite air samples measured by MCIA (MCIA precision = 0.04 ppmv), and the dashed lines indicate the average of the measurements collected with the OPL. The uncertainty associated with each measurement for each time series is as follows: (A) a = 0.04 ppmv, (B) a = 0.07 ppmv, (C) a = 0.04 ppmv, (D) a = 0.04 ppmv, (E) a = 0.04 ppmv, (F) a = 0.08 ppmv, (G) a = 0.07 ppmv, and (H) a = 0.04 ppmv.](/cms/asset/754fd398-574d-41e9-a9eb-415b3b63c145/uaar_a_11957861_f0012.jpg)
Field deployments of the OPL generally yielded comparable uncertainty over the duration of the time-series (U) to its performance under laboratory conditions. However, for some field deployments, the OPL instrument was susceptible to changes in operating conditions. At site 2 on 20 July, the temporal variation in recorded methane concentration caused the U for the time series to increase by a factor of about two compared to optimal performance under laboratory conditions (U = 0.08 ppmv). An important source of variability may be the instability of the tundra soil surface as a platform to conduct open-path optical measurements. Peat-rich tundra soils can deform under load, causing shifts in tripod mounting systems and changes in alignment between the OPL laser/sensor relative to the retro-reflector mirror.
FIGURE 7. Methane concentrations measured with open-path laser ([CH4]i OPL) versus methane concentration measurements made with the MCIA ([CH4]MCIA). Triangles and crosses represent high and low confidence data, respectively. The line represents the expected 1:1 relationship between the two independent measurements.
![FIGURE 7. Methane concentrations measured with open-path laser ([CH4]i OPL) versus methane concentration measurements made with the MCIA ([CH4]MCIA). Triangles and crosses represent high and low confidence data, respectively. The line represents the expected 1:1 relationship between the two independent measurements.](/cms/asset/57bbaeba-4aac-4637-87ef-b595836ab2da/uaar_a_11957861_f0013.jpg)
Variability in micrometeorological conditions such as air temperature, wind speed, and wind direction increased with longer time series, likely contributing to greater variability in OPL stability for the longer time series. Increases in variability of environmental factors may affect the stability of the OPL system in complex ways causing shifts in alignment between the OPL laser/sensor and retro reflector mirror. These small changes in alignment may have added noise to the measurement system above the baseline noise determined for laboratory time series. Longer deployments have a greater probability of being subjected to factors that cause shifts in alignment and consequent drift in OPL response as environmental variables exhibited greater variability in longer time series than in shorter time series (0.50 ≤ r 2 ≤0.96). OPL instability also increased as the duration of the monitoring increased. For example, two of the four time series with U above 0.10 ppmv were from time series of longer duration (Sites 2 and 4, Table 4). It is interesting to note that the long-duration time series from Kangerlussuaq exhibited greater stability than the other long-duration time series, suggesting that deployment of the OPL on less stable peat soil was a large contributor to instrumental noise.
TABLE 2 Summary statistics for linear regression analyses for each OPL time series.
TABLE 3 The average CH4 concentration and error of the average CH4 concentration, U, associated with each OPL time series.
Time series of longer duration also are more likely to capture real variations in local CH4 concentrations. At Site 4 (EVV), we observed a short-term increase in OPL-based CH4 concentration values above 1.90 ppmv that was also observed in independent air samples measured by MCIA (). The highest CH4 concentration measured by the OPL during this time series was 1.98 ppmv and could be related to ebullition of CH4 from the littoral sediments of the nearby EVV lakes.
We evaluate sediment degassing at EVV as a potential factor affecting local ground-level CH4 concentrations by determining the dimensions of a CH4 plume generated from sediment degassing that could account for the elevated [CH4] i observed at this site. The width of a plume of CH4-enriched air that results in the observed [CH4] i can be calculated as follows:
where l is the width of the plume in meters, c is the CH4 concentration of the plume, and C is the atmospheric background CH4 concentration. CH4 concentration in a plume of air downwind of sediment gas ebullition was measured at one of the field sites, and ranged from 2 to 12 ppmv (Christensen, unpublished data. 2013). In order to measure 1.98 ppmv CH4 in air downwind of EVV, 1 would range from 1.1 m to 71 m if we assume plume CH4 concentrations of 12 ppmv to 2 ppmv, respectively, and a background CH4 concentration of 1.84 ppmv. The plume of CH4 that could cause elevated CH4 concentrations at EVV was likely broad and diffuse (71 m × 2 ppmv) given the well-mixed boundary layer. This is also consistent with the CH4 concentrations measured in the independent discrete air samples collected at EVV (1.91 and 1.95 ppmv) during the same time period as the OPL measurements. The calculated plume width seems physically reasonable, and the combination of plume width and plume concentration can generate the observed deviations from the expected background CH4 concentration. These calculations are consistent with the idea that sediment ebullition may have caused the departures from background CH4 concentrations measured at EVV.
Several studies have demonstrated that sediments in shallow areas of lakes are a significant source of CH4 to the atmosphere during summer months (CitationCasper et al., 2000; CitationBastviken et al., 2008; CitationRepo et al., 2007). Yet, average ground-level CH4 concentrations downwind of lakes were not significantly higher than values from sites distant from lakes and wetlands. Based upon the OPL time series collected downwind of lakes in this study, localized emissions appear to be rapidly obscured by boundary-layer mixing (CitationLiss, 1973).
For two of the three OPL time series longer than 8 h, Kangeriussuaq and EVV, we observed significant relationships between CH4 and at least one of the micrometeorological parameters. The other study of longer duration (Site 2, 20–21 July) suffered from high instrumental noise, which probably masked any relationships with micrometeorological parameters. However, the correlations were weak (r2 ≈ 0.01 ), suggesting that micrometeorological effects on ground-level methane concentrations are insufficiently dynamic to be detected by the OPL.
The slightly elevated CH4 concentrations in a subglacial cave suggest a local methane source associated with water within the glacial system. We are cautious about the interpretation of these results given that the [CH4] i of 1.90 ± 0.08 ppmv and the MCIA measurement of 1.90 ± 0.04 ppmv inside the glacial cave are close to the concentrations of 1.82 ± 0.04 ppmv measured by MCIA at our other field sites nearby. However, our interpretation is supported by recent reports of elevated CH4 concentrations and methanogenic Archaea in the discharge waters emanating from this same subglacial cave (CitationDieser et al., 2014). Other studies also report evidence for subglacial methane emissions (CitationWalter Anthony et al., 2012; CitationBoyd et al., 2010; CitationWadham et al., 2008; CitationChristner et al., 2012). Further study of CH4 concentrations and stable isotopic analyses of subglacial air are in progress and should yield valuable insight into CH4 dynamics in the interior and at the base of ice sheets.
Conclusions
A portable OPL system measured accurate ground-level CH4 concentrations over a range of spatial and temporal scales and a variety of landscape types during summer field surveys in southwestern Greenland. Slightly elevated CH4 concentrations were observed in near-lake and subglacial environments. However, no differences from known background CH4 concentrations were observed in upland environments or in Kangeriussuaq. The similarity between our local ground-level CH4 concentrations and those measured for the same period at Summit Station, Greenland, suggests that local sources and sinks of CH4 were not strong enough to cause deviations from regional atmospheric CH4 concentrations on a time scale of days. However, slight positive deviations from regional atmospheric CH4 concentrations were observed downwind of a lake source and in a subglacial setting. We suggest that OPL systems can serve as a robust measurement technology for year-round monitoring of atmospheric CH4 concentrations in the Arctic when mounted to a stable platform and may be able to fill spatial gaps in atmospheric CH4 monitoring strategies.
Acknowledgments
This research was funded by a National Aeronautics and Space Administration, Astrobiology Science and Technology for Exploring Planets Award (no. NNX11AJ01G). S. Cadieux assisted in collecting CH4 data. R. Droppo, J. Marks, the staff of Kangeriussuaq International Science Support, and CH2M Hill provided logistical support during this project. A. Schimmelmann supplied a critical review of the manuscript in its early stages. Instruction in the use of the OPL was given by L. Harper. Boreal Laser Company assisted in OPL data analysis. N. Hvidberg, J. Rebholz, and E. Broemsen contributed invaluable field assistance. Three anonymous reviewers provided feedback that greatly improved the quality of this manuscript.
Related Research Data
References Cited
- Adushkin, V. V. , and Kudryavtsev, V. P. , 2010: Global methane flux into the atmosphere and its seasonal variations. Isvestiya, Physics of the Solid Earth , 46(4): 350–357.
- Aebly, F. A. , and Fritz, S. C. , 2009: Palaeohydrology of Kangerlussuaq (Søndre Strømfjord). West Greenland during the last ∼8000 years. The Holocene , 19(1): 91–104.
- Anderson, N. J. , Harriman, R. , Ryves, D. B. , and Patrick, S. T. , 2001: Dominant factors controlling variability in the ionic composition of west Greenland lakes. Arctic, Antarctic, and Alpine Research , 33(4): 418–425.
- Anderson, N. J. , D'Andrea, W. , and Fritz, S. C. , 2009: Holocene carbon burial by lakes in SW Greenland. Global Change Biology , 15: 2590–2598.
- Baciu, C. , Caracausi, A. , Etiope, G. , and Italiano, F. , 2007: Mud volcanoes and methane seeps in Romania: main features and gas flux. Annals of Geophysics , 50(4): 501–511.
- Bastviken, D. , Cole, J. J. , Pace, M. L. , and Van de Bogert, M. C. , 2008: Fates of methane from different lake habitats: connecting whole-lake budgets and CH4 emissions. Journal of Geophysical Research , 113: G02024, http://dx.doi.org/10.1029/2007JG000608 .
- Boyd, E. S. , Skidmore, M. , Mitchell, A. C. , Bakermans, C. , and Peters, J. W. 2010: Methanogenesis in subglacial sediments. Environmental Microbiology Reports , 2(5): 685–692.
- Casper, P. , Maberly, S. C. , Hall, G. H. , and Finlay, B. J. , 2000: Fluxes of methane and carbon dioxide from a small productive lake to the atmosphere. Biogeochemistry , 49: 1–19.
- Christensen, T. R. , Friborg, T. , Sommerkorn, M. , Kaplan, J. , Illeris, L. , Soegaard, H. , Nordstroem, C. , and Jonasson, C. , 2000: Trace gas exchange in a High-Arctic valley 1. Variations in CO2, and CH4 flux between tundra and vegetation types. Global Biogeochemical Cycles , 14(3):701–713.
- Christiansen, J. R. , Romero, A. J. B. , Jørgensen, N. O. , Jørgensen, C. J. , Glaring, M. A. , Berg, L. K. , and Elberling, B. , 2014: Methane fluxes and the functional groups of methanotrophs and methanogens in a young Arctic landscape on Disko Island, West Greenland. Biogeochemistry : http://dx.doi.org/10.1007/s10533-014-0026-7 .
- Christner, B. C. , Montross, G. G. , and Priscu, J. C. , 2012: Dissolved gases in frozen basal water from the NGRIP borehole: implications for biogeochemical processes beneath the Greenland Ice Sheet. Polar Biology , 35: 1735–1741.
- Craig, H. , and Chou, C. C. , 1982: Methane: the record in the polar ice cores. Geophysical Research Letters , 9(11): 1221–1224.
- Dieser, M. , Broemsen, E. L. J. E. , Cameron, K. A. , King, G. M. , Achberger, A. , Choquette, K. , Hagedorn, B. , Sletten, R. , Junge, K. , and Christner, B. C. , 2014: Molecular and biogeochemical evidence for methane cycling beneath the western margin of the Greenland Ice Sheet. The ISME Journal : http://dx.doi.org/10.1038/ismej.2014.59 .
- Dlugokencky, E. J. , Steele, L. P. , Lang, P. M. , and Masarie, K. A. , 1994: Distribution and growth rate of atmospheric methane. Journal of Geophysical Research , 99(D8): 17021–17043.
- Dlugokencky, E. J. , Bruhwiler, L. , White, J. W. C. , Emmons, L. K. , Novelli, P. C. , Montzka, S. A. , Masarie, K. A. , Lang, P. M. , Crotwell, A. M. , Miller, J. B. , and Gatii, L. V. , 2009: Observational constraints on recent increases in atmospheric CH4 burden. Geophysical Research Letters , 36: L18803. http://dx.doi.org/10.1029/2009GL039780 .
- Dlugokencky, E. J. , Nisbet, E. G. , Fisher, R. , and Lowry, D. , 2011: Global atmospheric methane: budget, changes and dangers. Philosophical Transactions of the Royal Society A , 369: 2058– 2072.
- Fendingen, N. J. , and Adams, D. D. , 1986: A headspace equilibration technique for measurement of dissolved gases in sediment pore water. International Journal of Environmental Analytical Chemistry , 23: 253–265.
- Friborg, T. , Christensen, T. R. , Hansen, B. U. , Nordstroem, C. , and Soegaard, H. , 2000: Trace gas exchange in a High-Arctic valley 2. Landscape CH4 fluxes measured and modeled using eddy correlation data. Global Biogeochemical Cycles , 14(3):715–723.
- Hargreaves, K. J. , Fowler, D. , Pitcairn, C. E. R. , and Aurela, M. , 2001: Annual methane emission from Finnish mires estimated from eddy covariance campaign measurements. Theoretical and Applied Climatology , 70: 203–213.
- Harper, L. A. , Flesch, T. K. , Powell, J. M. , Coblentz, W. K. , Jokela, W. E. , and Martin, N. P. , 2009: Ammonia emissions from dairy production in Wisconsin. Journal of Dairy Science , 92(5): 2326– 2337.
- Harper, L. A. , Flesch, T. K. , Weaver, K. W. , and Wilson, J. D. , 2010: The effect of biofuel production on swine farm methane and ammonia emissions. Journal of Environmental Quality , 39: 1984–1992.
- Harper, L. A. , Denmead, O. T. , and Flesch, T. K. , 2011: Micrometeorological techniques for measurement of enteric greenhouse gas emissions. Animal Feed Science and Technology , 166: 227–239.
- IPCC [Intergovernmental Panel on Climate Change] , 2013: Climate Change 2013: The Physical Science Basis. 5th Assessment Report, Final Draft Report.
- Juutinen, S. , Rantakari, M. , Kortelainen, P. , Huttunen, J. T. , Larmola, T. , Alm, J. , Silvola, J. , and Martikainen, P. J. , 2009: Methane dynamics in different boreal lake types. Biogeosciences , 6: 209–223.
- Kirschke, S. , Bousquet, P. , Ciais, P. , Saunois, M. , Canadell, J. G. , Dlugokencky, E. J. , Bergamaschi, P. , Bergmann, D. , Blake, D. R. , Bruhwiler, L. , Cameron-Smith, P. , Castaldi, S. , Chevallier, F. , Feng, L. , Fraser, A. , Heimann, M. , Hodson, E. L. , Houweling, S. , Josse, B. , Fraser, P. J. , Krummel, P. B. , Lamarque, J. F. , Langenfelds, R. L. , Le Quére, C. , Naik, V. , O'Doherty, S. , Palmer, P. I. , Pison, I. , Plummer, D. , Poulter, B. , Prinn, R G. , Rigby, M. , Ringeval, B. , Santini, M. , Schmidt, M. , Schindell, D. T. , Simpson, I. J. , Spahni, R. , Steele, L. P. , Strode, S. A. , Sudo, K. , Szopa, S. , van der Werf, G. R. , Voulgarakis, A. , van Weele, M. , Williams, J. E. , and Zeng, G. , 2014: Three decades of global methane sources and sinks. Nature Geoscience , http://dx.doi.org/10.1038/NGEO1955 .
- Kowalska, N. , Chojnicki, B. H. , Rinne, J. , Haapanala, S. , Siedlecki, P. , Urabaniak, M. , Juszczak, R. , and Olejnik, J. , 2013: Measurements of methane emission from a temperate wetland by the eddy covariance method. International Agrophysics , 27: 283–290.
- Lashof, D. A. , and Ahuja, D. R. , 1990: Relative contributions of greenhouse gas emissions to global warming. Nature , 344: 529–531.
- Lide, D. R. , and Frederikse, H. P. R. , 1995: CRC Handbook of Chemistry and Physics , 76th ed. Boca Raton, Florida: CRC Press.
- Liss, P. S. , 1973: Process of gas exchange across an air-water interface. Deep-Sea Research , 20: 221–238.
- Mastepanov, M. , Sigsgaard, C. , Dlugokencky, E. J. , Houweling, S. , Ström, L. , Tamstorf, M. P. , and Christensen, T. R. , 2008: Large tundra methane burst during onset of freezing. Nature , 456: 628–630.
- Mastepanov, M. , Sigsgaard, C. , Tagesson, T. , Ström, L. , Tamstorf, M. P. , Lund, M. , and Christensen, T. R. , 2013: Revisiting factors controlling methane emissions from High-Arctic tundra. Biogeosciences , 10: 5139–5158.
- McAuliffe, C. , 1971: Gas chromatographic determination of solutes by multiple phase equilibration. Chemical Technology , 1: 46–51.
- Mortazavi, B. , Wilson, B. J. , Dong, F. , Gupta, M. , and Baer, D. , 2013: Validation and application of cavity-enhanced, near-infrared tunable diode laser absorption spectrometry for measurements of methane carbon isotopes at ambient concentrations. Environmental Science & Technology , 47: 11676–11684.
- NOAA (National Oceanic and Atmospheric Administration) , 2013: Open access online data files for Summit, Greenland (SUM). Earth System Research Laboratory, Global Monitoring Division.
- Ohmura, A. , and Reeh, N. , 1991: New precipitation and accumulation maps for Greenland. Journal of Glaciology , 37(125): 140–148.
- Perren, B. B. , Anderson, N. J. , Douglas, M. S. V. , and Fritz, S. C. , 2012: The influence of temperature, moisture, and eolian activity on Holocene lake development in West Greenland. Journal of Paleolimnology , 48: 223–239.
- Repo, M. E. , Huttunen, J. T. , Naumov, A. V. , Chichulin, A. V. , Lapshina, E. D. , Blueten, W. , and Martikainen, P. J. , 2007: Release of CO2 and CH4 from small wetland lakes in western Siberia. Tellus , 59B: 788–796.
- Sachs, T. , Wille, C. , Boike, J. , and Kutzbach, L. , 2008: Environmental controls on ecosystem-scale CH4 emission from polygonal tundra in the Lena River Delta, Siberia. Journal of Geophysical Research , 113: G00A03, http://dx.doi.org/10.1029/2007JG000505 .
- Schimel, J. P. , 1995: Plant transport and methane production as controls on methane flux from Arctic wet meadow. Biogeochemistry , 28: 183–200.
- Shakhova, N. E. , Sergienko, V. I. , and Semiletov, I. P. , 2009: The contribution of the east Siberian shelf to the modem methane cycle. Herald of the Russian Academy of Sciences , 79(3): 237–246.
- Tagesson, T. , Mölder, M. , Mastepanov, M. , Sigsgaard, C. , Tamstorf, M. P. , Lund, M. , Falk, J. M. , Lindroth, A. , Christensen, T. R. , and Ström, L. , 2012: Land atmosphere exchange of methane from soil thawing to soil freezing in a High-Arctic wet tundra ecosystem. Global Change Biology , 18: 1928–1940, http://dx.doi.org/10.1111/j.1365-2486.2012.06247 .
- Torn, M. S. , and Chapin, F. S. , III, 1993: Environmental and biotic controls over methane flux from Arctic tundra. Chemosphere , 26(1–4): 357–368.
- Turetsky, M. R. , Kotowska, A. , Bubier, J. , Dise, N. B. , Grill, P. , Hornibrook, E. , Minkinnen, K. , Moore, T. R. , Myers-Smith, I.H. , Nykänen, H. , Olefeldt, D. , Rinne, J. , Saarnio, S. , Shurpali, N. , Tuittila, E. , Waddington, J. M. , White, J. R. , Wickland, K. , and Wilmking, M. , 2014: A synthesis of methane emissions from 71 northern, temperate, and subtropical wetlands. Global Change Biology , 20: 2183–2197, http://dx.doi.org/10.1111/gcb.12580 .
- UNEP/GRID-Arendal , 2006: Arctic Vegetation Zones Arendal, Norway. http://www.grida.no/graphicslib/detail/arctic-vegetation-zones_b1d3# (accessed 3 March 2013).
- Wadham, J. L. , Tranter, M. , Tulaczyk, S. , and Sharp, M. , 2008: Subglacial methanogenesis: a potential climatic amplifier? Global Biogeochemical Cycles , 22: GB2021, http://dx.doi.org/10.1029/2007GB002951 .
- Walter, K. M. , Zimov, S. A. , Canton, J. P. , Verbyla, D. , and Chapin, F. S., III , 2006: Methane bubbling from Siberian thaw lakes as a positive feedback to climate warming. Nature , 443: 71–75.
- Walter Anthony, K. M. , Anthony, P. , Grosse, G. , and Chanton, J. , 2012: Geologic methane seeps around boundaries of Arctic permafrost thaw and melting glaciers. Nature Geoscience , 5: 419–426, http://dx.doi.org/10.1038/NGEO1480 .
- Wille, C. , Kutzbach, L. , Sachs, T. , Wagner, D. , and Pfeiffer, E. M. , 2008: Methane emission from Siberian Arctic polygonal tundra: eddy covariance measuring and modeling. Global Change Biology , 14: 1395–1408.
- Willemse, N. W. , van Dam, O. , van Helvoort, P. J. , Dankers, R. , Brommer, M. , Shokker, J. , Valstar, T. E. , and de Wolf, H. , 2004: Physical and chemical limnology of a subsaline athalassic lake in West Greenland. Hydrobiologia , 524: 167–192.
- WMO (World Meteorological Organization) , 2013: The state of greenhouse gases in the atmosphere based on global observations through 2012. WMO Greenhouse Gas Bulletin , 9: 1–4.
- Zimov, S. A. , Voropaev, I. P. , Semiletov, S. P. , Davidov, S. P. , Prosiannikov, S. F. , Chapin, F. S., III , Chapin, M. C. , Trumbore, S. , and Tyler, S. , 1997: North Siberian lakes: a methane source fueled by Pleistocene carbon. Science , 277: 800–802.