
ABSTRCT
Mounting evidence suggests that Earth’s cryosphere harbors diverse and active microbial communities. However, our understanding of microbial composition and diversity in seasonal snowpack of montane ecosystems remains limited. We sequenced the 16S rRNA gene to determine microbial structure (composition and diversity) of snow at two depths (0–15 and 15–30 cm) of a subalpine site in the Southern Sierra Critical Zone Observatory, California, U.S.A. Proteobacteria dominated both depths (~72% of sequences), and this phylum was composed mostly of bacteria within the Rhodospirillales order. Cyanobacteria were almost exclusively present in the upper snow layer, while Actinobacteria and Firmicutes were more abundant in the deep snow layer. Many of the most abundant phylotypes were Acetobacteraceae. Phylotype NCR4874, which comprised 22%–32% of the sequences, was most closely related to the N2-fixing bacteria Asaia siamensis, suggesting that N2 fixation may be an important process within the Sierra snowpack. In addition, just under half (45%) of the numerically dominant phylotypes shared >98% similarity with sequences recovered from other cold environments. Our results suggest that microbial communities of subalpine Sierra Nevada snowpack are diverse, with both snow depths harboring distinct but overlapping communities consisting largely of cold-adapted bacteria.
Introduction
The cryosphere is a vital, but still incompletely understood, portion of Earth that includes sea ice, glaciers, permafrost, and seasonally snow-covered land (CitationMiteva, 2008). Observations suggest that seasonal snowpack, the largest component of the cryosphere covering over a third of the land surface (CitationHinkler et al., 2008), can influence the local climate (CitationCohen and Entekhabi, 2001; CitationDéry and Brown, 2007; CitationQian et al., 2014), underlying soil (CitationBuckeridge and Grogan, 2008; CitationSchimel et al., 2004), and adjacent ecosystems such as streams (CitationBrown et al., 2007). For example, by regulating freeze-thaw events, the extent and duration of snow cover can affect soil microbial community composition (CitationZinger et al., 2009), microbial-mediated soil nitrogen (N) cycling (CitationEdwards et al., 2007), and greenhouse gas exchange with the atmosphere (CitationJones, 1999). However, the degree to which snow acts as an ecosystem itself has only recently been studied, and much of the biology and ecology of snow remains unknown (CitationLarose et al., 2013a).
Despite conditions that include desiccation, freeze-thaw cycling, high solar irradiation, and low nutrient concentrations (CitationMiteva, 2008), snow can harbor diverse and active microbial communities (CitationLopatina et al., 2013; CitationMargesin and Miteva, 2011; CitationMøller et al., 2013) that are deposited from both local and distant sources (CitationChuvochina et al., 2011a; CitationHarding et al., 2011). For example, Chuvochina et al. (Citation2011a) found that microorganisms associated with Saharan dust collect on and likely colonize snow in the Alps. In addition, using a differential staining method, Lopatina et al. (Citation2013) revealed that up to 45.8% of bacteria were viable in snow samples collected from Antarctica. Many of these microorganisms can serve as biological ice nuclei, catalyzing ice formation and snowfall events (CitationChristner et al., 2008)—and are able to cope with the potentially harsh conditions associated with snow by increasing membrane fluidity, synthesizing “antifreeze” proteins, and producing detoxifying enzymes (CitationCasanueva et al., 2010; CitationDe Maayer et al., 2014; CitationMaccario et al., 2014; CitationRothschild and Mancinelli, 2001).
Within snowpack, changes in physicochemical properties (e.g., ultraviolet [UV] light and snow density) with depth may stimulate postdepositional selection and subsequent vertical stratification of microbial communities (CitationMøller et al., 2013; CitationSeok et al., 2009; CitationXiang et al., 2009a, Citation2009b). For example, Møller et al. (Citation2013) found that Cyanobacteria in High Arctic snow were confined to the top 90 cm of snow and speculated that the absence of this phylum from deeper snow layers was due to reduced light availability. Xiang et al. (Citation2009a) reported similar findings from glacial snow in the Tianshan Mountains. However, the question of how microorganisms respond to burial in subalpine montane snowpack remains relatively unexplored, as much of our current understanding of the abundance, viability, and composition of microbial communities within snow comes from studies of polar environments (CitationHarding et al., 2011; CitationHell et al., 2013; CitationLarose et al., 2010; CitationLopatina et al., 2013; CitationMaccario et al., 2014; CitationMøller et al., 2013).
Montane snowpack differs significantly from high latitude and glacial snowpack because (sub)alpine environments experience a comparatively milder climate, receive more direct solar radiation, and the snowpack itself is more ephemeral. In addition, montane environments likely receive microbial inputs from different source locations. The few available studies of montane snow-associated microbial communities have revealed microbial densities ranging from 680 to 720,000 cells mL-1 snow (CitationBauer et al., 2002; CitationLazzaro et al., 2015; CitationLiu et al., 2009), with a predominance of bacteria in the Proteobacteria and Actinobacteria phyla (CitationChuvochina et al., 2011b; CitationLiu et al., 2007; CitationMeola et al., 2015). In the Sierra Nevada, California, bacterial abundances were found to range from 9.8 × 10⁴ to 5.5 × 10⁵ cells mL-1 in white (no algae) and red (algae present) snow areas, respectively (CitationThomas and Duval, 1995); however, bacterial community composition was not assessed. Segawa et al. (Citation2005) further demonstrated the ability of psychrophilic and psychrotrophic bacterial species (e.g., Clostridium psychrophilum) to grow in a montane snow environment, confirming that snow can be a viable habitat for microbial life, and not simply a reservoir of deposited, dormant cells.
Because microbial communities within the cryosphere may alter surface albedo (CitationThomas and Duval, 1995; CitationYallop et al., 2012) and regulate nutrient cycling (CitationAmoroso et al., 2010; CitationHodson et al., 2008), characterizing snow-associated microbial communities of subalpine systems is important for understanding current and future dynamics of snow in these montane ecosystems. In particular, measuring microbial richness and composition of subalpine snowpack can provide information on the role of snow as a vector for microbial dispersal, the role of ephemeral snow in the maintenance of soil microbial diversity, and the potential for microbial-mediated nutrient transformations to occur in situ (CitationMaccario et al., 2014).
The overall objective of this exploratory study was to assess microbial structure (composition and diversity) in different layers (0–15 and 15–30 cm depth) of subalpine snow in the Sierra Nevada, California, U.S.A. Using a next-generation sequencing approach (Illumina MiSeq), we expected to find a diverse microbial community composed, in part, of stress-tolerant and putative cold-adapted taxa. We further expected to find shifts in composition by snow depth that would be indicative of differences in predepositional microbial dispersal or postdepositional selection.
Methods
Site Characteristics and Sample Collection
Samples were collected from Shorthair Creek (37.06698°N, 118.98711°W), the highest elevation site of the Southern Sierra Critical Zone Observatory (; http://criticalzone.org/sierra/). This subalpine site is located at 2700 m elevation along the western slope of the Sierra Nevada and is composed primarily of lodgepole pine (Pinus contorta) and western white pine (Pinus monticola). Annual temperature ranges from -1.9 °C (mean minimum) to 10.2 °C (mean maximum), and mean annual precipitation is 1078 mm y-1 (CitationGoulden et al., 2012).
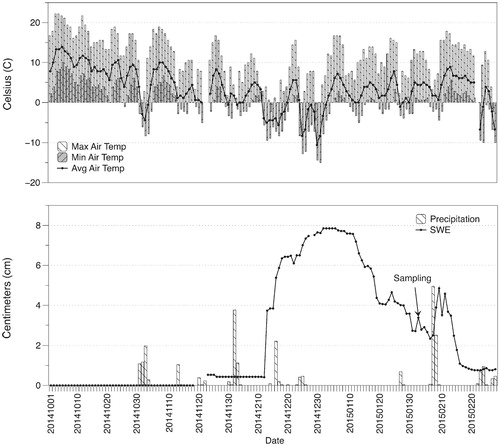
On 12 October 2014, prior to snowfall, a 3 × 2.7 m Tyvek tarp (DuPont HomeWrap, E. I. du Pont de Nemours and Company, Wilmington, Delaware, U.S.A.) was secured to the ground with polyvinyl chloride (PVC) pipes and sandbags, and marked with t-posts in order to provide an area where snow-deposited microbial communities would not be influenced by local soil. On 2 February 2015, we collected snow samples from the snowpack that had accumulated on the tarp-covered area. The snowpack was approximately 30 cm deep and had accumulated primarily from a series of small snow events in late 2014 followed by a period of interstorm snow ripening (). The only snow event within the month preceding our sampling campaign resulted in less than 1 cm of precipitation. We therefore sampled at two different depths that largely reflected different postdeposition ripening rather than different snow events: A single sample (13 × 13 cm in area) was taken from the upper layer (0–15 cm depth) and underlying deeper layer of snow (15–30 cm depth; total snow depth was 30 cm). After digging a pit adjacent to the collection site, snow was removed using a saw and placed in a 5.4 L sterile Whirlpak bag (Nasco Inc., Salida, California, U.S.A.). To minimize the potential for contamination, we sterilized all tools with 10% bleach followed by 70% ethanol and wore Tyvek body suits (DuPont Coveralls) and latex gloves during sampling. The snow samples were placed on dry ice while transported back to the laboratory, where they were stored at -20 °C until analysis.
Sample Processing
We left the two samples to melt in a cold room at 4 °C prior to filtering them through sterile 0.2 μm filters (47-mm diameter; Pall Supor 200 Sterile Grid filters, Pall Corporation, Port Washington, New York, U.S.A.) in an acid-wash sterilized vacuum filtration unit. Once filtration was complete, filters were stored in sterile Whirlpak bags at -20 °C until further analysis. To test for contamination, we created a negative control by filtering 1 L sterile Milli-Q water through a blank filter, and processed that control alongside the snow samples. After the samples were extracted and amplified, the blank filter was free of DNA, indicating that contamination did not occur during processing.
We extracted microbial DNA from the filters using a MO BIO PowerWater DNA Isolation Kit (MO BIO Laboratories, Carlsbad, California, U.S.A.) following the manufacturer's instructions. The extracted DNA was then quantified using a NanoDrop 2000 (Thermo Fisher Scientific, Wilmington, Delaware, U.S.A.) and amplified in duplicate using primers targeting the V3-V4 region of the 16S rRNA gene (S-D-Bact-0341-b-S-17 and S-D-Bact-0785-a-A-21; CitationKlindworth et al., 2013). We conducted polymerase chain reaction (PCR) by combining 2.5 μL DNA template, 5 μL each of 1 μM forward and reverse primers, and 12.5 μL KAPA HiFi HotStart ReadyMix (KAPA Biosystems, Wilmington, Massachusetts, U.S.A.), totaling a 25 μL reaction. Thermocycler conditions were as follows: 95 °C for 3 minutes, followed by 25 cycles of 95 °C for 30 seconds, 55 °C for 30 seconds, 72 °C for 30 seconds, followed by an extension step for 5 minutes at 72 °C. After amplification, we combined and purified the duplicate PCR products using Agencourt AMPure XP Beads (Beckman Coulter Genomics, Danvers, Massachusetts, U.S.A.). A second round of PCR was subsequently conducted to attach dual indices and sequencing adapters to each sample using the Nextera XT Index Kit (Illumina, San Diego, California, U.S.A.). Briefly, 5 μL DNA, 5 μL each of 1 μM forward and reverse index primers, 25 μL KAPA HiFi HotStart ReadyMix, and 10 μL PCR grade water were combined to create a 50 μL mixture. Thermocycler conditions were as follows: 95 °C for 3 minutes, followed by 8 cycles of 95 °C for 30 seconds, 55 °C for 30 seconds, 72 °C for 30 seconds, followed by an extension step for 5 minutes at 72 °C. We then conducted a second purification step (same as described above) on the indexed amplicons and quantified the products using the Quant-iT PicoGreen dsDNA assay kit (Life Technologies, Grand Island, New York, U.S.A.). As a final step, we pooled the samples together in equimolar concentrations with samples from another project and sequenced them using an Illumina MiSeq instrument at the University of California Riverside (UCR) Genomics Core Facility.
FIGURE 1. Map showing location of Shorthair Creek study site (37.06698°N, 118.98711°W) along an elevation transect through the Sierra Nevada, California. (left) The elevation of the site, at ~2.7 km, puts it well within the limits of seasonal snowpack, and thus provides an opportunity to investigate the composition and diversity of microorganisms deposited on the ecosystem by snow.
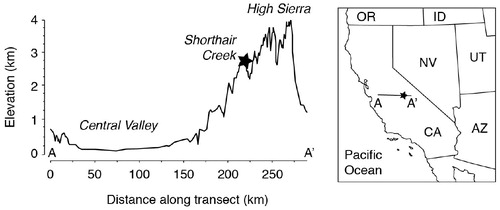
FIGURE 2. Maximum, minimum, and average daily air temperature (°C), and (bottom) daily precipitation and snow water equivalent (SWE) in centimeters from 1 October 2014 through 28 February 2015. Data were obtained from the Department of Water Resources California Data Exchange Center from two locations near Shorthair Creek along the western slope of the Sierra Nevada. Temperature and SWE data were obtained from West Woodchuck Meadow (2773 m elevation; 37.030°N, 118.918°W); precipitation data were obtained from the Dinkey Forest Service site (1728 m elevation; 37.066°N, 119.039°W). Samples were collected on 2 February 2015, which is highlighted on the bottom portion of the figure with an arrow.
Sequence Analysis
We obtained the sequences already demultiplexed from the UCR Genomics Core Facility and subsequently processed them using Quantitative Insights into Microbial Ecology (QIIME; CitationCaporaso et al., 2010). After we joined the forward and reverse reads (allowing for 20% maximum difference within the region of overlap), we used default parameters to conduct quality control. Specifically, reads were excluded if less than 75% of the read length was consecutive high-quality base calls, if there were more than three consecutive low-quality base calls, if a Phred score was below three, if the length was less than 75 bases, or if one or more ambiguous calls were present (CitationBokulich et al., 2013). We picked operational taxonomic units (OTU or phylotype) at 97% similarity using open reference UCLUST against the 13_8 release of the Greengenes database. Reads that did not match any sequences in the database were clustered de novo. Raw sequences have been deposited to the NCBI Sequence Read Archive under the study accession number SRP068775.
In QIIME, we removed chloroplast and unassigned sequences prior to subsampling to an even depth of 24,678 reads. Singletons were not removed. Using these rarefied OTU tables, we then estimated relative taxon abundances and ran alpha diversity analyses for each depth. Alpha diversity was measured using a variety of complementary methods, including Chao1 richness, Shannon diversity index, Simpson's diversity, and Faith's phylogenetic diversity (CitationFaith, 1992).
Organisms closely related to numerically dominant phylotypes (>200 sequences) were identified using the NCBI Basic Local Alignment Search Tool (BLASTn) and EzTaxon (CitationJohnson et al., 2008; CitationKim et al., 2012a). The EzTaxon server uses BLASTn and a pair-wise sequence alignment algorithm to identify both validly published prokaryotic names and representatives of uncultured phylotypes. In our study, we used the EzTaxon server to filter for closely related, validly published (isolated) prokaryotic names, providing information on the closest related microorganism. We used BLASTn to identify closely related uncultured/environmental sample sequences, providing insight into the environments that harbor similar phylotypes.
Results
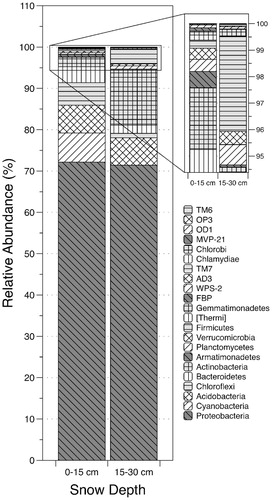
Sequencing resulted in 24,678 reads for the shallow snow layer (0–15 cm) and 49,336 reads for the deep snow layer (15–30 cm). At an even sequencing depth of 24,678 reads, our efforts yielded 1,173 and 1,861 OTUs (phylotypes) from the shallow and deep snow layers, respectively (). These phylotypes, 674 of which were shared between the two snow depths (i.e., recovered from both depths; data not shown), belonged to 22 phyla, 67 classes, 123 orders, 223 families, and 373 genera. Both samples were dominated by Proteobacteria, which accounted for approximately 72% of the sequences (; Supplementary ). Acidobacteria were less prevalent, but the relative abundance of this phylum was also similar across both samples (~7%). In contrast, the relative abundances of Cyanobacteria, Chloroflexi, Firmicutes, and Actinobacteria varied by snow depth (). Cyanobacteria accounted for 7.0% of sequences in the shallow snow layer, while only 0.01% of sequences were Cyanobacteria in the deep snow layer. We observed a similar trend with Chloroflexi (5.5% and 1.1% in shallow and deep snow layers, respectively). In contrast, the relative abundance of Actinobacteria was greater in the deep snow layer (13.5%) than the shallow snow layer (2.3%), as was the relative abundance of Firmicutes (0.3% and 3.6% in shallow and deep snow layers, respectively).
TABLE 1 Values of alpha diversity by snow depth (0–15 cm and 15–30 cm) from the Shorthair Creek study site.
FIGURE 3. Relative abundances of the 22 phyla recovered between both snow depths (0–15 and 15–30 cm) from the Shorthair Creek study site. Both graph and legend share the same order, sequential from top to bottom. Proteobacteria dominated both samples, while Cyanobacteria were more abundant in the upper snow layer and Actinobacteria and Firmicutes were more abundant in the deeper snow layer.
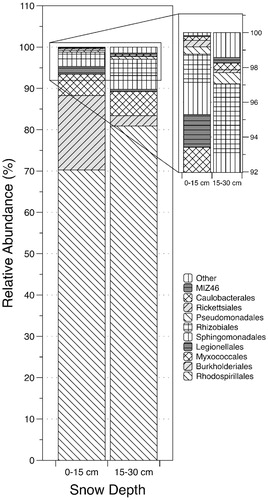
Within Proteobacteria, the order Rhodospirillales was the most prevalent (; 70.3%–80.9% of sequences). Of the Rhodospirillales, 99% were Acetobacteraceae. The order Myxococcales was the next most prevalent, accounting for 5.2% (shallow snow) and 5.9% (deep snow) of sequences within this phylum. While Burkholderiales made up 18.0% of Proteobacteria sequences in the upper snow layer, this order made up only 2.5% in the deep snow layer. Twenty-six other orders of the Proteobacteria were also present, including Legionellales, Sphingomaonadales, Rhizobiales, and Pseudomonadales (; Supplementary Table 2).
FIGURE 4. Relative abundances of each order within the Proteobacteria phylum recovered from each snow depth (0–15 and 15–30 cm) at the Shorthair Creek site. Both graph and legend share the same order, sequential from top to bottom. Rhodospirillales accounted for the majority of Proteobacteria sequences in both samples. “Other” indicates the combined relative sequence abundance of the 17 additional, rare taxonomic Proteobacteria orders.
We detected a number of genera that are known to tolerate and thrive in conditions within the cryosphere. These genera included the following: Methylobacterium (0.05% and 0.32% in shallow and deep layers, respectively), Geodermatophilus (0% and 2.24% in shallow and deep layers, respectively), and Hymenobacter (2.03% and 0.55% in shallow and deep layers, respectively). Janthinobacterium (CitationKim et al., 2012b; CitationSegawa et al., 2005), a genus that contains psychrotolerant bacteria, was also present in both samples (0.63% and 0.15% in shallow and deep layers, respectively).
Of the most abundant phylotypes (29 phylotypes identified as those that occurred more than 200 times total across both samples), 11 were from the Acetobacteraceae family and 25 were shared between the shallow and deep snow layers (). The most predominant phylotype across both snow depths (phylotype NCR4874, 22%–32% of sequences) was most closely related (96.8%) to Asaia siamensis, a dinitrogen (N2) fixing Acetobacteraceae. The top uncultured BLASTn hit for this phylotype was with a human-associated bacterium recovered by Kong et al. (Citation2012), but it also shared 98% similarity with sequences recovered from cold environments such as snow in the Alps, glacial ice worms, and Arctic lichens (data not shown). While it is therefore possible that this phylotype (NCR4874) was a contaminant, this possibility is unlikely given that the blank control consistently tested negative for contaminant DNA. Thirteen additional abundant phylotypes matched at ≥⃒97% to sequences found in other cold environments. For example, phylotype NCR5142, which was common in both snow layers, shared 99% similarity with a sequence previously identified from peat soil in the Arctic. However, not all dominant phylotypes occurred in both snow layers (). Two phylotypes that were common in the shallow snow layer but were not identified in the deep snow layer belonged to Cyanobacteria (phylotypes 818835 and 558201) and one belonged to Chloroflexi (phylotype NCR6630). Many phylotypes that occurred more frequently in the bottom snow layer than the top were Actinobacteria, one of which shared >99% similarity with Geodermatophilus siccatus (phylotype 453616) and another with Galbitalea soli (phylotype 279325).
In addition to harboring differences in microbial community composition, the snow samples also differed in alpha diversity. The shallow snow layer had fewer observed OTUs than the deep snow layer (1173 and 1839 OTUs, respectively). The same was true for Chao1 richness estimator, Faith's phylogenetic diversity, and Shannon diversity, while Simpson's diversity was more equitable across snow depth ().
Discussion
Mounting evidence suggests that the cryosphere harbors diverse and active microbial communities (CitationMargesin and Miteva, 2011). However, our understanding of how microorganisms vary by snow depth in seasonally dynamic montane ecosystems remains limited (CitationMøller et al., 2013). We used high throughput sequencing to determine microbial community composition from two depths in a Sierra Nevada subalpine site (California, U.S.A.) and found that community membership between the shallow and deep snow layers was distinct but overlapping. While lack of replication limits our ability to generalize this finding, it suggests that vertical spatial variation in microbial community composition may occur within ephemeral snowpack just as it does within other terrestrial and aquatic environments (CitationEilers et al., 2012; CitationHumayoun et al., 2003).
Proteobacteria dominated both snow depths, which was expected given that this phylum is widespread in cold environments and has been found to predominate snowpack in Greenland (CitationMøller et al., 2013), Svalbard (CitationAmato et al., 2007), Antarctica (CitationLopatina et al., 2013), Alaska (CitationSheik et al., 2015), and Mount Everest (CitationLiu et al., 2007). In our study, the Rhodospirillales order (α-Proteobacteria) comprised more than 70% of the Proteobacteria sequences, and 11 of the most abundant phylotypes were Acetobacteraceae (acetic acid bacteria, a family of Rhodospirillales). Many Acetobacteraceae are common symbionts of insects (CitationCrotti et al., 2010), and studies have detected this family in eolian dust samples (CitationBowers et al., 2012); these two dispersal mechanisms could have contributed to the high rates of Acetobacteraceae colonization at our site (CitationGilbert, 1980). Another possibility is that these airborne microorganisms acted as ice nuclei for the snow itself (CitationChristner et al., 2008).
The high relative abundance of Acetobacteraceae in both snow depths not only illustrates their ability to withstand the relatively harsh conditions of snow (i.e., low temperatures, physical stress from freeze-thawing cycles, etc.), but also suggests that they are likely ecologically and functionally significant within this environment. Species in this family perform a number of critical functions, including N2 fixation and phosphate solubilization (CitationLoganathan, 2004), and many are important endophytes (CitationSaravanan et al., 2008). The most abundant phylotype (phylotype NCR4874) within both samples shared 96.8% similarity with A. siamensis, an aerobic Acetobacteraceae that performs N2 fixation (CitationKatsura et al., 2001; CitationSamaddar et al., 2011). While N2 fixation appears to be a relatively unconserved microbial trait (genus to species level; CitationMartiny et al., 2015), the prevalence of this phylotype and its similarity with A. siamensis suggests that there may be the genetic potential for N2 fixation in this environment.
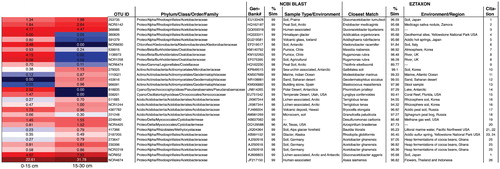
FIGURE 5. Heatmap showing the numerically dominant phylotypes (>200 sequences) across both snow depths (0–15 and 15–30 cm) and their relative abundances as percentages of all 16S rRNA sequences recovered within their respective depth. The color spectrum ranges from dark blue (the lowest relative abundance) to dark red (the highest relative abundance). OTU ID numbers are also listed (NCR = new.cleanup.referenceOTU as designated during the OTU picking process). Also included are the (1) taxonomic assignments to the family level, (2) the closest related NCBI BLAST hit and the environment from which it was recovered; and (3) the closest related described (isolated) microorganism, environment from which it was isolated, and the associated reference. OTU NRC4874, an Acetobacteraceae, was the most abundant phylotype across both samples, accounting for 22.61% and 31.78% of sequences in the upper and deeper snow layers, respectively. % sim = % sequence similarity, Proteo = Proteobacteria; Actino = Actinobacteria; Acido = Acidobacteria. Alpha, Beta, Delta, Gamma denote classes of Proteobacteria. Full citations can be found in the Appendix.
Previous studies suggested that snow-associated microbial communities are largely derived from eolian movement and deposition of microorganisms (CitationBowers et al., 2012; CitationChuvochina et al., 2011b). Windborne dust is one primary vector of such movement, although aerosolized microorganisms do not necessarily require association with dust particles. The composition of eolian microbial communities is influenced by provenance (source location) and temporal trends in microbial composition of the source material (CitationBowers et al., 2012, Citation2011). In the Sierra Nevada, westerly winds move air from Asia across the Pacific Ocean; accordingly, dust inputs to the Sierra Nevada originate from a combination of local (e.g., Central Valley, California, U.S.A.) and distant (e.g., Asia) sources (CitationKellogg and Griffin, 2006; CitationVicars and Sickman, 2011), depending on the elevation and time of year (Aciego et al., unpublished). While it is possible that the microorganisms observed in our study are cosmopolitan (i.e., they are found everywhere), mounting evidence suggests that many microorganisms display biogeographic patterns (CitationMartiny et al., 2006; CitationPapke and Ward, 2004). Hence, the presence of particular phylotypes within the snow can provide insights into which regions or sources are contributing to microbial colonization over time (CitationBowers et al., 2012). For example, at the Shorthair Creek site, one of the most abundant phylotypes was closely related (>99%) to a sequence previously recovered from the Sahara (Citationdel Carmen Montero-Calasanz et al., 2013), a desert that is one of the greatest sources of dust globally (CitationGoudie and Middleton, 2001). Chuvochina et al. (Citation2011a) also demonstrated that Saharan dust significantly influenced microbial composition of snowpack in the Alps. Other abundant phylotypes shared >98.5% similarity with microorganisms isolated from the air (phylotype 539915) and soil (phylotype 279325) in Korea, which is a known source of dust for the western United States (CitationKellogg and Griffin, 2006). The presence of these phylotypes suggests that part of the microbial community in the subalpine Sierra Nevada snowpack is derived from distant desert sources (CitationGriffin, 2007).
While differences in the relative abundance of microbial groups between snow depths may reflect changes in the place of origin, temporal trends in microbial composition of the source material, or redistribution of microbial communities within snowpack (CitationLazzaro et al., 2015), they may also result from postdepositional environmental selection (CitationXiang et al., 2009b). In our study, both the upper and lower snow layers likely were deposited from similar sources (Pacific storm events from Asia), but postdepositional time differed; therefore, it is conceivable that postdepositional selection and/or redistribution within the snowpack played a larger role than place of origin in developing vertical stratification. For instance, the elevated relative abundance of phylotypes 1110021 and 453616 within the deeper layer of snow may reflect the ability of Geodermaphilaceae to tolerate stressful conditions (CitationIvanova et al., 2010). Indeed, phylotype 1110021 shared 99.3% similarity with Modestobacter marinus, an isolate that has often been recovered from harsh environments such as deserts and is able to withstand high gamma radiation, UV levels, and desiccation typical of snowpack conditions (CitationGtari et al., 2012). Similar tolerance for extended periods of extreme desiccation may explain the higher abundance of Actinobacteria and Firmicutes in the deeper snow layer (CitationConnon et al., 2007), and may also account for the commonness of these phyla in other snow-dominated environments (CitationLiu et al., 2007). It is also possible that environmental conditions selected for Cyanobacteria (a phylum of photosynthetic and N2-fixing bacteria) in the shallow snow layer but not the deeper layer, thereby shaping the vertical distribution of this phylum within the snowpack. A similar inverse relationship between the abundance of Cyanobacteria and snow depth was reported by Møller et al. (Citation2013), which led those authors to conclude that light intensity controls the spatial pattern of these photosynthetic bacteria.
Thirteen of the dominant phylotypes matched with >98% similarity to sequences previously recovered from cold environments such as glaciers, polar deserts, and the arctic tundra. Phylotype NCR652, for example, was closely related (99%) to a lichen-associated microorganism found within the polar regions. In addition, we recovered four lesser abundant genera (Methylobacterium, Geodermatophilus, Hymenobacter, and Janthinobacterium) that are known to survive in the cryosphere (CitationChuvochina et al., 2011a; CitationKim et al., 2012b; CitationRainey et al., 2005). The first three genera can tolerate high doses of ionizing radiation (CitationChuvochina et al., 2011b; CitationRainey et al., 2005), while the fourth is a genus that contains psychrotolerant bacteria (CitationSegawa et al., 2005). Burkholderia, a genus comprised of bacteria found in polar environments (CitationLee et al., 2014) and that dominate some subalpine soils (CitationLipson et al., 2008), was also found in the snowpack, albeit at a low relative abundance (0.15%–0.45% of sequences in upper and lower layers of snow, respectively). The detection of these sequences within our study and others confirms prior findings that cold-adapted microorganisms can disperse globally, and that many are able to survive and persist in geographically diverse cold environments.
With only two samples collected (and only one per depth), lack of replication is a clear limitation of this study. However, our exploratory approach and results can be used to develop testable hypotheses and highlight several research questions that warrant further investigation in the California Sierra Nevada and other (sub)alpine ecosystems. Some notable questions include: Is there genetic potential for N2 fixation in ephemeral montane snowpack, similar to what has been found in the Arctic (CitationTelling et al., 2011; CitationLarose et al., 2013b)? And, if there is genetic potential, does this result in ecologically meaningful rates of in situ N2 fixation? Addressing these and other questions regarding the processes that govern vertical variability in microbial composition will provide critical information on microbial structure and function in this potentially important, but understudied, component of montane ecosystems.
Appendix
TABLE A1 (A) Relative abundances at the phyla level for each snow depth. (B) Richness (number of operational taxonomic units [OTUs]) of the top 10 most abundant phyla.
TABLE A2 Relative abundances of each order comprising the Proteobacteria for each snow depth
TABLE A3 References for .
Table
Acknowledgments
We would like to thank Erin Stacy and Patrick Womble for their help with sample collection. We would also like to thank two anonymous reviewers for providing constructive comments. This research is part of the Southern Sierra Critical Zone Observatory, which is funded by the National Science Foundation (EAR 1331939). Sample collection was funded in part by the National Science Foundation Rapid Response Research (RAPID) program (1449197), and partial funding was provided by a Packard Fellowship to SMA.
References Cited
- Amato, P. , Hennebelle, R. , Magand, O. , Sancelme, M. , Delort, A.-M. , Barbante, C. , Boutron, C. , and Ferrari, C. , 2007: Bacterial characterization of the snow cover at Spitzberg, Svalbard. FEMS Microbiology Ecology , 59: 255–264. doi http://dx.doi.org/10.1111/j.1574-6941.2006.00198.x.
- Amoroso, A. , Domine, F. , Esposito, G. , Morin, S. , Savarino, J. , Nardino, M. , Montagnoli, M. , Bonneville, J.-M. , Clement, J.-C. , Ianniello, A. , and Beine, H. J. , 2010: Microorganisms in Dry Polar Snow are involved in the exchanges of reactive nitrogen species with the atmosphere. Environmental Science & Technology , 44: 714–719. doi http://dx.doi.org/10.1021/es9027309.
- Bauer, H. , Kasper-Giebl, A. , Löflund, M. , Giebl, H. , Hitzenberger, R. , Zibuschka, F. , and Puxbaum, H. , 2002: The contribution of bacteria and fungal spores to the organic carbon content of cloud water, precipitation and aerosols. Atmospheric Research, 2nd International Conference on Fog and Fog Collection , 64: 109–119. doi http://dx.doi.org/10.1016/S0169-8095(02)00084-4.
- Bokulich, N. A. , Subramanian, S. , Faith, J. J. , Gevers, D. , Gordon, J. I. , Knight, R. , Mills, D. A. , and Caporaso, J. G. , 2013: Quality-filtering vastly improves diversity estimates from Illumina amplicon sequencing. Nature Methods , 10: 57–59. doi http://dx.doi.org/10.1038/nmeth.2276.
- Bowers, R. M. , Sullivan, A. P. , Costello, E. K. , Collett, J. L. , Knight, R. , and Fierer, N. , 2011: Sources of bacteria in outdoor air across cities in the midwestern United States. Applied and Environmental Microbiology , 77: 6350–6356. doi http://dx.doi.org/10.1128/AEM.05498-11.
- Bowers, R. M. , McCubbin, I. B. , Hallar, A. G. , and Fierer, N. , 2012: Seasonal variability in airborne bacterial communities at a high-elevation site. Atmospheric Environment , 50: 41–49. doi http://dx.doi.org/10.1016/j.atmosenv.2012.01.005.
- Brown, L. E. , Hannah, D. M. , and Milner, A. M. , 2007: Vulnerability of alpine stream biodiversity to shrinking glaciers and snowpacks. Global Change Biology , 13: 958–966. doi http://dx.doi.org/10.1111/j.1365-2486.2007.01341.x.
- Buckeridge, K. M. , and Grogan, P. , 2008: Deepened snow alters soil microbial nutrient limitations in Arctic birch hummock tundra. Applied Soil Ecology , 39: 210–222. doi http://dx.doi.org/10.1016/j.apsoil.2007.12.010.
- Caporaso, J. G. , Kuczynski, J. , Stombaugh, J. , Bittinger, K. , Bushman, F.D. , Costello, E.K. , Fierer, N. , Peña, A.G. , Goodrich, J.K. , Gordon, J.I. , Huttley, G.A. , Kelley, S.T. , Knights, D. , Koenig, J.E. , Ley, R.E. , Lozupone, C.A. , McDonald, D. , Muegge, B.D. , Pirrung, M. , Reeder, J. , Sevinsky, J.R. , Turnbaugh, P.J. , Walters, W.A. , Widmann, J. , Yatsunenko, T. , Zaneveld, J. , Knight, R. , 2010: QIIME allows analysis of high-throughput community sequencing data. Nature Methods , 7: 335–336. doi http://dx.doi.org/10.1038/nmeth.f.303.
- Casanueva, A. , Tuffin, M. , Cary, C. , and Cowan, D. A. , 2010. Molecular adaptations to psychrophily: the impact of “omic” technologies. Trends in Microbiology , 18: 374–381. doi http://dx.doi.org/10.1016/j.tim.2010.05.002.
- Christner, B. C. , Morris, C. E. , Foreman, C. M. , Cai, R. , and Sands, D. C. , 2008: Ubiquity of biological ice nucleators in snowfall. Science , 319: 1214–1214. doi http://dx.doi.org/10.1126/science.1149757.
- Chuvochina, M. S. , Alekhina, I. A. , Normand, P. , Petit, J.-R. , and Bulat, S. A. , 2011a: Three events of Saharan dust deposition on the Mont Blanc glacier associated with different snow-colonizing bacterial phylotypes. Microbiology , 80: 125–131. doi http://dx.doi.org/10.1134/S0026261711010061.
- Chuvochina, M. S. , Marie, D. , Chevaillier, S. , Petit, J.-R. , Normand, P. , Alekhina, I. A. , and Bulat, S. A. , 2011b: Community variability of bacteria in alpine snow (Mont Blanc) containing Saharan dust deposition and their snow colonisation potential. Microbes and Environments , 26: 237–247. doi http://dx.doi.org/10.1264/jsme2.ME11116.
- Cohen, J. , and Entekhabi, D. , 2001: The influence of snow cover on northern hemisphere climate variability. Atmosphere-Ocean , 39: 35–53. doi http://dx.doi.org/10.1080/07055900.2001.9649665.
- Connon, S. A. , Lester, E. D. , Shafaat, H. S. , Obenhuber, D. C. , and Ponce, A. , 2007: Bacterial diversity in hyperarid Atacama Desert soils. Journal of Geophysical Research: Biogeosciences , 112: G04S17. doi http://dx.doi.org/10.1029/2006JG000311.
- Crotti, E. , Rizzi, A. , Chouaia, B. , Ricci, I. , Favia, G. , Alma, A. , Sacchi, L. , Bourtzis, K. , Mandrioli, M. , Cherif, A. , Bandi, C. , and Daffonchio, D. , 2010. Acetic acid bacteria, newly emerging symbionts of insects. Applied and Environmental Microbiology , 76: 6963–6970. doi http://dx.doi.org/10.1128/AEM.01336-10.
- del Carmen Montero-Calasanz, M. , Göker, M. , Rohde, M. , Schumann, P. , Pötter, G. , Spröer, C. , Gorbushina, A. A. , and Klen, H.-P. 2013: Geodermatophilus siccatus sp. nov., isolated from arid sand of the Saharan desert in Chad: Antonie van Leeuwenhoek , 103: 449–456. doi http://dx.doi.org/10.1007/s10482-012-9824-x.
- De Maayer, P. , Anderson, D. , Cary, C. , and Cowan, D. A. , 2014: Some like it cold: understanding the survival strategies of psychrophiles. EMBO Reports , 15: 508–517. doi http://dx.doi.org/10.1002/embr.201338170.
- Déry, S. J. , and Brown, R. D. , 2007: Recent northern hemisphere snow cover extent trends and implications for the snow-albedo feedback. Geophysical Research Letters , 34: L22504. doi http://dx.doi.org/10.1029/2007GL031474.
- Edwards, A. C. , Scalenghe, R. , and Freppaz, M. , 2007: Changes in the seasonal snow cover of alpine regions and its effect on soil processes: a review. Quaternary International, The Soil Record of Quaternary Climate Change , 162–163: 172–181. doi http://dx.doi.org/10.1016/j.quaint.2006.10.027.
- Eilers, K. G. , Debenport, S. , Anderson, S. , and Fierer, N. , 2012: Digging deeper to find unique microbial communities: the strong effect of depth on the structure of bacterial and archaeal communities in soil. Soil Biology and Biochemistry , 50: 58–65. doi http://dx.doi.org/10.1016/j.soilbio.2012.03.011.
- Faith, D. P. , 1992: Conservation evaluation and phylogenetic diversity. Biological Conservation , 61: 1–10. doi http://dx.doi.org/10.1016/0006-3207(92)91201-3.
- Gilbert, D. G. , 1980: Dispersal of yeasts and bacteria by Drosophila in a temperate forest. Oecologia , 46: 135–137. doi http://dx.doi.org/10.1007/BF00346979.
- Goudie, A. S. , and Middleton, N. J. , 2001. Saharan dust storms: nature and consequences. Earth-Science Reviews , 56: 179–204. doi http://dx.doi.org/10.1016/S0012-8252(01)00067-8.
- Goulden, M. L. , Anderson, R. G. , Bales, R. C. , Kelly, A. E. , Meadows, M. , and Winston, G. C. , 2012: Evapotranspiration along an elevation gradient in California's Sierra Nevada. Journal of Geophysical Research: Biogeosciences , 117: G03028. doi http://dx.doi.org/10.1029/2012JG002027.
- Griffin, D. W. , 2007: Atmospheric movement of microorganisms in clouds of desert dust and implications for human health. Clinical Microbiology Reviews , 20: 459–477. doi http://dx.doi.org/10.1128/CMR.00039-06.
- Gtari, M. , Essoussi, I. , Maaoui, R. , Sghaier, H. , Boujmil, R. , Gury, J. , Pujic, P. , Brusetti, L. , Chouaia, B. , Crotti, E. , Daffonchio, D. , Boudabous, A. , and Normand, P. , 2012: Contrasted resistance of stone-dwelling Geodermatophilaceae species to stresses known to give rise to reactive oxygen species. FEMS Microbiology Ecology , 80: 566–577. doi http://dx.doi.org/10.1111/j.1574-6941.2012.01320.x.
- Harding, T. , Jungblut, A. D. , Lovejoy, C. , and Vincent, W. F. , 2011: Microbes in High Arctic snow and implications for the cold biosphere. Applied and Environmental Microbiology , 77: 3234–3243. doi http://dx.doi.org/10.1128/AEM.02611-10.
- Hell, K. , Edwards, A. , Zarsky, J. , Podmirseg, S. M. , Girdwood, S. , Pachebat, J. A. , Insam, H. , and Sattler, B. , 2013: The dynamic bacterial communities of a melting High Arctic glacier snowpack. The ISME Journal , 7: 1814–1826. doi http://dx.doi.org/10.1038/ismej.2013.51.
- Hinkler, J. , Hansen, B. U. , Tamstorf, M. P. , Sigsgaard, C. , and Petersen, D. , 2008: Snow and snow-cover in central northeast Greenland. In Meltofte, H. , Christensen, T. R. ., Elberling, B. , Forchhammer, M. C. , and Rasch, M. (ed.), Advances in Ecological Research, High-Arctic Ecosystem Dynamics in a Changing Climate. Amsterdam: Academic Press, 175–195.
- Hodson, A. , Anesio, A. M. , Tranter, M. , Fountain, A. , Osborn, M. , Priscu, J. , Laybourn-Parry, J. , and Sattler, B. , 2008: Glacial ecosystems. Ecological Monographs , 78: 41–67. doi http://dx.doi.org/10.1890/07-0187.1.
- Humayoun, S. B. , Bano, N. , and Hollibaugh, J. T. , 2003: Depth distribution of microbial diversity in Mono Lake, a meromictic soda lake in California. Applied and Environmental Microbiology , 69: 1030–1042. doi http://dx.doi.org/10.1128/AEM.69.2.1030-1042.2003.
- Ivanova, N. , Sikorski, J. , Jando, M. , Munk, C. , Lapidus, A. , Glavina Del Rio, T. , Copeland, A. , Tice, H. , Cheng, J.-F. , Lucas, S. , Chen, F. , Nolan, M. , Bruce, D. , Goodwin, L. , Pitluck, S. , Mavromatis, K. , Mikhailova, N. , Pati, A. , Chen, A. , Palaniappan, K. , Land, M. , Hauser, L. , Chang, Y.-J. , Jeffries, C. D. , Meincke, L. , Brettin, T. , Detter, J. C. , Rohde, M. , Göker, M. , Bristow, J. , Eisen, J. A. , Markowitz, V. , Hugenholtz, P. , Kyrpides, N. C. , and Klenk, H.-P. , 2010: Complete genome sequence of Geodermatophilus obscurus type strain (G-20T). Standards in Genomic Sciences , 2(2): 2020158, doi http://dx.doi.org/10.4056/sigs.711311.
- Johnson, M. , Zaretskaya, I. , Raytselis, Y. , Merezhuk, Y. , McGinnis, S. , and Madden, T. L. , 2008: NCBI BLAST: a better web interface. Nucleic Acids Research , 36: W5–W9. doi http://dx.doi.org/10.1093/nar/gkn201.
- Jones, H. G. , 1999: The ecology of snow-covered systems: a brief overview of nutrient cycling and life in the cold. Hydrological Processes , 13: 2135–2147. doi http://dx.doi.org/10.1002/(SICI)1099-1085(199910)13:14/15<2135::AID-HYP862>3.0.CO;2-Y.
- Katsura, K. , Kawasaki, H. , Potacharoen, W. , Saono, S. , Seki, T. , Yamada, Y. , Uchimura, T. , and Komagata, K. , 2001: Asaia siamensis sp. nov., an acetic acid bacterium in the α-Proteobacteria. International Journal of Systematic and Evolutionary Microbiology , 51: 559–563.
- Kellogg, C. A. , and Griffin, D. W. , 2006: Aerobiology and the global transport of desert dust. Trends in Ecology & Evolution , 21: 638–644. doi http://dx.doi.org/10.1016/j.tree.2006.07.004.
- Kim, O.-S. , Cho, Y.-J. , Lee, K. , Yoon, S.-H. , Kim, M. , Na, H. , Park, S.-C. , Jeon, Y.S. , Lee, J.-H. , Yi, H. , Won, S. , and Chun, J. , 2012a: Introducing EzTaxon-e: a prokaryotic 16S rRNA gene sequence database with phylotypes that represent uncultured species. International Journal of Systematic and Evolutionary Microbiology , 62: 716–721. doi http://dx.doi.org/10.1099/ijs.0.038075-0.
- Kim, S. J. , Shin, S. C. , Hong, S. G. , Lee, Y. M. , Lee, H. , Lee, J. , Choi, I.-G. , and Park, H. , 2012b: Genome sequence of Janthinobacterium sp. Strain PAMC 25724, isolated from alpine glacier cryoconite. Journal of Bacteriology , 194: 2096. doi http://dx.doi.org/10.1128/JB.00096-12.
- Klindworth, A. A. , Pruesse, E. , Schweer, T. , Peplies, J. , Quast, C. , Horn, M. , and Glöckner, F. O. , 2013: Evaluation of general 16S ribosomal RNA gene PCR primers for classical and next-generation sequencing-based diversity studies. Journal of Nucleic Acids Research , 41(1): e1. doi http://dx.doi.org/10.1093/nar/gks808.
- Kong, H. H. , Oh, J. , Deming, C. , Conlan, S. , Grice, E. A. , Beatson, M. A. , Nomicos, E. , Polley, E. C. , Komarow, H. D. , Program, N. C. S. , Murray, P. R. , Turner, M. L. , and Segre, J. A. , 2012: Temporal shifts in the skin microbiome associated with disease flares and treatment in children with atopic dermatitis. Genome Research , 22: 850–859. doi http://dx.doi.org/10.1101/gr.131029.111.
- Larose, C. , Berger, S. , Ferrari, C. , Navarro, E. , Dommergue, A. , Schneider, D. , and Vogel, T. M. , 2010: Microbial sequences retrieved from environmental samples from seasonal Arctic snow and meltwater from Svalbard, Norway. Extremophiles , 14: 205–212. doi http://dx.doi.org/10.1007/s00792-009-0299-2.
- Larose, C. , Dommergue, A. , and Vogel, T. M. , 2013a: The dynamic Arctic snow pack: an unexplored environment for microbial diversity and activity. Biology , 2: 317–330. doi http://dx.doi.org/10.3390/biology2010317.
- Larose, C. , Dommergue, A. , and Vogel, T. M. , 2013b: Microbial nitrogen cycling in Arctic snowpacks. Environmental Research Letters , 8(3): 035004, http://iopscience.iop.org/article/10.1088/1748-9326/8/3/035004/meta.
- Lazzaro, A. , Wismer, A. , Schneebeli, M. , Erny, I. , and Zeyer, J. , 2015: Microbial abundance and community structure in a melting alpine snowpack. Extremophiles , 19: 631–642. doi http://dx.doi.org/10.1007/s00792-015-0744-3.
- Lee, Y. M. , Kim, E. H. , Lee, H. K. , and Hong, S. G. , 2014: Biodiversity and physiological characteristics of Antarctic and Arctic lichens-associated bacteria. World Journal of Microbiology and Biotechnology , 30: 2711–2721. doi http://dx.doi.org/10.1007/s11274-014-1695-z.
- Lipson, D. A. , Monson, R. K. , Schmidt, S. K. , and Weintraub, M. N. , 2008: The trade-off between growth rate and yield in microbial communities and the consequences for under-snow soil respiration in a high elevation coniferous forest. Biogeochemistry , 95: 23–35. doi http://dx.doi.org/10.1007/s10533-008-9252-1.
- Liu, Y. , Yao, T. , Kang, S. , Jiao, N. , Zeng, Y. , Huang, S. , and Luo, T. , 2007: Microbial community structure in major habitats above 6000 m on Mount Everest. Chinese Science Bulletin , 52: 2350–2357. doi http://dx.doi.org/10.1007/s11434-007-0360-4.
- Liu, Y. , Yao, T. , Jiao, N. , Kang, S. , Xu, B. , Zeng, Y. , Huang, S. , and Liu, X. , 2009: Bacterial diversity in the snow over Tibetan Plateau glaciers. Extremophiles , 13: 411–423. doi http://dx.doi.org/10.1007/s00792-009-0227-5.
- Loganathan, P. , 2004: Swaminathania salitolerans gen. nov., sp. nov., a salt-tolerant, nitrogen-fixing and phosphate-solubilizing bacterium from wild rice (Porteresia coarctata Tateoka). International Journal of Systematic and Evolutionary Microbiology , 54: 1185–1190. doi http://dx.doi.org/10.1099/ijs.0.02817-0.
- Lopatina, A. , Krylenkov, V. , and Severinov, K. , 2013: Activity and bacterial diversity of snow around Russian Antarctic stations. Research in Microbiology , 164: 949–958. doi http://dx.doi.org/10.1016/j.resmic.2013.08.005.
- Maccario, L. , Vogel, T. M. , and Larose, C. , 2014: Potential drivers of microbial community structure and function in Arctic spring snow. Frontiers in Microbiology , 5. doi http://dx.doi.org/10.3389/fmicb.2014.00413.
- Margesin, R. , and Miteva, V. , 2011: Diversity and ecology of psychrophilic microorganisms. Research in Microbiology , 162: 346–361. doi http://dx.doi.org/10.1016/j.resmic.2010.12.004.
- Martiny, J. B. H. , Bohannan, B. J. M. , Brown, J. H. , Colwell, R. K. , Fuhrman, J. A. , Green, J. L. , Horner-Devine, M. C. , Kane, M. , Krumins, J. A. , Kuske, C. R. , Morin, P. J. , Naeem, S. , Øvreås, L. , Reysenbach, A.-L. , Smith, V. H. , and Staley, J. T. , 2006: Microbial biogeography: putting microorganisms on the map. Nature Reviews Microbiology 4: 102–112. doi http://dx.doi.org/10.1038/nrmicro1341.
- Martiny, J. B. H. , Jones, S. E. , Lennon, J. T. , and Martiny, A. C. , 2015: Microbiomes in light of traits: a phylogenetic perspective. Science , 350: aac9323. doi http://dx.doi.org/10.1126/science.aac9323.
- Meola, M. , Lazzaro, A. , and Zeyer, J. , 2015. Bacterial composition and survival on Sahara dust particles transported to the European Alps. Frontiers in Microbiology , 6: doi http://dx.doi.org/10.3389/fmicb.2015.01454.
- Miteva, V. , 2008: Bacteria in snow and glacier ice. In Margesin, R. , Schinner, F. , Marx, J.-C. , and Gerday, C. (eds.), Psychrophiles: From Biodiversity to Biotechnology. Springer Berlin Heidelberg, 31–50.
- Møller, A. K. , Søborg, D. A. , Al-Soud, W. A. , Sørensen, S. J. , and Kroer, N. , 2013: Bacterial community structure in High-Arctic snow and freshwater as revealed by pyrosequencing of 16S rRNA genes and cultivation. Polar Research , 32: 17390. doi http://dx.doi.org/10.3402/polar.v32i0.17390.
- Papke, R. T. , and Ward, D. M. , 2004. The importance of physical isolation to microbial diversification. FEMS Microbiology Ecology , 48: 293–303. doi http://dx.doi.org/10.1016/j.femsec.2004.03.013.
- Qian, Y. , Yasunari, T. J. , Doherty, S. J. , Flanner, M. G. , Lau, W. K. M. , Ming, J. , Wang, H. , Wang, M. , Warren, S. G. , and Zhang, R. , 2014: Light-absorbing particles in snow and ice: measurement and modeling of climatic and hydrological impact. Advances in Atmospheric Sciences , 32: 64–91. doi http://dx.doi.org/10.1007/s00376-014-0010-0.
- Rainey, F. A. , Ray, K. , Ferreira, M. , Gatz, B. Z. , Nobre, M. F. , Bagaley, D. , Rash, B. A. , Park, M.-J. , Earl, A. M. , Shank, N. C. , Small, A. M. , Henk, M. C. , Battista, J. R. , Kämpfer, P. , da Costa, M. S. , 2005: Extensive diversity of ionizing-radiation-resistant bacteria recovered from Sonoran Desert soil and description of nine new species of the genus Deinococcus obtained from a single soil sample. Applied and Environmental Microbiology , 71: 5225–5235. doi http://dx.doi.org/10.1128/AEM.71.9.5225-5235.2005.
- Rothschild, L. J. , and Mancinelli, R. L. , 2001: Life in extreme environments. Nature , 409: 1092–1101. doi http://dx.doi.org/10.1038/35059215.
- Samaddar, N. , Paul, A. , Chakravorty, S. , Chakraborty, W. , Mukherjee, J. , Chowdhuri, D. , and Gachhui, R. , 2011: Nitrogen fixation in Asaia sp. (family Acetobacteraceae). Current Microbiology , 63: 226–231. doi http://dx.doi.org/10.1007/s00284-011-9968-3.
- Saravanan, V. S. , Madhaiyan, M. , Osborne, J. , Thangaraju, M. , and Sa, T. M. , 2008: Ecological occurrence of Gluconacetobacter diazotrophicus and nitrogen-fixing Acetobacteraceae members: their possible role in plant growth promotion. Microbial Ecology , 55: 130–140. doi http://dx.doi.org/10.1007/s00248-007-9258-6.
- Schimel, J. P. , Bilbrough, C. , and Welker, J. M. , 2004: Increased snow depth affects microbial activity and nitrogen mineralization in two Arctic tundra communities. Soil Biology and Biochemistry , 36: 217–227. doi http://dx.doi.org/10.1016/j.soilbio.2003.09.008.
- Segawa, T. , Miyamoto, K. , Ushida, K. , Agata, K. , Okada, N. , and Kohshima, S. , 2005: Seasonal change in bacterial flora and biomass in mountain snow from the Tateyama Mountains, Japan, analyzed by 16S rRNA gene sequencing and real-time PCR. Applied and Environmental Microbiology , 71: 123–130. doi http://dx.doi.org/10.1128/AEM.71.1.123-130.2005.
- Seok, B. , Helmig, D. , Williams, M. W. , Liptzin, D. , Chowanski, K. , and Hueber, J. , 2009: An automated system for continuous measurements of trace gas fluxes through snow: an evaluation of the gas diffusion method at a subalpine forest site, Niwot Ridge, Colorado. Biogeochemistry , 95: 95–113. doi http://dx.doi.org/10.1007/s10533-009-9302-3.
- Sheik, C. S. , Stevenson, E. I. , Den Uyl, P. A. , Arendt, C. A. , Aciego, S. M. , and Dick, G. J. , 2015: Microbial communities of the Lemon Creek Glacier show subtle structural variation yet stable phylogenetic composition over space and time. Frontiers in Microbiology , 6: 495. doi http://dx.doi.org/10.3389/fmicb.2015.00495.
- Telling, J. , Anesio, A. M. , Tranter, M. , Irvine-Fynn, T. , Hodson, A. , Butler, C. , and Wadham, J. , 2011: Nitrogen fixation on Arctic glaciers, Svalbard. Journal of Geophysical Research: Biogeosciences , 116(G3): doi http://dx.doi.org/10.1029/2010JG001632.
- Thomas, W. H. , and Duval, B. , 1995: Sierra Nevada, California, U.S.A., snow algae: snow albedo changes, algal-bacterial interrelationships, and ultraviolet radiation effects. Arctic and Alpine Research , 27: 389–399. doi http://dx.doi.org/10.2307/1552032.
- Vicars, W. C. , and Sickman, J. O. , 2011: Mineral dust transport to the Sierra Nevada, California: loading rates and potential source areas. Journal of Geophysical Research: Biogeosciences , 116: G01018. doi http://dx.doi.org/10.1029/2010JG001394 .
- Xiang, S.-R. , Shang, T.-C. , Chen, Y. , Jing, Z.-F. , and Yao, T. , 2009a: Changes in diversity and biomass of bacteria along a shallow snow pit from Kuytun 51 Glacier, Tianshan Mountains, China. Journal of Geophysical Research: Biogeosciences , 114: G04008. doi http://dx.doi.org/10.1029/2008JG000864.
- Xiang, S.-R. , Shang, T.-C. , Chen, Y. , and Yao, T.-D. , 2009b: Deposition and postdeposition mechanisms as possible drivers of microbial population variability in glacier ice. FEMS Microbiology Ecology , 70: 165–176. doi http://dx.doi.org/10.1111/j.1574-6941.2009.00759.x.
- Yallop, M. L. , Anesio, A. M. , Perkins, R. G. , Cook, J. , Telling, J. , Fagan, D. , MacFarlane, J. , Stibal, M. , Barker, G. , Bellas, C. , Hodson, A. , Tranter, M. , Wadham, J. , and Roberts, N. W. , 2012: Photophysiology and albedo-changing potential of the ice algal community on the surface of the Greenland ice sheet. The ISME Journal , 6: 2302–2313. doi http://dx.doi.org/10.1038/ismej.2012.107.
- Zinger, L. , Shahnavaz, B. , Baptist, F. , Geremia, R. A. , and Choler, P. , 2009: Microbial diversity in alpine tundra soils correlates with snow cover dynamics. The ISME Journal , 3: 850–859. doi http://dx.doi.org/10.1038/ismej.2009.20.