
ABSTRACT
Change detection studies using remote sensing and plot-based sampling show that Arctic vegetation is changing. Most studies have focused on the proliferation of tall shrubs, but increased productivity in areas where shrub cover is low suggests that other functional groups may also be changing. To investigate vegetation change across the Tuktoyaktuk Coastlands we analyzed high-resolution repeat air photos from 1980 and 2013. Thirty-eight image pairs were used to estimate changes in the cover of six functional groups (tall shrub, dwarf shrub, non-tussock-forming sedge, tussock-forming sedge, moss, and lichen). The spatial extent of our airphotos allowed us to investigate changes across four terrain types (high-center polygonal terrain, low-center polygonal terrain, shrub tundra, and tussock tundra). Our analysis shows that all four terrain types experienced absolute increases in shrub cover (+7.71% to 11.98%), with the expansion of dwarf shrubs playing an especially important role in regional change. Significant declines in lichen cover were also observed. While the consistency of shrub encroachment across terrain types suggests that changes were facilitated by shifts in broad-scale processes like temperature or precipitation, our data also indicate that differences in the magnitude of change were mediated by community structure and the availability of suitable microsites.
Introduction
A growing body of evidence shows that recent increases in air temperature are altering vegetation structure across the Arctic. At broad scales, long-term trends in the normalized difference vegetation index (NDVI), a measure of vegetation productivity derived from satellite data, indicate that Arctic vegetation is becoming more productive. This trend has been observed using NDVI data derived from multiple sensors, including AVHRR, MODIS, and LANDSAT, and has been coincident with accelerated temperature increases at high latitudes (CitationMyneni et al., 1997; CitationBhatt et al., 2010; CitationBeck and Goetz, 2011 ; CitationFraser et al., 2014). Evidence from air photo comparisons, plot-scale observations, and experimental warming suggests that these broad-scale increases in productivity in the Arctic have occurred as a result of increases in tall shrub cover—largely alder, willow, and birch species (CitationTape et al., 2006; CitationLantz et al., 2010; CitationBeck and Goetz, 2011; CitationFraser et al., 2011; CitationMyers-Smith et al., 2011). Plot-scale experiments (CitationWalker et al., 2006), shrub dendrochronology (CitationForbes et al., 2010; CitationMyers-Smith et al., 2015), and permanent plot studies (CitationElmendorf et al., 2012b) at sites across the tundra biome also demonstrate a clear connection between observed shrub expansion and rising temperatures.
Although tall shrubs are clearly playing a central role in high latitude vegetation change, additional research is required to investigate the contribution and fate of other functional groups, including dwarf shrubs, sedges, lichens, and mosses. Increased productivity in areas where shrub cover is lower (CitationTape et al., 2006; CitationOlthof et al., 2008; CitationBeck and Goetz, 2011) suggests that increases in other functional groups are also contributing to the changes in productivity observed at broad scales. Evidence from experiments also suggests that the cover of lichen and moss has declined in response to regional warming (CitationCornelissen et al., 2001; CitationWalker et al., 2006; CitationHudson and Henry, 2010; CitationElmendorf et al., 2012a; CitationZamin et al., 2014), but more work is required to confirm and explain the nature of these changes.
Understanding the nature of Arctic vegetation change is important because variation in the cover of plant functional groups will result in significant impacts and feedbacks in tundra ecosystems. Increases in tall and dwarf shrub cover can modify surface energy exchange and snowpack (CitationSturm et al., 2001; CitationMarsh et al., 2010; CitationMyers-Smith et al., 2011; CitationGill et al., 2014) and can alter microclimate conditions affecting hydrology, near-surface ground temperatures, terrain stability, and soil carbon flux (CitationMack et al., 2004; CitationLantz et al., 2012; CitationNauta et al., 2015). The loss of mosses, graminoids, and lichens may have a negative effect on tundra species richness, which could have implications for food webs and ecosystem services (CitationMyers-Smith et al., 2011). For example, declines in the abundance of lichens are particularly concerning because their loss has the potential to negatively impact caribou and reindeer populations and affect hunting and herding practices (CitationCornelissen et al., 2001; CitationJoly et al., 2007). Additionally, the loss of macrolichens is concerning because they can be important for nitrogen fixation and nutrient cycling, have negative effects on seed establishment, and make substantial contributions to carbon storage (CitationCornelissen et al., 2001).
In 2013, we obtained a series of ultra-high-resolution image pairs (∼2–4 cm) from 1980 and 2013 that provide an unprecedented opportunity to study the nature of regional vegetation change in the Low Arctic. The aim of this research is to use these images to systematically assess changes in the cover of six plant functional groups (tall shrubs, dwarf shrubs, non-tussock-forming sedges, tussock-forming sedges, mosses, and lichens) in four terrain types (high-center polygonal terrain, low-center polygonal terrain, tussock tundra, and shrub tundra) across the Tuktoyaktuk Coastlands.
Methods
Study Area
The Tuktoyaktuk Coastlands is characterized by low, rolling hills and thousands of small lakes (CitationRampton, 1988; CitationBurn and Kokelj, 2009; CitationEcosystem Classification Group, 2012). The majority of the landscape is covered by clayey silts underlain by fine-grained, ice-rich tills (CitationAylsworth et al., 2000; CitationKokelj and Burn, 2004; CitationAgriculture and Agri-Food Canada, 2011). Polygonal peatlands in small lacustrine deposits, created by thermokarst lake drainage throughout the Holocene, are also common (CitationKokelj et al., 2014; CitationSteedman et al., 2016).
Our entire study area falls within the Arctic Bioclimate Subzone E as identified in the Circumpolar Arctic Vegetation Map (CitationWalker et al., 2005). The majority of the study region is composed of four terrain types, including shrub tundra, tussock tundra, high-center polygonal terrain, and low-center polygonal terrain. Upland areas are dominated by shrub tundra, which is characterized by Alnus viridis subsp. fruticosa (Rupr.) Nyman, Salix spp., Betula glandulosa Michx., Betula nana L., Rhododendron tomentosum subsp. decumbens (Aiton) Elven & D.F. Murray, and Rubus chamaemorus L. (CitationEcosystem Classification Group,2012; CitationFraser et al., 2014). The nomenclature for vascular plants used here follows Elven et al. (Citation2011).Tundra dominated by tussock-forming sedges (e.g., Eriophorum vaginatum L.) is also common in the study area (CitationEcosystem Classification Group, 2012). Low-lying areas are often characterized by high-centered polygonal terrain in which Rhododendron tomentosum subsp. decumbens, Rubus chamaemorus, Betula spp., and lichens (Cladina spp., Cetraria spp.) dominate the polygon centers, while sedges (e.g., Carex spp. and Eriophorum spp.) characterize the wet troughs between polygon centers (CitationGamon et al., 2012). Low-centered polygonal terrain also occurs in wet low-lying areas (CitationEcosystem Classification Group, 2012) and is dominated by non-tussock-forming sedge species (including Carex spp. and Eriophorum spp.), as well as dwarf shrubs (e.g., Rhododendron tomentosum subsp. decumbens, Arctous rubra [Rehder & E. H. Wilson] Nakai, and Betula spp.), which are found on the high ridges between low-lying centers. High- and low-center Polygonal terrain covers approximately 15% of the Tuktoyaktuk Coastlands (CitationSteedman et al., 2016). Individual study sites within the Tuktoyaktuk Coastlands () were selected to represent these four terrain types and to provide the largest geographic coverage possible.
Analysis of Repeat Photographs
To estimate changes in the cover of plant functional groups, we compared fine-scale (1:2000) historical (1980) and recent (2013) air photos from the region. The historical images were captured between 6 and 8 August 1980 using two Vinten 492 S/N cameras with 76.2 mm lenses attached to the wingtips of a Cessna 180 (CitationSims, 1983). These color-infrared (CIR) images were shot using Kodak Aerochrome Type 2443 film and were originally used to assess reindeer winter rangeland and quantify fructicose lichen cover (CitationSims, 1983). On 7 and 8 August 2013 these images were recaptured in color using a 16 megapixel Nikon D7000 camera with a 35 mm lens mounted to a Bell 206 Long Ranger helicopter (CitationFraser et al., 2014). The spatial resolution of the images in both years is equivalent to 1:2000 scale or ∼2–4 cm (CitationSims, 1983; CitationFraser et al., 2014).To our knowledge, these aerial photo pairs represent the highest resolution aerial images used in a vegetation change detection study in the Arctic.
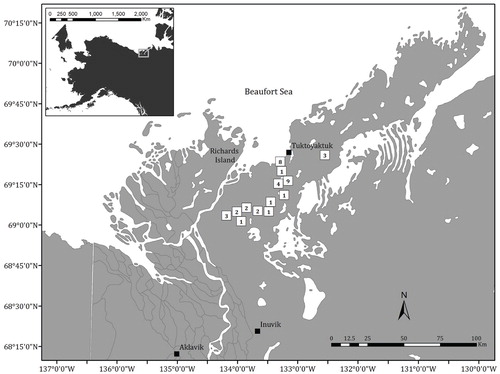
FIGURE 1. Map showing the location of the study site within the Tuktoyaktuk Coastlands. The number in each box indicates the number of photo pairs in each area. Communities are shown as solid black boxes. Inset map shows the position of the mapped area in the western Canadian Arctic.
Georeferencing of the 1980 and 2013 photo pairs was performed in ArcMap 10.2 using first-order polynomial transformations and nearest neighbor resampling methods. The first step in this process involved referencing the 2013 color photos to 2004 color orthophotos (1:30000; CitationNorthwest Territories Centre for Geomatics, 2004). The TIF formatted images produced by this process (geotifs) had an average RMS error of 0.24 m (range: 0.0062–0.74 m). The 1980 CIR images were then georeferenced using the 2013 geotifs. These georeferenced images had an average RMS error of 0.35 m (range: 0.08–0.81 m).After georeferencing, the matched photo pairs were cropped to a common extent to prepare them for classification.
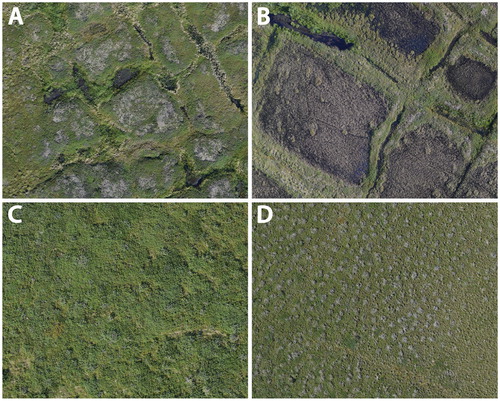
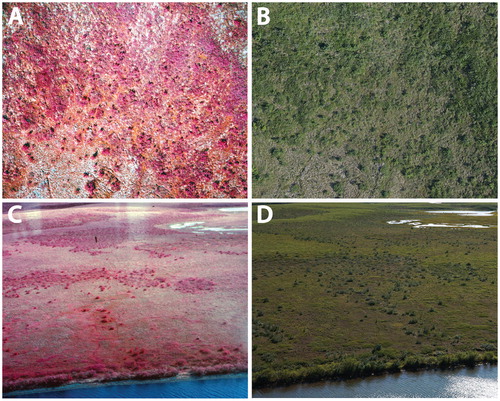
FIGURE 2. Aerial photos representative of the four terrain types that were used in our assessment of vegetation change in the Tuktoyaktuk Coastlands. (A) High-center polygonal terrain, (B) low-center polygonal terrain, (C) shrub tundra, and (D) tussock tundra. The smaller circular clumps in image (D) are tussocks, and the larger, lighter colored clumps are earth hummocks. Each image covers approximately 1200 m2, with the exception of (C), which covers approximately 600 m2.
Classification
To evaluate changes in plant functional group cover in the past three decades, we selected between 8 and 10 sites covered by repeat photographs in each of the following terrain types: high-center polygonal terrain (n = 10), low-center polygonal terrain (n = 8), shrub tundra (n = 10), and tussock tundra (n = 10) (). Since tundra fires can facilitate shrub expansion (CitationLantz et al., 2010,Citation2012; CitationFraser et al., 2014), we avoided image pairs that overlapped with tundra fires that burned in the past 50 years. To estimate plant functional group cover on these images, we generated up to 100 random points for each matched photo pair. In order to ensure that these points were distributed across each image, the minimum allowable distance between these points was set to 2 m. Photo pairs that did not cover enough area to accommodate 100 points were only used when no other sites were available. In total, four low-center polygon sites and two tussock tundra sites had less than 100 points (between 42 and 99 points).
Subsequently, the dominant functional group at each point was classified as either tall shrub, dwarf shrub, tussock-forming sedge, non-tussock-forming sedge, moss, lichen, or water (). Classification was based on image tone, brightness, texture, shadow, and context () and was performed while viewing images at scales between 1:50 to 1:100. Distinguishing criteria were developed using field data collected in 2013 and 2014 in which functional group abundance was recorded and ground-based photos of vegetation visible in the repeat photos were taken. Tall and dwarf shrubs were distinguished by the degree of internal and external shadow present in the imagery, with tall shrubs clearly rising higher than all other vegetation ().
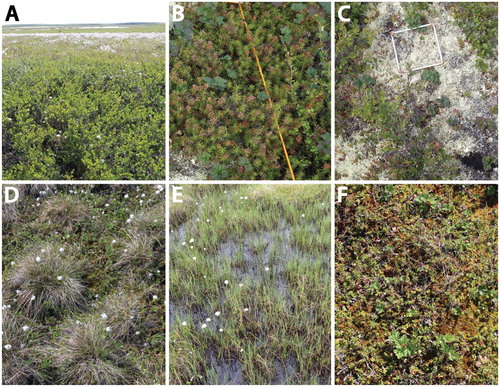
FIGURE 3. Photos showing examples of the six plant functional groups investigated in this paper. Images were taken during ground-truthing on 5 July 2014. (A) Tall shrub (Betula glandulosa; over 40 cm), (B) dwarf shrub (mainly Rhododendron tomentosum subsp. decumbens;less than 40 cm), (C) lichen (Cladonia spp.), (D) tussock-forming sedge (Eriophorum vaginatum), (E) nontussock-forming sedge (Carex spp. and Eriophorum spp.; most often occurring in wet areas), and (F) moss; (predominantly Sphagnum spp.; interspersed with a variety of other species).
Field Surveys
To investigate the impacts of shrub encroachment on lichen biomass and vascular plant diversity we also used the repeat photographs to select 40 Shrub Overtopped Sites. These areas were dominated by lichen in 1980, but visibly overtopped by vegetation in 2013. We also selected 38 sites that were dominated by lichen in both 1980 and 2013 (Unaltered Sites). These 78 plots, which were clustered in 9 areas within the Tuktoyaktuk Coastlands, were accessed by helicopter in 2014. In the field, each site was located using a GIS-enabled tablet displaying the georeferenced air photos from 2013. Once a plot was located, we positioned a 1 m2 quadrat around the plot centroid and captured a vertical photo of this area. Subsequently these photos were used to estimate the percent cover of vascular plants in each plot. Next, we randomly positioned a 20 × 20 cm quadrat inside the 1 m2 quadrat and harvested all of the lichens within the sample frame. Lichens were separated from plant litter and soil, dried, and then weighed.
Statistical Analysis
To test for significant differences in functional group cover between 1980 and 2013, we used the GLIMMIX procedure in the SAS software package to construct generalized linear mixed models (CitationLittell et al., 2006). Cover was modeled as events/trials, where events represented the number of times a functional group was encountered at a site, and trials denoted the total number of points within that site. These mixed models used a binomial distribution and a logistic link function. We treated year (1980 and 2013) as a fixed effect and site as a random effect using the subject option to specify our repeated measures design. Degrees of freedom were approximated using the Kenward-Roger method. Because we were only interested in the differences between years for specific functional groups in each terrain type, we evaluated individual models for each combination of these factors and reported pairwise comparisons that were significantly different at three levels (p < 0.05, p < 0.01, p < 0.001). Pairwise comparisons were conducted using the unadjusted p values provided by the LSMEANS option for multiple comparisons. To test for significant differences in lichen biomass between overtopped and unaltered sites, we used the MIXED procedure in SAS. In this analysis we modeled site status (unaltered or overtopped) as a fixed effect and site area as a random effect. Degrees of freedom were approximated using the Kenward-Roger method.
TABLE 1 Criteria used to classify points by functional group for color infrared (1980) and color and color (2013) imagery.
Results
Our analysis of repeat photographs shows that the vegetation in the Tuktoyaktuk Coastlands changed significantly between 1980 and 2013. Observed changes varied among terrain types, but, generally, shrubs and lichens were the most strongly impacted. In high-centered polygonal terrain, significant increases in tall and dwarf shrub cover of 1.4% and 10.5%, respectively, were accompanied by a decrease in lichen cover of 10.4% (). The cover of standing water in high-centered polygonal terrain also declined by 1.5%, but the change was only marginally significant (). While change in moss cover was not statistically significant, moss declined in 70% of the high-center polygon sites sampled (). No change in tussock-forming sedge was observed in this terrain type ().
In low-centered polygonal terrain, dwarf shrub cover increased significantly by 7.7%, and the cover of standing water decreased by 3.9% (). Increases in dwarf shrub cover were observed in all 8 low-center polygon sites ().While not statistically significant, tall shrub cover increased slightly, and sedges and moss showed minor declines ().
FIGURE 4. Plant functional group cover estimates in 1980 and 2013 using aerial photos in four terrain types: High-Center Polygonal Terrain, Low-Center Polygonal Terrain, Shrub Tundra, and Tussock Tundra. The solid black line inside each box represents the median value, the ends of the boxes represent the 25th and 75th percentiles and the whiskers show the 10th and 90th percentiles. Asterisks denote significant differences between means at several significance levels: * P < 0.05, ** P < 0.01, *** P < 0.001.
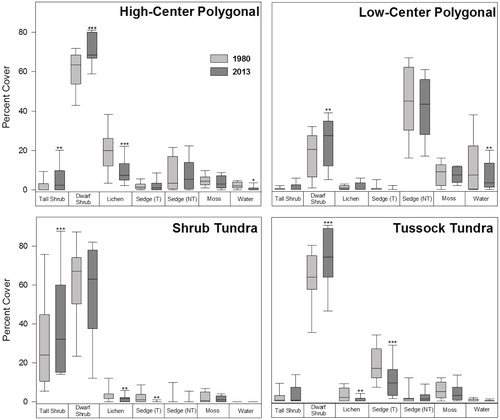
In shrub tundra, tall shrub cover increased by 12.0% () and increases in shrub cover were observed at all 10 sites ().The cover of lichen and tussock-forming sedges decreased by approximately 1.8% and 1.6%, respectively (). Other, nonstatistically significant changes included a 4.9% decline in dwarf shrub cover, and small decreases in non-tussock-forming sedge and moss cover (). There was no water present in any of the shrub tundra sites that were examined.
In tussock tundra sites, we observed a significant increase in dwarf shrub cover (+11.0%) and declines in lichen cover (-1.6%) and tussock cover (-7.7%; ). A reduction in tussock cover was observed in all 10 sites in this terrain type (). Evidence of overtopping and intertussock shrub growth, which has been observed in several other repeat photo analyses (CitationChapin et al., 1995; CitationFraser et al., 2014), was often clear in our imagery (). Other changes in tussock tundra included nonsignificant increases in tall shrub and non-tussock-forming sedge cover, and declines in moss and water cover ().
TABLE 2 Consistency of changes in functional group cover shown as the percentage of the total number of sites for each terrain type exhibiting increases, decreases or no change.
Field sampling showed that lichen biomass in areas of shrub encroachment was significantly lower than at unaltered sites (; P < 0.001). Vascular plants that dominated overtopped sites included Betula nana., Rhododendron tomentosum subsp. decumbens, and Rubus chamaemorus (8.3 ± 2.6%).These same species had lower cover at unaltered sites ().
FIGURE 5. A portion of a 1980 (color infrared) and 2013 (color) photo pair taken over tussock tundra terrain. This photo pair highlights significant declines in tussock-forming sedge (light colored circles) with a corresponding increase in dwarf shrub cover. This trend is especially noticeable in the top right corner where tussocks are still visible in the 1980 image, but have been overtopped by dwarf shrubs in 2013.
Discussion
Increased Dwarf Shrub Cover and Lichen Decline
The quality of the repeat photos from the Tuktoyaktuk Coastlands allowed us to distinguish between several plant functional groups and assess their individual roles in the increasing productivity observed across the circumpolar north. Our analysis showed that dwarf shrub expansion has played an especially important role in these changes. Dwarf shrub cover increased significantly in all terrain types except shrub tundra, which was already dominated by tall and dwarf shrubs (). Shrub species like Betula nana may be particularly responsive to continuous warming because of physiological advantages that allow for increased dominance over other tundra species (CitationDeslippe et al., 2011; CitationHenry et al., 2012). For example, Betula nana has been shown to use belowground transfer through mycorrhizal networks to benefit from warming more than other species such as Eriophorum vaginatum, Rhododendron tomentosum subsp. decumbens, Vaccinium vitis-idaea L., Salix spp., and Carex spp. (CitationDeslippe and Simard, 2011).The dominance of Betula nana has also been attributed to the development of long shoots that reduce the light available to other species (CitationBret-Harte et al., 2001). Flexible growth strategies such as these allow dwarf shrub species, like Betula nana, which was observed to be the most dominant species encroaching on lichen plots (), to expand more rapidly.
FIGURE 6. A comparison of lichen biomass (g/m2) at sites dominated by lichen in both 1980 and 2013 (Unaltered Sites) with sites dominated by lichen in 1980, but overtopped by shrubs by 2013 (Shrub Overtopped Sites). The solid black line inside the box represents the median value, the ends of the boxes represent the 25th and 75th percentiles and the whiskers show the 10th and 90th percentiles. The asterisks denote a significant difference (P < 0.001) in lichen biomass between site types.
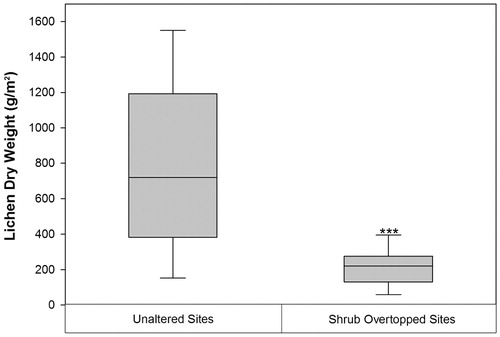
TABLE 3 Dominant cover found within Shrub Overtopped Sites and Unaltered Sites.Table shows the mean percent cover and the 95% confidence interval of the mean.
Our findings are largely consistent with other recent studies of Low Arctic vegetation dynamics. The majority of plot-based sampling studies and warming experiments have shown increases in the growth and cover of deciduous shrubs (CitationChapin et al., 1995; CitationWalker et al., 2006; CitationLantz et al., 2010; CitationElmendorf et al., 2012b). Changes in shrub cover described in other remote sensing studies in the Canadian Arctic range from +3% to +15% over the past 25 to 30 yr (CitationFraser et al., 2011; CitationLantz et al., 2012), which is similar to the 1.4%–12.0% increase we observed. Although warming experiments have had effects on lichen cover ranging from observations of no change to instances where impacts were strongly negative (CitationZamin et al., 2014), our analysis shows that lichen cover declined by 1.6%–10.4%. Where lichen declines have been observed in other studies, they have been attributed primarily to the indirect effects of shading and litter accumulation (CitationCornelissen et al., 2001; CitationWalker et al., 2006; CitationHudson and Henry, 2010; CitationElmendorf et al., 2012a; CitationZamin et al., 2014). This explanation is consistent with our own findings as lichen decline coincided with increased shrub cover (–) and lichen cover was not impacted in terrain where mean dwarf shrub cover was below 40% (). Our field sampling also confirms that shrub overtopping reduced lichen biomass by 73%.
Moss cover has been found to respond variably to climate warming experiments, showing both declines and increases with experimental warming CitationJónsdóttir et al., 2005;CitationWalker et al., 2006; CitationHudson and Henry, 2010; CitationElmendorf et al., 2012a; CitationHollister et al., 2015).We observed declines in moss cover in all four terrain types, but the differences were not significant ().The fact that we did not observe significant changes in moss cover was probably related to our limited capacity to detect moss using air photos. Since moss cover is found beneath most functional groups and is partly obscured by litter and other vegetation, it is likely that our results significantly underestimated total moss cover in all terrain types.
Differences Among Terrain Types
The spatial extent of the air photos allowed us to distinguish differences in the magnitude of change observed in four different terrain types: high-centered polygonal terrain, low-centered polygonal terrain, shrub tundra, and tussock tundra. Variation in the magnitude of shrub proliferation in each terrain type was likely caused by differences in the community composition and the availability of microsites that provide suitable space for shrub establishment. In some cases, the initial composition of tundra communities has been observed to be an important controlling factor on response to moderate warming (CitationJónsdóttir et al., 2005). In Svalbard, for example, changes have been negligible partly because the community of species that are able to survive in such harsh conditions exhibit slow ecological response to change (CitationPrach et al., 2009). The density of vegetative cover and availability of suitable microsites has also been shown to play a significant role in limiting the colonization of new species. For example, dense cover and a lack of physical space for establishment likely prevented the expansion of shrubs in a study near Tasiilaq in southeast Greenland (CitationDaniëls et al., 2011).
In the Tuktoyaktuk Coastlands, dwarf shrub expansion was likely the most extensive in highcentered polygonal terrain because the main competition was lichen (). With a competitive advantage over functional groups like lichens, shrubs are able to proliferate quickly in these landscapes (CitationChapin and Shaver, 1996; CitationBret-Harte et al., 2001; CitationDeslippe and Simard, 2011; CitationFraser et al., 2014). Extensive dwarf shrub expansion in tussock tundra was likely also related to the competitive advantage of shrubs over sedges (CitationChapin and Shaver, 1996;CitationBret-Harte et al.,2001; CitationDeslippe and Simard, 2011) and the abundance of suitable microsites between tussocks and on the exposed surfaces of the earth hummocks (CitationTarnocai and Zoltai, 1978; CitationMackay, 1980; ). This observation is also consistent with Epstein et al.'s (Citation2004) prediction that vegetation changes in response to climate change will be most rapid in tussock tundra. Dwarf shrub expansion in low-center polygonal terrain was likely limited because saturated soils and standing water reduced suitable microsites for shrub establishment (). In shrub tundra, dwarf shrub expansion was likely constrained by tall shrubs (), which decreased available space and increased shading. Furthermore, shading from tall shrubs may have decreased soil temperature and nutrient cycling (CitationBlok et al., 2010), making successful dwarf shrub establishment less likely.
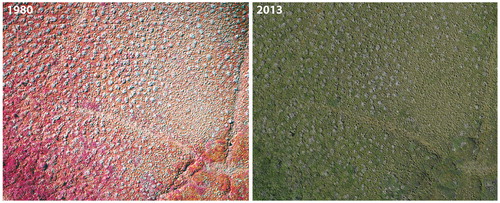
FIGURE 7. Vertical and oblique photos showing vegetation change in high-center polygonal terrain. Photos (A) and (B) show part of a 1980 (color infrared) and 2013 (color) photo pair highlighting the expansion of dwarf shrub cover over the polygon centers, which were previously dominated by a high cover of lichen. (C) and (D) are oblique images from 1980 and 2014 of a site that experienced a significant decline in lichen cover as dwarf shrub cover increased.
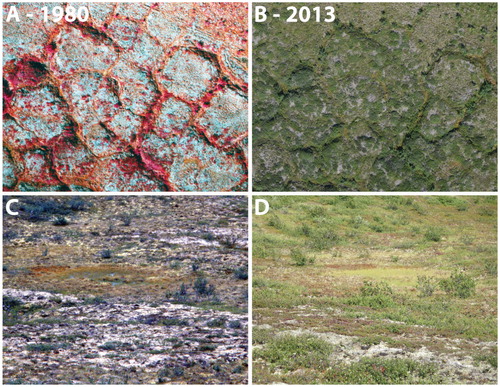
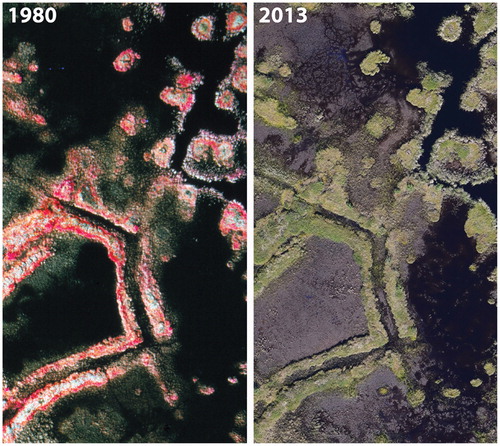
FIGURE 8. Part of a 1980 (color infrared) and 2013 (color) photo pair in an area of low-center polygonal terrain. Vegetation change in this terrain type was characterized by significant increases in dwarf shrub cover as well as significant declines in water. Both these changes are detectable in the photo pair, with dwarf shrub increases occurring on the high troughs between the low centers.
Drivers of Change
While the magnitude of change varied among terrain types, the consistency of shrub proliferation in all four distinct terrain types suggests that these changes were facilitated by widespread shifts in temperature and precipitation. This is consistent with Fraser et al.'s (Citation2014) observation that increases in the canopy cover of shrubs are associated with increases in productivity across 85% of the Tuktoyaktuk Coastlands, as well as Frost and Epstein's (2014) conclusion that widespread vegetation changes are likely indicative of large-scale climate dynamics.
The growing body of evidence demonstrating the influence of temperature and temperature-related feedbacks on shrub growth suggests that the vegetation changes we observed were partly driven by increased temperatures in the Tuktoyaktuk Coastlands. Air temperatures have increased by approximately 2 °C across the region since 1970 (CitationBurn and Kokelj, 2009), and it is likely that this change has impacted both shrub growth and recruitment (CitationLantz et al., 2010,Citation2012). Plot-scale warming studies have also shown clear connections between vascular plant expansion and increasing temperatures (CitationChapin et al., 1995; CitationWalker et al., 2006; CitationElmendorf et al., 2012b; CitationZamin et al., 2014).
It is possible that active layer deepening associated with warming (CitationÅkerman and Johansson, 2008; CitationBurn and Kokelj, 2009) has affected vegetation by increasing the amount of soil available for plant roots and by increasing nutrient availability and soil moisture. The notion that shrub proliferation has also been facilitated by increases in soil moisture is consistent with a circumpolar analysis of shrub growth rings showing greater climate sensitivity of shrub growth with increasing soil moisture (CitationMyers-Smith et al., 2015). Similar results indicating the positive influence of moisture on shrub growth have been described in tundra vegetation analyses at sites around the world (CitationElmendorf et al., 2012a; CitationLi et al., 2015; CitationCameron and Lantz, 2016). In comparison, substrate drying near Tasiilaq in southeastern Greenland is believed to be partly responsible for the relatively minor vegetation changes observed there, including small increases in some mosses and lichens (CitationDaniëls and de Molenaar, 2011).
FIGURE 9. Vertical and oblique photos showing vegetation change across shrub tundra terrain. Photos (A) and (B) show part of a 1980 (color infrared) and 2013 (color) photo pair demonstrating declines in lichen cover (top half of image pair) and increases in tall shrub cover (right side of image pair) since the 1980s. (C) and (D) are oblique images from 1980 and 2014 of a site where tall shrubs (mainly alder) have expanded since 1980.
In other regions, authors have emphasized the importance of herbivores and their impacts on vegetation, including their ability to (1) influence shrub proliferation through the fertilization of soils; (2) increase ground space for germination; and (3) facilitate shrub and lichen decline through trampling and grazing (CitationJørgensen et al., 2013; CitationManseau et al., 1996; CitationMyers-Smith et al., 2011). In the Tuktoyaktuk Coastlands, it is unlikely that shrub expansion and lichen decline were driven by caribou grazing and trampling because shrub increases were observed at sites with high and low historical lichen cover (CitationFraser et al., 2014).
Implications
Our analysis of repeat photos shows that shrub cover has increased significantly in all the major terrain types in the Tuktoyaktuk Coastlands. A change of this magnitude is likely to have a significant impact on a range of ecological processes including net primary productivity, nutrient cycling, carbon storage, surface-energy balance, and nearsurface ground temperatures (CitationSturm et al., 2001; CitationMyers-Smith et al., 2011; CitationElmendorf et al., 2012a; CitationLantz et al., 2012). As litter accumulates, shrub proliferation may also contribute to increased wildfire frequency and intensity, which will facilitate more widespread vegetation changes (CitationLantz et al., 2010; CitationHiguera et al., 2015). Regional climate, hydrology, permafrost temperatures, and terrain stability will also be impacted by altered microclimate conditions driven by increased shrub cover (CitationLantz et al., 2012). Significant declines in lichen cover and biomass between 1980 and 2013 have likely reduced habitat quality and the availability of food sources for caribou and reindeer (CitationWalsh et al., 1997; CitationJoly et al., 2007, Citation2009). These changes are also likely to negatively impact northern communities that rely on hunting and herding practices (CitationWalker et al., 2006). Additional investigations into the causes of landscape-scale variation in shrub proliferation are required in order to improve our interpretation of these observations. The use of high-resolution repeat photographs in this study suggests that ongoing work using repeat unmanned aerial vehicle (UAV) surveys to understand vegetation change has potential to make a significant contribution to our understanding of the fine-scale processes controlling Arctic vegetation change (CitationFraser et al., 2016).
Conclusions
Using high resolution repeat aerial photos, our analysis shows that vegetation change in the Tuktoyaktuk Coastlands has been driven by dwarf and tall shrub expansion, which has occurred in four terrain types (shrub tundra, tussock tundra, high-center polygonal terrain, and low-center polygonal terrain).Vegetation composition was also altered as a result of declines in lichen species, which occurred in three of the four terrain types.
Variation in the magnitude of observed changes was likely influenced by differences in the community composition and the availability of suitable microsites that provide suitable space for shrub expansion.
Large-scale factors such as climate warming and increased soil moisture have likely contributed the most to observed changes.
Acknowledgments
This work was supported by the Natural Sciences and Engineering Research Council of Canada; Polar Knowledge Canada (POLAR): Project 1516-121; the Polar Continental Shelf Program; the Canada Foundation for Innovation; and the NWT Cumulative Impact Monitoring Program. We would also like to thank Chanda Brietzke for assistance with georeferencing; Rebecca Segal for help with the figures; Pierre Berube, Robin Felix, Steve Kokelj, Abra Martin, Doug Panaktalok and Ciara Sharpe for assistance in the field; and two anonymous referees who provided helpful comments on the manuscript.
References Cited
- Agriculture and Agri-Food Canada , 2011: Soil landscapes of Canada (SLC): version 3.2. Canadian Soil Information System, National Soil DataBase, Government of Canada, http://sis.agr.gc.ca/cansis/nsdb/slc/index.html (accessed 15 April 2015).
- Åkerman, H. J. , and Johansson, M. , 2008: Thawing permafrost and thicker active layers in sub-Arctic Sweden. Permafrost and Periglacial Processes , 19: 279–292.
- Aylsworth, J. M. , Burgess, M. M. , Desrochers, D. T. , Duk-Rodkin, A. ., Robertson, T. , and Traynor, J. A. , 2000: Surficial geology, subsurface materials, and thaw sensitivity of sediments. In Dyke, L. D. and Brooks, G. R. (eds.), The Physical Environment of the Mackenzie Valley Northwest Territories: A Baseline for the Assessment of Environmental Change. Ottawa: Geological Survey of Canada, 41–48.
- Beck, P. S. A. , and Goetz, S. J. , 2011: Satellite observations of high northern latitude vegetation productivity changes between 1982 and 2008: ecological variability and regional differences. Environmental Research Letters , 6: 045501, doi http://dx.doi.org/10.1088/1748-9326/6/4/045501 .
- Bhatt, U. S. , Walker, D. A. , Raynolds, M. K. , Comiso, J. C. , Epstein, H. E. , Jia, G. , Gens, R. , Pinzon, J. E. , Tucker, C. J. , Tweedie, C. E. , and Webber, P. J. , 2010: Circumpolar Arctic tundra vegetation change is linked to sea ice decline. Earth Interactions , 14: 1–20.
- Blok, D. , Heijmans, M. M. P. D. , Schaepman-Strub, G. , Kononov, A. V. , Maximov, T. C. , and Berendse, F. , 2010: Shrub expansion may reduce summer permafrost thaw in Siberian tundra. Global Change Biology , 16: 1296–1305.
- Bret-Harte, M. S. , Shaver, G. R. , Zoerner, J. P. , Johnstone, J. F. , Wagner, J. L. , Chavez, A. S. , Gunkelman, R. F., IV, Lippert, S. C. , and Laundre, J. A. , 2001: Developmental plasticity allows Betula nana to dominate tundra subjected to an altered environment. Ecology , 82: 18–32.
- Burn, C. R. , and Kokelj, S. V. , 2009: The environment and permafrost of the Mackenzie Delta area. Permafrost and Periglacial Processes , 20: 83–105.
- Cameron, E. A. , and Lantz, T. C , 2016: Drivers of tall shrub proliferation adjacent to the Dempster Highway, Northwest Territories, Canada. Environmental Research Letters , 11: 045006, doi http://dx.doi.org/10.1088/1748-9326/11/4/045006 .
- Chapin, F. S., III , and Shaver, G. R. , 1996: Physiological and growth responses of Arctic plants to a field experiment simulating climatic change. Ecology , 77: 822–840.
- Chapin, F. S. III , and Shaver, G. R. , Giblin, A. E. , Nadelhoffer, K. J. , and Laundre, J. A. , 1995: Responses of Arctic tundra to experimental and observed changes in climate. Ecology , 76: 694–711.
- Cornelissen, J. H. C. , Callaghan, T. V. , Alatalo, J. M. , Michelsen, A. , Graglia, E. , Hartley, A. E. , Hik, D. S. , Hobbie, S. E. , Press, M. C. , Robinson, C. H. , Henry, G. H. R. , Shaver, G. R. , Phoenix, G. K. , Gwynn Jones, D. , Jonasson, S. , Chapin, F. S., III , Molau, U. , Lee, J.A. , Melillo, J. M. , Sveinbjörnsson , and Aerts, R. , 2001: Global change and Arctic ecosystems: Is lichen decline a function of increases in vascular plant biomass? Journal of Ecology , 89: 984–994.
- Daniëls, F. J. A. , and de Molenaar, J. G. , 2011: Flora and vegetation of Tasiilaq, formerly Angmagssalik, southeast Greenland: a comparison of data between around 1900 and 2007. Ambio , 40: 650–659.
- Daniëls, F. J. A. , de Molenaar, J. G. , Chytrý, M. , and Tichý, L. , 2011: Vegetation change in Southeast Greenland? Tasiilaq revisited after 40 years. Applied Vegetation Science , 14: 230– 241.
- Deslippe, J. R. , and Simard, S.W. , 2011: Below-ground carbon transfer among Betula nana may increase with warming in Arctic tundra. New Phytologist , 192: 689–698.
- Deslippe, J. R. , Hartmann, M. , Mohn, W. W. , and Simard, S. W. , 2011: Long-term experimental manipulation of climate alters the ectomycorrhizal community of Betula nana in Arctic tundra. Global Change Biology , 17: 1625–1636.
- Ecosystem Classification Group , 2012: Ecological Regions of the Northwest Territories—Southern Arctic. Yellowknife, NWT: Government of the Northwest Territories, Department of Environment and Natural Resources.
- Elmendorf, S. C. , Henry, G. H. R. , Hollister, R. D. , Björk, R.G. , Bjorkman, A.D. , Callaghan, T.V. , Collier, L.S. , Cooper, E.J. , Cornelissen, J.H.C, , Day, T.A. , Fosaa, A.M. , Gould, W.A. , Grétarsdóttir, J. , Harte, J. , Hermanutz, L. , Hik, D.S. , Hofgaard, A. , Jarrad, F. , Jónsdóttir, I.S. , Keuper, F. , Klanderud, K. , Klein, J.A. , Koh, S. , Kudo, G. , Lang, S.I. , Loewen, V. , May, J.L. , Mercado, J. , Michelsen, A. , Molau, U. , Myers-Smith, I.H. , Oberbauer, S.F. , Pieper, S. , Post, E. , Rixen, C. , Robinson, C.H. , Schmidt, N.M. , Shaver, G.R. , Stenström, A. , Tolvanen, A. , Totland, Ø. , Troxler, T. , Wahren, C. , Webber, P.J. , Welker, J.M. , and Wookey, P.A. , 2012a: Global assessment of experimental climate warming on tundra vegetation: heterogeneity over space and time. Ecology Letters , 15: 164–175.
- Elmendorf, S. C. , Henry, G. H. R. , Hollister, R. D. , Björk, R. G. , Boulanger-Lapointe, N. , Cooper, E.J. , Cornelissen, J.H.C. , Day, T.A. , Dorrepaal, E. , Elumeeva, T.G. , Gill, M. , Gould, W.A. , Harte, J. , Hik, D.S. , Hofgaard, A. , Johnson, D.R. , Johnstone, J.F. , Jónsdóttir, I.S. , Jorgenson, J.C. , Klanderud, K. , Klein, J.A. , Koh, S. , Kudo, G. , Lara, M. , Lévesque, E. , Magnússon, B. , May, J.L. , Mercado-Díaz, J. A. , Michelsen, A. , Molau, U. , Myers-Smith, I.H. , Oberbauer, S. E. , Onipchenko, V.G. , Rixen, C. , Schmidt, N.M. , Shaver, G.R. , Spasojevic, M.J. , Þórhallsdóttir, Þ.E. , Tolvanen, A. , Troxler, T. , Tweedie, C.E. , Villareal, S. , Wahren, C. , Walker, X. Webber, P.J. , Welker, J.M. , and Wipf, S. , 2012b: Plot-scale evidence of tundra vegetation change and links to recent summer warming. Nature Climate Change , 2: 453–457.
- Elven, R. , Murray, D. F. , Razzhivin. V.Y ., and Yutsev, B.A. , 2011: Annotated checklist of the Panarctic flora (PAF): vascular plants version 1.0, http://nhm2.uio.no/paf (accessed 17 June 2016).
- Epstein, H. E. , Beringer, J. , Gould, W. A. , Lloyd, A. H. , Thompson, C. D. , Chapin, F. S., III , Michaelson, G. J. , Ping, C. L. , Rupp, T. S. , and Walker, D. A. , 2004: The nature of spatial transitions in the Arctic. Journal of Biogeography , 31: 1917–1933.
- Forbes, B. C. , Macias-Fauria, M. , and Zetterberg, P. , 2010: Russian Arctic warming and “greening” are closely tracked by tundra shrub willows. Global Change Biology , 16: 1542–1554.
- Fraser, R. H. , Olthof, I. , Carrière, M. , Deschamps, A. , and Pouliot, D. , 2011: Detecting long-term changes to vegetation in northern Canada using the Landsat satellite image archive. Environmental Research Letters , 6: 045502, doi http://dx.doi.Org/10.1088/1748-9326/6/4/045502 .
- Fraser, R. H. , Lantz, T. C. , Olthof, I. , Kokelj, S.V. , and Sims, R. A. , 2014:Warming-induced shrub expansion and lichen decline in the western Canadian Arctic. Ecosystems , 17: 1151–1168.
- Fraser, R. H. , Olthof, I. , Lantz, T. C. , and Schmitt, C. , 2016: UAV photogrammetry for mapping vegetation in the low-Arctic. Arctic Science , 20 June: doi http://dx.doi.org/10.1139/AS-2016-0008
- Frost, G. V. , and Epstein, H. E. , 2014: Tall shrub and tree expansion in Siberian tundra ecotones since the 1960s. Global Change Biology , 20: 1264–1277.
- Gamon, J. A. , Kershaw, G. P. , Williamson, S. , and Hik, D. S. , 2012: Microtopographic patterns in an Arctic baydjarakh field: Do fine-grain patterns enforce landscape stability? Environmental Research Letters , 7: 015502, doi http://dx.doi.org/10.1088/1748-9326/7/1/015502 .
- Gill, H. K. , Lantz, T. C. , O'Neill, B. , and Kokelj, S.V. , 2014: Cumulative impacts and feedbacks of a gravel road on shrub tundra ecosystems in the Peel Plateau, Northwest Territories, Canada. Arctic, Antarctic, and Alpine Research , 46: 947–961.
- Henry, G. H. R. , Harper, K. A. , Chen, W. , Deslippe, J. R. , Grant, R. F. , Lafleur, P. M. , Lévesque, E. , Siciliano, S. D. , and Simard, S. W. , 2012: Effects of observed and experimental climate change on terrestrial ecosystems in northern Canada: results from the Canadian IPY program. Climatic Change , 115: 207–234.
- Higuera, P. E. , Abatzoglou, J. T. , Littell, J. S. , and Morgan, P. , 2015: The changing strength and nature of fire-climate relationships in the northern Rocky Mountains, U.S.A., 1902–2008. PloS One , 10:e0127563, doi http://dx.doi.org/10.1371/journal.pone.0127563 .
- Hollister, R. D. , May, J. L. , Kremers, K. S. , Tweedie, C. E. , Oberbauer, S. F. , Liebig, J. A. , Botting, T. F. , Barrett, R. T. , and Gregory, J. L. , 2015: Warming experiments elucidate the drivers of observed directional changes in tundra vegetation. Ecology and Evolution , 5: 1881–1895.
- Hudson, J. M. G. , and Henry, G. H. R. , 2010: High Arctic plant community resists 15 years of experimental warming. Journal of Ecology , 98: 1035–1041.
- Joly, K. , Jandt, R. R. , Meyers, C. R. , and Cole, M. J. , 2007: Changes in vegetative cover on Western Arctic Herd winter range from 1981 to 2005: potential effects of grazing and climate change. Rangifer , 27: 199–207.
- Joly, K. , Jandt, R. R. , and Klein, D. R. , 2009: Decrease of lichens in Arctic ecosystems: the role of wildfire, caribou, reindeer, competition and climate in north-western Alaska. Polar Research , 28: 433–442.
- Jónsdóttir, I. S. , Magnússon, B. , Gudmundsson, J. , Elmarsdóttir, A. , and Hjartarson, H. , 2005: Variable sensitivity of plant communities in Iceland to experimental warming. Global Change Biology , 11: 553–563.
- Jørgensen, R. H. , Meilby, H. , and Kollmann, J. , 2013: Shrub expansion in SW Greenland under modest regional warming: disentangling effects of human disturbance and grazing. Arctic, Antarctic, and Alpine Research , 45: 515–525.
- Kokelj, S.V. , and Burn, C. R. , 2004: Tilt of spruce trees near ice wedges, Mackenzie Delta, Northwest Territories, Canada. Arctic, Antarctic, and Alpine Research , 36: 615–623.
- Kokelj, S.V. , Lantz, T. C. , Wolfe, S. A. , Kanigan, J. C. , Morse, P. D. , Courts, R. , Molina-Giraldo, N. , and Burn, C. R. , 2014: Distribution and activity of ice wedges across the forest-tundra transition, western Arctic Canada. Journal of Geophysical Research: Earth Surface , 119: 2032–2047.
- Lantz, T. C. , Gergel, S. E. , and Henry, G. H. R. , 2010: Response of green alder (Alnus viridis subsp. fruticosa) patch dynamics and plant community composition to fire and regional temperature in north-western Canada. Journal of Biogeography , 37: 1597–1610.
- Lantz, T. C. , Marsh, R. , and Kokelj, S. V. , 2012: Recent shrub proliferation in the Mackenzie Delta Uplands and microclimatic implications. Ecosystems , 16: 47–59.
- Li, B. , Heijmans, M. M. P. D. , Berendse, F. , Blok, D. , Maximov, T. , and Sass-Klaassen, U. , 2015: The role of summer precipitation and summer temperature in establishment and growth of dwarf shrub Betula nana in northeast Siberian tundra. Polar Biology , 39(7): 1245–1255, doi http://dx.doi.org/10.1007/s00300-015-1847-0 .
- Littell, R. C. , Milhken, G. A. , Stroup, W. W. , Wolfinger, R. D , and Schabenberger, O. , 2006: SAS for Mixed Models. Second edition. North Carolina: SAS Institute.
- Mack, M. C. , Schuur, E. A. G. , Bret-Harte, M. S. , Shaver, G. R. , and Chapin, F. S., III , 2004: Ecosystem carbon storage in Arctic tundra reduced by long-term nutrient fertilization. Nature , 431: 440–443.
- Mackay, J. R. , 1980: The origin of hummocks, western Arctic coast, Canada. Canadian Journal of Earth Sciences , 17: 996– 1006.
- Manseau, M. , Huot J. , and Crete, M. , 1996: Effects of summer grazing by caribou on composition and productivity of vegetation: community and landscape level. Journal of Ecology , 84: 503–513.
- Marsh, P. , Bartlett, P. , MacKay, M. , Pohl, S. , and Lantz, T. , 2010: Snowmelt energetics at a shrub tundra site in the western Canadian Arctic. Hydrological Processes , 24: 3603–3620.
- Myers-Smith, I. H. , Forbes, B. C. , Wilmking, M. , Hallinger, M. , Lantz, T. , Blok, D. , Tape, K.D. , Macias-Fauria, M. , Sass-Klaassen, U. , Lévesque, E. , Boudreau, S. , Ropars, P. , Hermanutz, L. , Trant, A. , Siegwart Collier, L. , Weijers, S. , Rozema, J. , Rayback, S.A. , Schmidt, N.M. , SchaepmanStrub, G. , Wipf, S. , Rixen, C. , Ménard, C.B. , Venn, S. , Goetz, S. , Andreu-Hayles, L. , Elmendorf, S. , Ravolainen, V. , Welker, J. , Grogan, P. , Epstein, H.E. , and Hik, D.S. , 2011: Shrub expansion in tundra ecosystems: dynamics, impacts and research priorities. Environmental Research Letters , 6: 045509, doi http://dx.doi.org/10.1088/1748-9326/6/4/045509 .
- Myers-Smith, I. H. , Elmendorf, S. C. , Beck, P. S. A. , Wilmking, M. , Hallinger, M. , Blok, D. , Tape, K.D. , Rayback, S. A. , Macias-Fauria, M. , Forbes, B.C. , Speed, J.D.M. , Boulanger-Lapointe, N. , Rixen, C. , Lévesque, E. , Schmidt, N.M. , Baittinger, C. , Trant, A.J. , Hermanutz, L. , Siegwart Collier, L. , Dawes, M.A. , Lantz, T.C. , Weijers, S. , Jørgensen, R.H. , Buchwal, A. , Buras, A. , Naito, A.T. , Ravolainen, V. , Schaepman-Strub, G. , Wheeler, J.A. , Wipf, S. , Guay, K.C. , Hik, D.S. and Vellend, M. , 2015: Climate sensitivity of shrub growth across the tundra biome. Nature Climate Change , 5: 887–891.
- Myneni, R. B. , Keeling, C. D. , Tucker, C. J. , Asrar, G. , and Nemani, R. R. , 1997: Increased plant growth in the northern high latitudes from 1981 to 1991. Nature , 386: 698–702.
- Nauta, A. L. , Heijmans, M. M. P. D. , Blok, D. , Limpens, J. , Elberling, B. , Gallagher, A. , Li, B. , Petrov, R. E. , Maximov, T. C. , van Huissteden, J. , and Berendse, F. , 2015: Permafrost collapse after shrub removal shifts tundra ecosystem to a methane source. Nature Climate Change , 5: 67–70.
- Northwest Territories Centre for Geomatics , 2004: Web Map Services (WMS): Mackenzie Valley OrthoPhoto Cached Mosaic Service. Government of Northwest Territories, http://www.geomatics.gov.nt.ca/wms_chartop.aspx?i=3 (accessed 15 April 2015).
- Olthof, I. , Pouliot, D. , Latifovic, R. , and Chen, W. , 2008: Recent (1986–2006) vegetation- specific NDVI trends in northern Canada from satellite data. Arctic , 61: 381–394.
- Prach, K. , Košnar, J. , Klimešová, J. , and Hais, M. , 2009: High Arctic vegetation after 70 years: a repeated analysis from Svalbard. Polar Biology , 33: 635–639.
- Rampton, V. N. , 1988: Quaternary Geology of the Tuktoyaktuk Coastlands, Northwest Territories. Geological Survey of Canada, Energy, Mines and Resources Canada, Memoir No. 423.
- Sims, R. A. , 1983: Ground-Truth and Large-Scale 70 mm Aerial Photographs in the Study of Reindeer Winter Rangeland, Tuktoyaktuk Peninsula Area, N.W.T. Ph.D. thesis, Department of Forestry/Remote Sensing, University of British Columbia, Vancouver.
- Steedman, A. E. , Lantz, T. C. , and Kokelj, S.V. , 2016: Spatiotemporal variation in high-centre polygons and ice-wedge melt ponds, Tuktoyaktuk Coastlands, Northwest Territories. Permafrost and Periglacial Processes , 6 January: doi http://dx.doi.org/10.1002/ppp . 1880.
- Sturm, M. , Racine, C. , and Tape, K. , 2001: Climate change: increasing shrub abundance in the Arctic. Nature , 411: 546– 547.
- Tape, K. , Sturm, M. , and Racine, C. , 2006: The evidence for shrub expansion in northern Alaska and the Pan-Arctic. Global Change Biology , 12: 686–702.
- Tarnocai, C. , and Zoltai, S. C. , 1978: Earth hummocks of the Canadian Arctic and Subarctic. Arctic and Alpine Research , 10: 581–594.
- Walker, D. A. , Raynolds, M. K. , Daniëls, F. J. A. , Einarsson, E. , Elvebakk, A. , Gould, W. A. , Katenin, A. E. , Kholod, S. S. , Markon, C. J. , Melnikov, E. S. , Moskalenko, N. G. , Talbot, S. S. , and Yurtsev, B. A. , 2005: The circumpolar Arctic vegetation map. Journal of Vegetation Science , 16: 267–282.
- Walker, M. D. , Wahren, C.H. , Hollister, R. D. , Henry, G.H.R. , Ahlquist, L.E. , Alatalo, J.M. , Bret-Harte, M.S. , Calef, M.P. , Callaghan, T.V. , Carroll, A.B. , Epstein, H.E. , Jónsdóttir, I.S. , Klein, J.A. , Magnússon, B. , Molau, U. , Oberbauer, S.F. , Rewa, S.P. , Robinson, C.H. , Shaver, G.R. , Suding, K.N. , Thompson, C.C. , Tolvanen, A. , Totland, ø. , Turner, P.L. , Tweedie, C.E. , Webber, P.J. , and Wookey, P.A. , 2006: Plant community responses to experimental warming across the tundra biome. Proceedings of the National Academy of Sciences of the United States of America , 103: 1342–1346.
- Walsh, N.E. , McCabe, T.R. , Welker, J. M. , and Parsons, A. N. , 1997: Experimental manipulations of snow-depth: effects on nutrient content of caribou forage. Global Change Biology , 3:158–164.
- Zamin, T. J. , Bret-Harte, M. S. , and Grogan, P. , 2014: Evergreen shrubs dominate responses to experimental summer warming and fertilization in Canadian mesic low Arctic tundra. Journal of Ecology , 102: 749–766.