
ABSTRACT
Recent studies suggest that climate changes may have a strong impact on the vegetation composition in Arctic ecosystems, causing increasing dominance of woody species. Evidence from short-term studies on the effects of herbivory indicates that this effect may be counteracted by grazing, but it has not yet been studied whether the effect is persistent and general. Here, we present the results from a large-scale, long-term study of the effects of sheep grazing and climate on the relative dominance of woody plants, graminoids, and forbs. The study is based on exclosures established from 1984 onward across a climatic gradient in South Greenland. The relative cover of the three plant functional types was modeled in a state-space model. There was no significant overall change in the relative cover of the three groups, although such changes occurred intermittently on some sites. This suggests that the relative dominance of the plant functional types is resilient to the impacts of grazing and climate changes in the tundra of South Greenland in line with other studies from sites where summer temperatures have not increased.
Introduction
Over the past century, temperatures in the Arctic have increased dramatically (CitationLarsen et al., 2014) and, at the same time, shrubs have become increasingly dominant in the Arctic tundra (CitationTape et al., 2006; CitationMyers-Smith et al., 2011, Citation2015). The expansion of shrubs (particularly deciduous shrubs) may be directly linked to the increasing temperatures (CitationChapin et al., 1995; CitationPost and Pedersen, 2008) but may also be associated with increased snow cover induced by the shrubs themselves (CitationSturm et al., 2005). The increasing dominance of shrubs is expected to have a strong impact on the diversity and function of Arctic ecosystems (CitationCallaghan et al., 2004; CitationWalker et al., 2006), as well as on the vegetation's ability to act as a carbon sink (CitationCahoon et al., 2012). Although tundra ecosystems appear to be strongly influenced by climate changes, how climate interacts with other biotic and abiotic factors to shape the long-term balance between shrubs, forbs, and graminoids in the Arctic tundra is not fully understood.
Herbivory is one of the factors known to have a large impact on how Arctic vegetation responds to climate changes (CitationMyers-Smith et al., 2011; CitationSaito et al., 2013). Grazing by large herbivores has been demonstrated to counteract the spread of shrubs in some areas (CitationManseau et al., 1996; CitationPost and Pedersen, 2008; CitationOlofsson et al., 2009; CitationPost et al., 2009). In some areas, grazing increases the overall productivity of the tundra (CitationOlofsson et al., 2001; CitationGough et al., 2012), although the opposite trend is found in others (CitationBråthen et al., 2007). Plant species that are not consumed by the herbivores gain a competitive advantage, as do species that are resilient to grazing (CitationCrawley, 1983; CitationManseau et al., 1996). Exclosure studies from northern Scandinavia and Alaska have shown graminoids to be favored by reindeer/caribou grazing (CitationPost and Klein, 1996; CitationOlofsson et al., 2001), whereas the growth of palatable shrubs may be reduced (Citationden Herder et al., 2008; CitationKitti et al., 2009; CitationZamin and Grogan, 2013; CitationBryant et al., 2014; CitationChristie et al., 2015). In Greenland, exclosure experiments have similarly indicated that herbivory can reduce the spread of shrubs (CitationPost and Pedersen, 2008).
Although heating and exclosure experiments provide a unique understanding of the mechanisms that control vegetation dynamics in the Arctic tundra, they often suffer from being of relatively short duration. The positive growth responses observed in some heating experiments (CitationArft et al., 1999) may be of a transient nature due to limited nutrient availability, and the long-term changes in the Arctic vegetation may be more influenced by climatic extremes than by average temperatures. Further, the effects of increasing temperatures are likely to depend on local microclimatic conditions (CitationCahoon et al., 2012). Although large-scale, long-term studies are therefore essential for ensuring that an observed ecosystem effect of grazing or climate changes is general (e.g.,CitationTurkington, 2009), only few such data sets are available from the Arctic region (CitationMulder, 1999). In this study, we summarized the long-term changes in the plant community across a large-scale climatic gradient based on the cover of the three most important functional types (woody plants, graminoids, and forbs).
We used exclosures to investigate how the relative cover of the most important types of plants was affected by sheep grazing and climate in South Greenland. The experiment, which was initiated in 1984, included plots established across a wide range of climatic conditions and covered a period where increasing temperatures could be expected to cause a gradual shift in the plant community composition. Plant cover—that is, the relative area covered by different plant species in a plot—is an important characteristic of the composition of plant communities (CitationKent and Coker, 1992; CitationDamgaard, 2013, Citation2014). The objectives of the study were to quantify the observed changes in the relative cover of the three most important functional types in an Arctic ecosystem and estimate the possible effects of (1) sheep grazing and (2) climate changes on plant community composition in order to investigate the importance of grazing as a top-down regulating mechanism on Arctic vegetation and, more specifically, to determine whether grazing has been able to counteract the expected increase in shrub cover due to climate change. The study included plots spanning the entire coast to inland gradient in South Greenland in order to test if the effects of climate changes and grazing were influenced by local climatic conditions and to ensure the generality of our results (objective 3). We use state-space models to analyze the repeated measurement of plant cover (CitationDamgaard, 2012, Citation2015).
Materials and Methods
Site
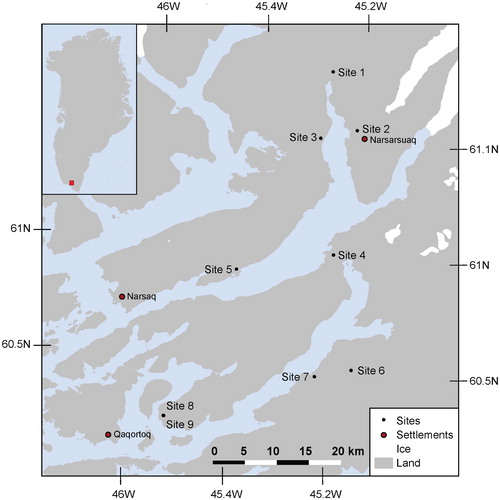
Data for the present study were collected at nine different sites in the sheep farming district in South Greenland (, ). The vegetation in this region is characterized by dwarf-shrub heaths (CitationAustrheim et al., 2008), although some areas have been converted to farmland with distinct pastures. Each site included one ungrazed plot (inside a fenced exclosure) and one grazed plot in areas with natural vegetation. The two plots on each site were chosen within the same vegetation type based on species composition and less than 300 m apart. The exclosures were established over a period of several years starting in 1984. All exclosures were revisited two to five times during 1988–2012 (). A11 plots were permanently marked with metal sticks. In the period 1984–2012 the average annual temperature has increased by ∼0.1 °C per year in the nearby towns Narsarsuaq and Qaqortoq (CitationCappelen, 2015).
The main herbivore in the area is sheep. In recent years, livestock have been introduced, but in fairly low numbers. Icelandic horses are kept at the farms and used when the sheep are gathered in late summer for slaughtering. Further, Arctic hares are present in the area, but their impact on vegetation is expected to be very limited.
FIGURE 1. Study sites in South Greenland marked by dots (see for further explanation).
Data Sampling
Plant Cover Data
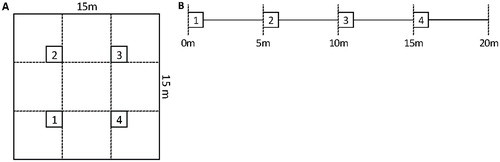
The cover of the different plant species was measured using the pinpoint method (CitationKent and Coker, 1992). In each pinpoint analysis, a 1 m2 square was analyzed using a frame with a fixed grid pattern (a total of 100 equally spaced points), which was placed above the vegetation. A pin was inserted vertically through each grid intersection, and the first species that was hit by the pin was recorded (the species at the top level). A total of four pinpoint frames with fixed positions were analyzed per plot at each visit (5 m apart along a 20 m transect or in a 15 × 15 m square in the vegetation; ).
To study the effects of grazing and climate on the relative cover of different types of plants, the plants were divided into three functional types: woody plants, graminoids, and forbs. The woody plants included the deciduous species Salix spp., Betula spp., Vaccinium spp., and the evergreen species Thymus praecox, Rhododendron lapponicum, Harrimanella hypnoides, Juniperus communis, and Empetrum nigrum. The evergreen species constituted only 8% of the woody plants, which was insufficient to analyze these as a separate functional type. The graminoid group constituted grasses, sedges, and rushes (Poaceae, Carex spp., and Juncaceae, respectively), and the forbs included, for example, Equisetum spp., Potentilla spp. and Rumex spp. Some pins in the pinpoint analyses did not hit a species that belonged to any of these functional types, and these were categorized as “other” (this type included mosses, lichens, decomposing organic material, rock, bare soil, and water). The vegetation on the dwarf-shrub heaths was generally lower than 50 cm, but when shrubs reached a height of >50 cm only the vegetation below 50 cm was analyzed. A complete list of plant species determined in the pinpoint analyses can be found in Appendix .
TABLE 1 Overview of plots with information on geographical area, study site, years vegetation analyses were conducted, whether the plot was inside (YES) or outside (NO) an exclosure, and location (in decimal degrees).
Grazing Data
The sheep farming district in South Greenland is divided into a number of grazing areas of different sizes. A record of the number of sheep per grazing area is kept at the Agricultural Consulting Services, Qaqortoq. The size of the grazing areas was calculated using data from NunaGIS (http://dk.nunagis.gl, Government of Greenland) and updated based on information from the Agricultural Consulting Services (A. Frederiksen, personal communication). No general trend in grazing intensity was observed on any of the nine sites over time, but ranged between 2 and 20 sheep km-2.
Climate Data
As observed climate data are unavailable for our specific study sites, we used modeled climate variables for the period 1989–2012 to account for spatial differences in precipitation and snow cover among the sites. These data were used to investigate if the effects of grazing and climate changes were influenced by local climatic conditions (objective 3). The regional climate model HIRHAM5 (CitationChristensen et al., 2006) was run over a Greenland wide domain at 5 km horizontal resolution, allowing a detailed representation of the spatial variations in the area over time (CitationLucas-Picher et al., 2012). Forced by weather reanalysis (ERA-interim, CitationDee et al., 2011) on the boundaries of its domain, the climate model reproduces weather variations on daily and interannual timescales (CitationLangen et al., 2015). We extracted the following variables that were expected to be of biological relevance from the modeled climate variables: mean July temperature, mean January temperature, mean annual precipitation, number of frost-free days, and number of days with snow cover. Over the period where modeled climate variables were available, both the mean annual precipitation and number of days with snow cover decreased, whereas there were no clear trends for number of frost-free days and mean July temperature (see Supporting Online Material, ). The extracted climate variables were summarized using a principal components analysis (PCA). In total, the first two components of the PCA captured 64% of the variance in the climate variables. The first component was positively correlated with annual precipitation (r = 0.76) and negatively with number of frost-free days (r = -0.70) and mean January temperature (r = -0.55). The second component was most strongly correlated with the mean July temperature (r = 0.92). In order to further simplify the data structure, we calculated the average scores for each of the two principal components for each site. This yielded two time invariant measures of the climate on each site. The two components of the PCA therefore only describe spatial variations in climate, not the temporal variations. These were used in the following analyses.
FIGURE 2. Sampling design and position of pinpoint frames (a) in a 15 × 15 m square or (b) along a 20 m transect. The numbered squares correspond to pinpoint frame 1–4.
Trend Analysis Using State-Space Models
A state-space model consists of a structural equation, where the processes that control the change in the mean plant cover over time are modeled, and a measurement equation, where the observations or measurements are coupled to the latent variables—that is, the unknown mean cover at plot j at observation time t. The state-space model may be viewed as a Bayesian generalization of a mixed effects model where the random effects are modeled by the latent variables.
Structural Equation
The structural equation consists of a deterministic part that describes the expected change in cover, and a stochastic part, which describes the variation in the change. The unknown cover of plant functional type i at plot j in year t is modeled by latent variables and denoted xi,j,t
and it is assumed that the change in the logit-transformed cover, ![]() , of each functional type between two visits to a site is modeled by:
, of each functional type between two visits to a site is modeled by:
where Δ
i
is the expected annual change in logit transformed vegetation cover of functional type i from t
1 to t
2. The structural variance is modeled by a random Gaussian walk process with an annual step size of ![]() , where
, where ![]() is the structural variation of functional type i.
is the structural variation of functional type i.
It was tested whether the expected annual change in logit transformed vegetation cover depended on one or more of the following drivers: (i) the mean grazing intensity at plot j between t 1 and t 2 (g j,t ) (objective 1 of the study), (ii) the first principal climate component at plot j (PC1 j , iii) the second principal climate component at plot j (PC2 j ) (to address objective 3 of our study). This was done by fitting the following hierarchical submodels of the expected annual change to the data:
where α
i
measures the unexplained change in the cover of functional type i over time, β
i
measures the effect of grazing, γ
i
measures the effect of the first principal climate component, δ
i
measure the effect of the second principal climate component, and ![]() i
, ϑ
i
measure the interaction among the effects of grazing and each of the climate components. Equations 2a and 2b both describe the changes in relative plant cover through time without accounting for effects of variations in local climatic conditions. The possible influence of climate changes is modeled by α
i
in both models (objective 2), but only Equation 2b includes effects of grazing. If Equation 2b is better supported by data than Equation 2a (based on DIC, see below), it suggests that grazing can counteract the impact of climate changes on the plant cover. Notice that accepting null hypothesis (2a) indicates that the system is resilient toward grazing.
i
, ϑ
i
measure the interaction among the effects of grazing and each of the climate components. Equations 2a and 2b both describe the changes in relative plant cover through time without accounting for effects of variations in local climatic conditions. The possible influence of climate changes is modeled by α
i
in both models (objective 2), but only Equation 2b includes effects of grazing. If Equation 2b is better supported by data than Equation 2a (based on DIC, see below), it suggests that grazing can counteract the impact of climate changes on the plant cover. Notice that accepting null hypothesis (2a) indicates that the system is resilient toward grazing.
Contrary to most commonly used vegetation and species distribution models, it is important to notice that here it is the change in the relative cover of the functional types that is modeled. This means that the null hypothesis of a resilient ecosystem with no vegetation changes is tested directly in the first model (2a). In the second model (2b), it is tested if the local grazing intensity has an effect on the observed vegetation changes. The third model (Equation 2c) accounts for the spatial variation in climate conditions among plots (and possibly additional factors that covary with the climatic gradients) after accounting for effects of grazing. Equation 2d includes the interaction effects between grazing and climate. If model 2d is better than 2c it suggests that the effects of grazing vary depending on the local climatic conditions (hence it addresses our objective 3).
Measurement Equation
Since the latent cover variables were modeled independently for each of the permanent plots, it is assumed that the observed number of pinpoint hits for the four functional types in a given year and plot is distributed according to the multinomial distribution:
where Yi,j,t is the observed number of pinpoint hits for vegetation type i at plot j and year t, n is the total number of hits, and Xi,j,t is the vector of latent variables that model the probabilities of hitting one of the four functional types, respectively, with a pin at plot j and year t.
Estimation, Statistical Inference, and Model Comparison
The model was parameterized using numerical Bayesian methods, where the joint posterior distribution of the parameters and the latent variables were calculated using Markov Chain Monte Carlo (MCMC; Metropolis-Hastings) simulations (CitationCarlin and Louis, 1996) with normal candidate distributions from 90,000 MCMC iterations after 10,000 burn-in iterations. The prior distributions of all parameters were assumed to be uniformly distributed in their domain. The domain of the latent cover variables was assumed to be [1/4n, 1-1/4n].
Plots of the sampling chains of all parameters and latent variables were inspected in order to check the mixing properties of the used sampling procedure and the overall fitting properties of the model. The efficiency of the MCMC procedure was also assessed by inspecting the evolution in the model deviance.
Statistical inferences were based on the 95% credibility intervals of the marginal posterior distributions and the calculated change in cover in a given grazing and climate scenario. Different models were compared using (i) the deviance information criterion (DIC), which is the mean deviance, -2 log (Y|![]() ), of the MCMC run plus the “effective” number of free parameters that are also calculated from the MCMC run (CitationSpiegelhalter et al., 2002); similarly, as for Akaike information criterion (AIC), the preferred model is the one with the minimum DIC value, and (ii) a stochastic search variable selection method with a slab standard deviation that was set to 100 times larger than the spike standard deviation (CitationO'Hara and Sillanpää, 2009).
), of the MCMC run plus the “effective” number of free parameters that are also calculated from the MCMC run (CitationSpiegelhalter et al., 2002); similarly, as for Akaike information criterion (AIC), the preferred model is the one with the minimum DIC value, and (ii) a stochastic search variable selection method with a slab standard deviation that was set to 100 times larger than the spike standard deviation (CitationO'Hara and Sillanpää, 2009).
TABLE 2 Deviance information criterion (DIC) for the four models of the expected annual change of the four vegetation types (Models 2a, 2b, 2c, 2d).
All calculations were done with Mathematica (CitationWolfram, 2013).
Results
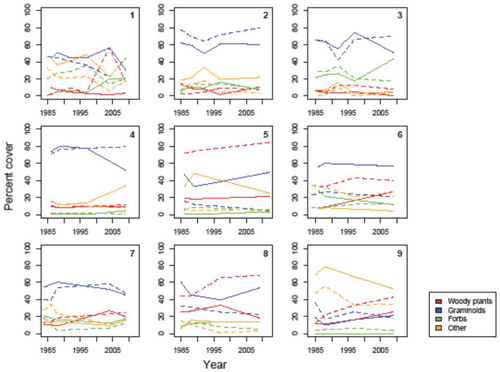
We did not find any significant changes in the relative cover of the different functional types during the 28-year observation period, which suggests that climate changes have not had a major impact on the plant community composition in South Greenland (objective 2). In model 2a, which was the model best supported by the observed vegetation data (i.e., it had the lowest DIC; ), there was no significant changes in the relative cover of any of the different functional types (). The model that included grazing (model 2b) was the second best supported model (). The lack of support for model 2b (which addresses objective 1 of the study) did not match our expectation that shrubs had become increasingly dominant in the plots where grazing stopped ca. 28 yr ago. There was even less support for the model where variations in local climatic conditions were taken into account (model 2c) or where the effect of grazing was allowed to vary among sites with different climatic conditions (model 2d); hence we have no reason to believe that our findings are not general (objective 3). In order to test the robustness of the DIC-based model comparison, which has been criticized when comparing mixed models (CitationCeleux et al., 2006), we validated our finding using the stochastic search variable selection method (CitationO'Hara and Sillanpää, 2009), which yielded qualitatively similar results. Although the grazed plots appeared to be less dominated by woody plants in some sites (site 5 and 8; ), the relative dominance of woody and nonwoody plants had not changed since the exclosures were established on any of the study sites. Graminoids, which was the group expected to be most favored by grazing, had not become less dominant in any of the ungrazed plots.
TABLE 3 Percentiles of the marginal posterior distributions of the parameters for the best statistical model (Model 2a) for the three functional types (and the residual group “other”).
FIGURE 3. Variations in observed plant cover of three plant functional types (woody plants, graminoids, forbs) at the nine study sites (1–9). Unbroken lines indicate plant cover in grazed areas (outside exclosure) and dashed lines indicate plant cover inside exclosures.
On the sites where comparable photos were available from 2009 and up to 23 years earlier, the shrub cover did not appear to have increased in the ungrazed plots either (), suggesting that the findings based on the pinpoint plots are similar for the areas surrounding the plots as well. The increasing occurrence of large shrubs, which is another expected consequence of climate changes in the Arctic, was not evident from the photos. The cover had not changed consistently on the grazed plots either ().
Although the relative cover of shrubs and other plant functional types appears to be resilient to the presence of grazing (as indicated by the high DIC for model 2b, which included grazing; ), we used the model that included grazing to quantify the yearly changes in relative cover of the different functional types after accounting for possible minor effects of grazing. The Bayesian marginal posterior distributions of the parameters for model 2b are shown in . The marginal posterior distribution indicated a close to significant increase in the cover of woody plants in the absence of grazing (; P = 0.06, inferred from the parameter that measures the effect of grazing in ;). P (αwoody plants > 0) = 0.94) This corresponds to a median yearly increase of 0.03 in the cover of woody plants on a logit-transformed scale (). The dominance of shrubs decreased with grazing intensity (P(βwoody plants > 0)= 0.17), but the uncertainty in the estimated expected change in vegetation cover was considerable as a result of the relatively low number of plots with high grazing intensity The structural variation in the measured effects of grazing, as measured by σ i , was generally high (ranging from 0.2 to 0.3; ). This variation is probably mainly due to variation among sampling periods and variation among sites that could not be explained by grazing and the two climate predictors.
FIGURE 4. The expected annual change in logit-transformed vegetation cover as a function of the grazing intensity (sheep km-2). The median (black lines) and 95% credibility interval of the expected annual change in vegetation cover (gray-shaded areas) were calculated from the Bayesian joint posterior distributions of the parameters.
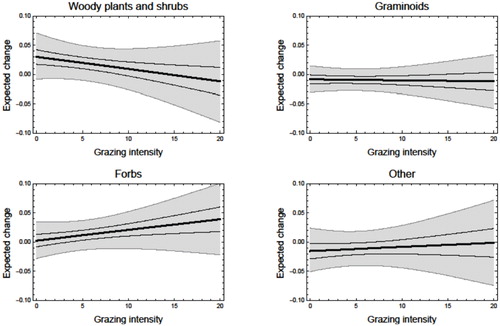
TABLE 4 Percentiles of the marginal posterior distributions of the parameters for the model including a grazing effect but no climate variables (Model 2b) for the three functional types (and the residual group “other”).
Discussion
Contrary to our expectations, we did not find any evidence that the climate changes that have been observed in South Greenland over the past 28 years have had a major effect on the relative dominance of plant functional types (woody plants, graminoids, and forbs) (). There were only minor differences between grazed and ungrazed plots (), so the lack of an overall change in the vegetation composition was not due to increased “shrubification” in ungrazed plots that was balanced out by decreasing dominance of woody plants in grazed plots. This addresses objectives 1 and 2 of our study. This indicates that the shrub-dominated tundra in South Greenland has been resilient to climate change seen in South Greenland until now, and to a large extent also to the present grazing pressure. A possible explanation for this resilience could be the modest increase in summer temperatures observed in the area, as also suggested by Elmendorf et al. (Citation2012). The resilience of the vegetation to grazing and climate changes that we observed in South Greenland is contrary to the trend of shrub expansion seen in many Arctic and subarctic regions, a trend that has been connected to climate change (e.g., CitationTape et al., 2006; CitationMyers-Smith et al., 2011; CitationRundqvist et al., 2011; CitationNormand et al., 2013). Jørgensen et al. (Citation2013) suggested a similar increase in shrub cover. The lack of an effect of grazing in our study also differs from several studies, where grazing by large herbivores has been observed to be able to reverse “shrubification” that has been associated with climate changes (e.g., Citationden Herder et al., 2008; CitationOlofsson et al., 2009; CitationZamin and Grogan, 2013).
The local climatic conditions did not affect the relative dominance of the different plant types overtime in our study, suggesting that the combined impacts of climate changes and grazing were the same for the entire region (objective 3). The lack of added explanatory value of model 2c (that included spatial variation in climate, but no interactions with grazing) further implies that the change in shrub cover was not accelerated at the warmest sites. It is important to note that although the dominance of woody plants does not differ among sites with different climatic conditions, they may still become increasingly dominant in response to increasing summer temperatures, as found elsewhere in the Arctic (CitationElmendorf et al., 2012). Both the species composition, precipitation, snow cover and other climate variables differ among our sites, so the maximum cover that shrubs can attain may be controlled by different factors at different sites. In our study, we found no general increase in the mean July temperature () even though annual average temperatures increased with ∼0.1 °C per year during the study period (CitationCappelen, 2015). Our results are therefore not contradicting those of Daniëls et al. (Citation2011) from Tasiilaq, Southeast Greenland, and of Jorgenson et al. (Citation2015) from northeast Alaska where vegetation composition and cover were recorded during 40 and 25 years, respectively. At both locations, climate warming had been observed but the composition of vegetation at the community level did not undergo changes. A recent study concluded that climate changes were most likely to affect shrubs at the northern limit of their ranges and at their upper elevation limits (CitationMyers-Smith et al., 2015). Since none of the shrub species we encountered in South Greenland is at the limit of its range, this is one likely reason why we did not observe any major change in the relative dominance of woody plants and other species over the 28-year study period.
Our study demonstrates how changes in the cover of different plant functional types can be modeled simultaneously using the multinomial distribution. To our knowledge, all previous studies have modeled the cover of one group at a time. We demonstrate how to put correct constraints on the possible domains of the latent variables that model the cover of the vegetation types. These added constraints increase the statistical power of the analysis and reduce the uncertainty when the model is used for predictive purposes. The model framework developed here can be used for guiding similar studies in the future.
This study is one of the first to use a long-term, large-scale study to analyze the combined effects of climate changes, grazing, and other environmental variables on the relative dominance of different plant functional types, and, to our knowledge, the first to do so in the Arctic. The lack of an effect of climate and grazing on the relative cover of woody plants, graminoids, and forbs is most likely due to limited changes in the summer temperatures over the study period. Our study suggests that the relative dominance of the plant functional types is resilient to the impacts of grazing and climate changes in the tundra of South Greenland.
Acknowledgments
We thank Fredrik Boberg and Ruth Mottram for performing the climate model run. The study was supported by Danish Cooperation for Environment in the Arctic (DANCEA, project number 112-00059 and 112-00136).
References Cited
- Arft, A. M. , Walker, M. D. , Gurevitch, J. , Alatalo, J. M. , Bret-Harte, M. S. , Dale, M. , Diemer, M. , Gugerli, F. , Henry, G. H. R. , Jones, M. H. , Hollister, R. D. , Jónsdóttir, I. S. , Laine, K. , Lévesque, E. , Marion, G. M. , Molau, U. , Mølgaard, P. , Nordenhäll, U. , Raszhivin, V. , Robinson, C. H. , Starr, G. , Stenström, A. , Stenström, M. , Totland, Ø. , Turner, P. L. , Walker, L. J. , Webber, P. J. , Welker, J. M. , and Wookey, P. A. , 1999: Responses of tundra plants to experimental warming: meta-analysis of the international tundra experiment. Ecological Monographs , 69: 491–511.
- Austrheim, G. , Asheim, L.-J. , Bjarnason, G. , Feilberg, J. , Fosaa, A. M. , Holand, Ø. , Høegh, K. , Jónsdóttir, I. S. , Magnússon, B. , Mortensen, L. E. , Mysterud, A. , Olsen, E. , Skonhoft, A. , Steinheim, G. , and Thórhallsdóttir, A. G. , 2008: Sheep Grazing in the North-Atlantic Region—A Long Term Perspective on Management, Resource Economy and Ecology. Norges Teknisk-Naturvitenskapelige Universitet.
- Bråthen, K. , Ims, R. , Yoccoz, N. , Fauchald, P. , Tveraa, T. , and Hausner, V. , 2007: Induced shift in ecosystem productivity? Extensive scale effects of abundant large herbivores. Ecosystems , 10: 773–789.
- Bryant, J. P. , Joly, K. , Chapin III, F. S. , DeAngelis, D. L. , and Kielland, K. , 2014: Can antibrowsing defense regulate the spread of woody vegetation in Arctic tundra? Ecography , 37: 204–211.
- Cahoon, S. M. P. , Sullivan, P. F. , Shaver, G. R. , Welker, J. M. , Post, E. , and Holyoak, M. , 2012: Interactions among shrub cover and the soil microclimate may determine future Arctic carbon budgets. Ecology Letters , 15: 1415–1422.
- Callaghan, T. V. , Björn, L. O. , Chernov, Y. , Chapin, T. , Christensen, T. R. , Huntley, B. , Ims, R. A. , Johansson, M. , Jolly, D. , Jonasson, S. , Matveyeva, N. , Panikov, N. , Oechel, W. , Shaver, G. , and Henttonen, H. , 2004: Effects on the structure of Arctic ecosystems in the short- and long-term perspectives. Ambio , 33: 436–447.
- Cappelen, J. , 2015: Greenland—DMI Historical Climate Data Collection 1784–2014. Copenhagen: Danish Meteorological Institute.
- Carlin, B. P. , and Louis, T. A. , 1996: Bayes and Empirical Bayes Methods for Data Analysis. London: Chapman & Hall.
- Celeux, G. , Forbes, F. , Robert, C. P. , and Titterington, D. M. , 2006: Deviance information criteria for missing data models. Bayesian Analysis , 1: 651–674.
- Chapin III, F. S. , Shaver, G. R. , Giblin, A. E. , Nadelhoffer, K. J. , and Laundre, J. A. , 1995: Responses of Arctic tundra to experimental and observed changes in climate. Ecology , 76: 694–711.
- Christensen, O. B. , Drews, M. , Christensen, J. H. , Dethloff, K. , Ketelsen, K. , Hebestadt, I. , and Rinke, A. , 2006: The HIRHAM Regional Climate Model. Version 5. Copenhagen: Danish Meteorological Institute.
- Christie, K. S. , Bryant, J. P. , Gough, L. , Ravolainen, V. T. , Ruess, R. W. , and Tape, K. D. , 2015: The role of vertebrate herbivores in regulating shrub expansion in the Arctic: a synthesis. BioScience , 65(12): 1123–1133.
- Crawley, M. J. , 1983: Herbivory, the Dynamics of Animal-Plant Interactions. Berkeley: University of California Press.
- Damgaard, C. , 2012: Trend analyses of hierarchical pin-point cover data. Ecology , 93: 1269–1274.
- Damgaard, C. , 2013: Hierarchical and spatially aggregated plant cover data. Ecological Informatics , 18: 35–39.
- Damgaard, C. , 2014: Estimating mean plant cover from different types of cover data: a coherent statistical framework. Ecosphere , 5(2): 1–7.
- Damgaard, C. , 2015: Modelling pin-point cover data of complementary vegetation classes. Ecological Informatics , 30: 179–184.
- Daniëls, F. J. A. , de Molenaar, J. G. , Chytrý, M. , and Tichý, L. , 2011: Vegetation change in Southeast Greenland? Tasiilaq revisited after 40 years. Applied Vegetation Science , 14: 230– 241.
- Dee, D. P. , Uppala, S. M. , Simmons, A. J. , Berrisford, P. , Poli, P. , Kobayashi, S. , Andrae, U. , Balmaseda, M. A. , Balsamo, G. , Bauer, P. , Bechtold, P. , Beljaars, A. C. M. , Berg, L. v. d. , Bidlot, J. , Bormann, N. , Delsol, C. , Dragani, R. , Fuentes, M. , Geer, A. J. , Haimberger, L. , Healy, S. B. , Hersbach, H. , Hólm, E. V. , Isaksen, L. , Kallberg, P. , Köhler, M. , Matricardi, M. , McNally, A. P. , Monge-Sanz, B. M. , Morcrette, J. J. , Park, B. K. , Peubey, C. , Rosnay, P. d. , Tavolato, C. , Thépaut, J. N. , and Vitart, F. , 2011: The ERA-Interim reanalysis: configuration and performance of the data assimilation system. Quarterly Journal of The Royal Meteorological Society , 137: 553–597.
- den Herder, M. , Virtanen, R. , and Roininen, H. , 2008: Reindeer herbivory reduces willow growth and grouse forage in a forest-tundra ecotone. Basic and Applied Ecology , 9: 324–331.
- Elmendorf, S. C. , Henry, G. H. R. , Hollister, R. D. , Bjork, R. G. , Boulanger-Lapointe, N. , Cooper, E. J. , Cornelissen, J. H. C. , Day, T. A. , Dorrepaal, E. , Elumeeva, T. G. , Gill, M. , Gould, W. A. , Harte J. , Hik, D. S. , Hofgaard,A. , Johnson, D. R. , Johnstone, J. F. , Jonsdottir, I. S. , Jorgenson, J. C. , Klanderud, K. , Klein, J. A. , Koh, S. , Kudo, G. , Lara, M. , Levesque, E. , Magnusson, B. , May, J. L. , Mercado-Diaz, J. A. , Michelsen, A. , Molau, U. , Myers-Smith, I. H. , Oberbauer, S. F. , Onipchenko, V. G. , Rixen, C. , Martin Schmidt, N. , Shaver, G. R. , Spasojevic, M. J. , orhallsdottir, o. E. , Tolvanen, A. , Troxler, T. , Tweedie, C. E. , Villareal, S. , Wahren, C.-H. , Walker, X. , Webber, P.J. , Welker, J. M. , and Wipf, S. , 2012: Plot-scale evidence of tundra vegetation change and links to recent summer warming. Nature Climate Change , 2: 453–457.
- Gough, L. , Moore, J. C. , Shaver, G. R. , Simpson, R. T. , and Johnson, D. R. , 2012: Above- and belowground responses of Arctic tundra ecosystems to altered soil nutrients and mammalian herbivory. Ecology , 93: 1683–1694.
- Jørgensen, R. H. , Meilby, H. , and Kollmann, J. , 2013: Shrub expansion in SW Greenland under modest regional warming: disentangling effects of human disturbance and grazing. Arctic, Antarctic, and Alpine Research , 45: 515–525.
- Jorgenson, J. C. , Raynolds, M. K. , Reynolds, J. H. , and Benson, A. -M. , 2015: Twenty-five year record of changes in plant cover on tundra of northeastern Alaska. Arctic, Antarctic, and Alpine Research , 47: 785–806.
- Kent, M. , and Coker, P. , 1992: Vegetation Description and Analysis. London: Belhaven Press.
- Kitti, H. , Forbes, B. C. , and Oksanen, J. , 2009: Long- and short-term effects of reindeer grazing on tundra wetland vegetation. Polar Biology , 32: 253–261.
- Langen, P. L. , Mottram, R. H. , Christensen, J. H. , Boberg, F. , Rodehacke, C. B. , Stendel, M. , van As, D. , Ahlstrøm, A. P. , Mortensen, J. , Rysgaard, S. , Petersen, D. , Svendsen, K. H. , Aðalgeirsdóttir, G. , and Cappelen, J. , 2015: Quantifying energy and mass fluxes controlling Godthåbsfjord freshwater input in a 5-km simulation (1991–2012). Journal of Climate , 28: 3694–3713.
- Larsen, J. N. , Anisimov, O. A. , Constable, A. , Hollowed, A. B. , Maynard, N. , Prestrud, P. , Prowse, T. D. , and Stone, J. M. R. , 2014: Polar Regions. Cambridge, United Kingdom, and New York: Cambridge University Press.
- Lucas-Picher, P. , Wulff-Nielsen, M. , Christensen, J. H. , Aðalgeirsdóttir, G. , Mottram, R. , and Simonsen, S. B. , 2012: Very high resolution regional climate model simulations over Greenland: identifying added value. Journal of Geophysical Research , 117: doi http://dx.doi.org/10.1029/2011JD016267 .
- Manseau, M. , Huot, J. , and Crête, M. , 1996: Effects of summer grazing by caribou on composition and productivity of vegetation: community and productivity level. Journal of Ecology , 84: 503–513.
- Mulder, C. P. H. , 1999: Vertebrate herbivores and plants in the Arctic and subarctic: effects on individuals, populations, communities and ecosystems. Perspectives in Plant Ecology, Evolution and Systematics , 2: 29–55.
- Myers-Smith, I. H. , Forbes, B. C. , Wilmking, M. , Hallinger, M. , Lantz, T. , Blok, D. , Tape, K. D. , Macias-Fauria, M. , Sass-Klaassen, U. , Lévesque, E. , Boudreau, S. , Ropars, P. , Hermanutz, L. , Trant, A. , Collier, L. S. , Weijers, S. , Rozema, J. , Rayback, S. a. , Schmidt, N. M. , Schaepman-Strub, G. , Wipf, S. , Rixen, C. , Ménard, C. B. , Venn, S. , Goetz, S. , Andreu-Hayles, L. , Elmendorf, S. , Ravolainen, V. , Welker, J. , Grogan, P. , Epstein, H. E. , and Hik, D. S. , 2011: Shrub expansion in tundra ecosystems: dynamics, impacts and research priorities. Environmental Research Letters , 6: doi http://dx.doi.org/10.1088/1748-9326/6/4/045509 .
- Myers-Smith, I. H. , Elmendorf, S. C. , Beck, P.S.A. , Wilmking, M. , Hallinger, M. , Blok, D. , Tape, K. D. , Rayback, S. A. , Macias-Fauria, M. , Forbes, B. C. , Speed, J. D. M. , Boulanger-Lapointe, N. , Rixen, C. , Levesque, E. , Schmidt, N. M. , Baittinger, C. , Trant, A. J. , Hermanutz, L. , Collier, L. S. , Dawes, M. A. , Lantz, T. C. , Weijers, S. , Jorgensen, R. H. , Buchwal, A. , Buras, A. , Naito, A. T. , Ravolainen, V. , Schaepman-Strub, G. , Wheeler, J. A. , Wipf, S. , Guay, K. C. , Hik, D. S. , and Vellend, M. , 2015: Climate sensitivity of shrub growth across the tundra biome. Nature Climate Change , 5: 887–891.
- Normand, S. , Raandin, C. , Ohlemüller, R. , Bay, C. , Høye, T.T. , Kjær, E. D. , Körner, C. , Lischke, H. , Maiorano, L. , Paulsen, J. , Pearman, P. B. , Psomas, A. , Treier, U. A. , Zimmermann, N. E. , and Svenning, J.-C. , 2013: A greener Greenland? Climatic potential and long-term constraints on future expansions of trees and shrubs. Philosophical Transactions of the Royal Society B: Biological Sciences , 368: doi http://dx.doi.org/10.1098/rstb.2012.0479 .
- O'Hara, R. B. , and Sillanpää, M. J. , 2009: A review of Bayesian variable selection methods: what, how and which. Bayesian Analysis , 4: 85–118.
- Olofsson, J. , Kitti, H. , Rautiainen, P. , Stark, S. , and Oksanen, L. , 2001: Effects of summer grazing by reindeer on composition of vegetation, productivity and nitrogen cycling. Ecography , 24: 13–24.
- Olofsson, J. , Oksanen, L. , Callaghan, T. , Hulme, P. E. , Oksanen, T. , and Suominen, O. , 2009: Herbivores inhibit climate-driven shrub expansion on the tundra. Global Change Biology , 15: 2681–2693.
- Post, E. , and Klein, D. , 1996: Relationships between graminoid growth form and levels of grazing by caribou (Rangifer tarandus) in Alaska. Oecologia , 107: 364–372.
- Post, E. , and Pedersen, C. , 2008: Opposing plant community responses to warming with and without herbivores. Proceedings of the National Academy of Sciences , 105: 12353–12358.
- Post, E. , Forchhammer, M. C. , Bret-Harte, M. S. , Callaghan, T. V. , Christensen, T. R. , Elberling, B. , Fox, A. D. , Gilg, O. , Hik, D. S. , Høye, T. T. , Ims, R. A. , Jeppesen, E. , Klein, D. R. , Madsen, J. , McGuire, A. D. , Rysgaard, S. , Schindler, D. E. , Stirling, I. , Tamstorf, M. P. , Tyler, N. J. C. , van der Wal, R. , Welker, J. , Wookey, P. A. , Schmidt, N. M. , and Aastrup, P. , 2009: Ecological dynamics across the Arctic associated with recent climate change. Science , 325: 1355–1358.
- Rundqvist, S. , Hedenås, H. , Sandström, A. , Emanuelsson, U. , Eriksson, H. , Jonasson, C. , and Callaghan, T. , 2011: Tree and shrub expansion over the past 34 years at the tree-line near Abisko, Sweden. Ambio , 40: 683–692.
- Saito, K. , Zhang, T. , Yang, D. , Marchenko, S. , Barry, R. G. , Romanovsky, V. , and Hinzman, L. , 2013: Influence of the physical terrestrial Arctic in the eco-climate system. Ecological Applications , 23: 1778–1797.
- Spiegelhalter, D. J. , Best, N. G. , Carlin, B. P. , and van der Linde, A. , 2002: Bayesian measures of model complexity and fit. Journal of Royal Statistical Society B , 64: 583–639.
- Sturm, M. , Schimel, J. , Michaelson, G. , Welker, J. M. , Oberbauer, S. F. , Liston, G. E. , Fahnestock, J. , and Romanovsky, V. E. , 2005: Winter biological processes could help convert Arctic Tundra to shrubland. Bioscience , 55: 17–17.
- Tape, K. , Sturm, M. , and Racine, C. , 2006: The evidence for shrub expansion in northern Alaska and the Pan-Arctic. Global Change Biology , 12: 686–702.
- Turkington, R. , 2009: Top-down and bottom-up forces in mammalian herbivore—vegetation systems: an essay review. Botany , 87: 723–739.
- Walker, M. D. , Wahren, C. H. , Hollister, R. D. , Henry, G. H. R. , Ahlquist, L. E. , Alatalo, J. M. , Bret-Harte, M. S. , Calef, M. P. , Callaghan, T.V. , Carroll, A. B. , Epstein, H. E. , Jónsdóttir, I. S. , Klein, J. a. , Magnússon, B. , Molau, U. , Oberbauer, S. F. , Rewa, S. P. , Robinson, C. H. , Shaver, G. R. , Suding, K. N. , Thompson, C. C. , Tolvanen, A. , Totland, Ø. , Turner, P. L. , Tweedie, C. E. , Webber, P. J. , and Wookey, P. a. , 2006: Plant community responses to experimental warming across the tundra biome. Proceedings of the National Academy of Sciences of the United States of America , 103: 1342–1346.
- Wolfram, S. , 2013: Mathematica. Champaign, Illinois: Wolfram Research.
- Zamin, T. J. , and Grogan, P. , 2013: Caribou exclusion during a population low increases deciduous and evergreen shrub species biomass and nitrogen pools in low Arctic tundra. Journal of Ecology , 101: 671–683.
Appendix
FIGURE A1. Modeled climate changes on the study sites during the period 1989–2012. Annual and monthly statistics were derived from daily values.
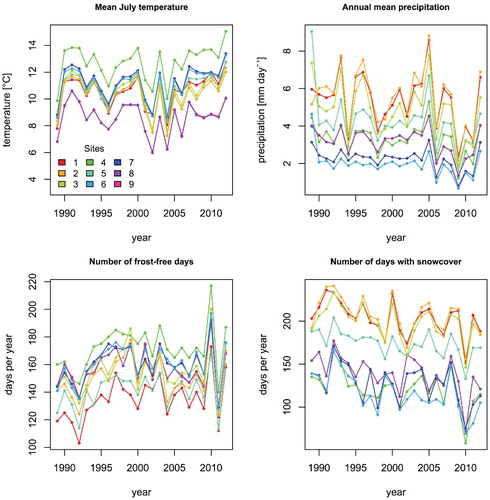
FIGURE A2. Changes in shrub cover in ungrazed plots (i.e. inside exclosures). A and C are from 1986 and 1992, respectively, whereas B and D are from 2009. Figure A and B show Site 5 (Ipiutaq); C and D show Site 1 (Qinngua Kangilleq). Photos: J. Feilberg/K. Raundrup.
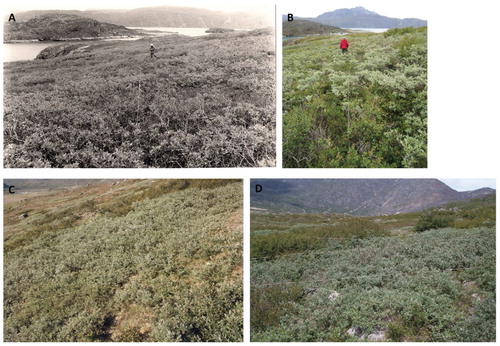
FIGURE A3. Changes in shrub cover in grazed plots. A and C are from 1986 and 1992, respectively, whereas B and D are from 2009. Figure A and B show Site 5 (Ipiutaq); C and D show Site 1 (Qinngua Kangilleq). Photos: J. Feilberg/K. Raundrup.
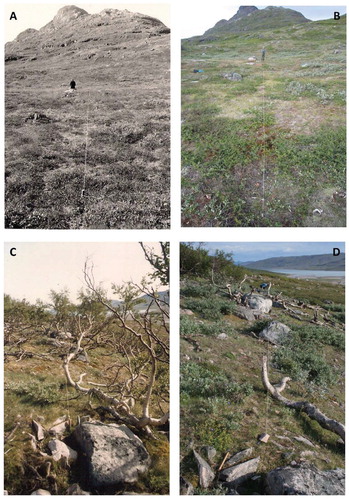
TABLE A1 List of plant species determined in the pinpoint analyses. The list includes information on functional group, species name, data on the number of pinpoint hits for each species in ungrazed plots (Exclosure, Yes) and grazed plots (Exclosure, No), and percentage of the species growing inside an exclosure.
Table
Table