
ABSTRACT
Soil moisture (SM), snow depth (SND), and air temperature are crucial factors for the soil thermal and hydraulic regimes in the permafrost regions. This paper analyzes the contribution of these factors to active layer thickness (ALT) under different climate change scenarios in northern hemisphere permafrost regions, using simulations from the Coupled Model Intercomparison Project Phase 5 (CMIP5) for the early (2016–2035, EP), middle (2046–2065, MP), and late (2080–2099, LP) periods of the 21st century. The results indicate that, with the temperature increasing, the relation between ALT and SM, SND, and mean annual air temperature (MAAT) will change in different permafrost regions. During 1986–2005 (reference period), ALT correlates significantly with SND in Europe only, the contribution of MAAT and SM to ALT are significant over the Tibetan Plateau (TP) and in North America (NA). MAAT is the only significant contribution factor to ALT deepening for all regions. In the 21st century, for the high Representative Concentration Pathways (RCP8.5), MAAT plays a dominant role in ALT over the TP and NA; however, snow effect is enhanced under RCP2.6 and RCP4.5 in Europe and NA. With temperature increasing, the importance of SM and SND alternates for low and middle emission, and gradually declines for high emission. In general, MAAT is the main contributor to ALT during the 21st century, while the impact of SM and SND declines with increasing temperature. Contribution of SM, SND, and MAAT to ALT varies, which illustrates the differences in regional thermal and hydraulic regimes from warming in permafrost regions.
Introduction
Permafrost occupies much of Earth's land area, that is, the area of permafrost underlying the exposed land surface is estimated to be 16–21 × 106 km2 (CitationGruber, 2012), and it is sensitive to climate change, especially in high-latitude and high-altitude regions (CitationWalter et al., 2006; CitationLi et al., 2008). A number of recent studies have suggested that permafrost is warming and degrading, and active layer thickness (ALT) is increasing (CitationJafarov et al., 2013; CitationPark et al., 2013; CitationGuglielmin et al., 2014; CitationSobota and Nowak, 2014; CitationWang et al., 2014; CitationPeng et al., 2015; CitationPogliotti et al., 2015; CitationYu et al., 2015). Widespread warming in permafrost regions will result in substantial changes in terrestrial hydrology, vegetation composition, and ecosystem function, as well as carbon dioxide and methane fluxes (CitationNelson and Anisimov, 1993; CitationMcNamara et al., 1998; CitationJorgenson et al., 2001; CitationChristensen et al., 2004; CitationHinzman et al., 2005; CitationSmith et al., 2005). Most of these processes will be confined to the seasonally thawed active layer, across which exchanges of heat, moisture, and gases between the atmosphere and terrestrial systems will occur (CitationKane et al., 1991; CitationNelson and Anisimov, 1993; CitationBurn, 1998; CitationAnisimov, 1997).
The active layer is the part of ground that is subjected to annual thawing and freezing in areas underlain by permafrost, and it is an indicator of climate change in cold regions. Recent observations have detected a general increasing trend in the ALT in many regions, including Russia and northern Europe (CitationMazhitova, 2008), eastern Siberia (CitationFyodorov-Davydov et al., 2008), the Canadian Arctic (CitationSmith et al., 2010), northern Alaska (CitationHinkel and Nelson, 2003), and the Tibetan Plateau (TP) (CitationWu and Zhang, 2010;CitationZhao et al.,2010;CitationLi et al., 2012).The widespread increase in ALT may affect the local hydrology, ecology, and the infrastructure of northern communities (CitationKane et al.,1991;CitationJin et al.,2000;CitationWu et al., 2003;CitationInstanes et al., 2005). Although there are many uncertainties associated with estimates of the magnitude of these effects, there is an urgent need to resolve questions regarding the fate of permafrost and changes in the ALT (CitationWalker, 2007).
Soil moisture (SM) is a crucial variable; it controls the partitioning of energy into latent and sensible heat fluxes at the soil-atmosphere interface (CitationAlbergel et al., 2012) and influences the mean annual ground temperature (MAGT) of permafrost and the thermal regime of the active layer (CitationGoodrich, 1982; CitationKane et al., 2001; CitationNelson et al., 1997a, Citation1997b; CitationPark et al., 2015). As a result of seasonal and interannual variations of SM associated with changes in climate and soil temperature (CitationNelson et al., 1997a, Citation1997b; CitationPark et al., 2013), it is important to study the impact of SM on permafrost (CitationIshikawa et al., 2005; CitationXie et al., 2012; CitationYu and Wang, 2012). However, due to a lack of equivalent atmospheric observational soil moisture data, previous studies have often assumed that SM is a constant factor in the spatial-temporal scale (CitationAnisimov et al., 1997; CitationSlater and Lawrence, 2013). Moreover, snow also plays an important role in the water and heat exchange processes between the ground and the atmosphere. In addition to these two influencing factors, ALT can also be affected by other factors such as vegetation, soil texture and corresponding thermal properties, and topography. These variables interact in a complex way and result in large variations in the ALT (CitationHinzman et al., 1997; CitationZhang et al., 1997). Many numerical models have been developed to estimate ALT, such as analytic steady-state equations (CitationSazonova et al., 2004), heat conduction equations (CitationKoichi, 1986; CitationMackay, 1995; CitationZhang et al., 2003). However, these models mainly depend on the temperature indicator. In view of the complex impact of the above-mentioned factors on ALT, Kudryavtsev's model (CitationKudryavtsev et al., 1974) is a more effective method for calculating ALT in this paper.
Wang et al. (Citation2009) compared three different methods to estimate ALT and examined the effects of SM on ALT over the TP by using Kudryavtsev's method with observations. The results showed that SM could improve the estimation of ALT. Further, Yu and Wang (Citation2009,Citation2012) proposed an estimation scheme for SM parameterized by soil temperature to estimate the ALT of frozen ground over the TP, and the results suggest that the estimation scheme accurately estimates ALT. However, the acquisition of accurate SM data still presents challenges (CitationTian et al., 2012).
In recent years, land surface data assimilation has become widely applied. The Global Land Data Assimilation System (GLDAS) generates optimal fields of land surface states and provides improved SM products on a global scale, and it is available to climate research communities as observational data for the time series ranging from 1948 to 2012 (CitationRodell et al., 2004). Research shows that GLDAS can capture basic features of observed soil moisture in TP (CitationBi, 2015), and the root mean square error (RMSE) between GLDAS SM and the station-averaged SM in central TP is < 0.06 m3 m-3 (CitationChen et al. 2013). Therefore, GLDAS production would be beneficial for improving the estimation of permafrost dynamics.
Park et al. (Citation2013) investigated ALT changes in the pan-Arctic area during 1948–2006 with a land surface model (CHANGE). Results suggested that the relationship between ALT and annual thawing index (ATI), snow depth (SND), and SM are different in both Eurasian and North American regions. Besides, ALT changes relative to the SND and soil thermal and moisture regimes formed in the pre-thaw season. Results also revealed that the contribution of SND and SM to ALT with changing temperatures is different in different periods. Based on the simulation, Park et al. (Citation2015) further examined the insulation effects of SND on the underlying soil temperature and permafrost over the pan-Artic area. Simulation results indicated that snow cover contributes to the warming of permafrost in northern regions and could play a more important role under conditions of future arctic warming. Overall, the studies of Park et al. (Citation2013,Citation2015) implied that the impacts of SND, SM, and air temperature on the dynamics of ALT and permafrost have been established.
This paper aims to investigate the relationship among ALT, SM, SND, and mean annual air temperature (MAAT) with increasing temperatures in performance regions in the 21st century. In particular, we focus on two issues: (1) How will ALT with SND and SM change with persistently increasing temperatures in the northern hemisphere in the 21st century? and (2) How does the relationship change with temperatures decreasing SND (CitationShi and Wang, 2015) and SM obviously changing (in particular, when temperature has been increased to some level)? Answering these issues would benefit our understanding of the mechanism of frozen ground changing in the future. The structure of this paper is organized as follows. Section 2 gives a brief description of the data and methods. In section 3, the relationships among SM and the maximum depth of frozen penetration (MDFP), ALT, and extent of permafrost are analyzed. In section 4, the possible changes of permafrost extent and ALT in the 21st century are investigated with Kudryavtsev's model, based on the Coupled Model Intercomparison Project Phase5 (CMIP5) models. In section 5, the contributions of SND, MAAT, and SM to ALT are discussed. Finally, discussion and conclusions are given in section 6.
Data and Methods
To estimate the changes in permafrost area and ALT during the 21st century, six models () from CMIP5 are used that have good simulation performance in snow water equivalent (CitationShi and Wang, 2015). Snow density as an input parameter in Kudryavtsev's model is calculated by snow mass and snow depth (CitationWang and Wang, 2012), whereas snow depth is computed by temperature and precipitation using Equation (1) (CitationAnisimov and Nelson, 1996).
![]() is the snow depth, Pi
is the water-equivalent precipitation for those months i (i = 1,2,...k) in which the mean temperature is 0 °C or below, ρ
r
is the relative snow density, and φ is the latitude of the location.
is the snow depth, Pi
is the water-equivalent precipitation for those months i (i = 1,2,...k) in which the mean temperature is 0 °C or below, ρ
r
is the relative snow density, and φ is the latitude of the location.
The six models' detailed information is presented in . The historical simulations range from 1850 to 2005 or to 2012 in CMIP5, and the simulations from three different Representative Concentration Pathways (RCPs: RCP2.6, RCP4.5, and RCP8.5) (climate scenarios) are chosen in this study. The simulations under the three RCPs ranged from 2006 to 2100 and were divided into three periods: an early period (2016–2035), a middle period (2045–2065), and a late period (2080– 2099). More details about the models used in CMIP5 can be found on the Web at http://www-pcmdi.llnl.gov. In addition, the following variables in CMIP5 are used: surface air temperature, snow mass, precipitation, and SM. Because of the different runs used in the Global Climate Models (GCMs), some only one run, we used only the first ensemble member produced by each model (i.e., r1i1p1).
TABLE 1 List of models used in this study.
One of the effective ways to improve estimation of ALT in permafrost is to use reasonable data sets of SM. In this study, GLDAS is used, which has better quality in most regions (CitationBi, 2015; CitationChen et al., 2013). However, the spatial details in high mountainous areas are not sufficiently well estimated by the GLDAS products, and the data used in mountainous areas or places with sparse weather stations must be used with caution (CitationJi et al., 2014).
The SM in GLDAS has four depth levels (0–10 cm, 10–40 cm, 40–100 cm, and 100–200 cm). Because the changes of SM occur mainly in surface and upper levels of ALT, and the top layer data have significant correlation to the CMIP5's six models, only the top layer (0–10 cm) of SM is considered for estimation of the ALT. The air temperatures from Climate Research Unit (CRU) data (CRUEM3) during 1901–2012 are used. The resolution of the CRU and GLDAS products are 0.5° × 0.5°. The soil texture (sand, silt, clay, and loam) data adopt the land surface module of Community Earth System Model (CESM), the resolution is 1.9° × 2.5°, and the thermal properties of soil follow the values by Anisimov et al. (Citation1997).To compare the different data sets, the CRU and GLDAS and modeled data sets are interpolated with a bilinear method in a common 1° × 1 ° latitude and longitude grid.
Kudryavtsev's model is employed to estimate ALT in permafrost regions over the northern hemisphere landmass. This is a semi-empirical method that has been developed in Russia primarily to address the practical needs of cold-region engineering, and it is adjusted to operate on hemisphere and regional scales (CitationKudryavtsev et al., 1974). The required spatially explicit mineral soil textures come from the land surface module of CESM, and the thermal properties follow Anisimov et al. (Citation1997). Organic soil plays an important role in the responses of permafrost to warming (CitationYi et al., 2007, Citation2009a). However, thickness of organic soil is controlled by several factors including vegetation growth, wildfire, drainage, and others (CitationYi et al., 2009b). It is difficult to simulate these complex processes (CitationYi et al., 2010), and it is also beyond the scope of this study. We have assumed the thickness of the organic mat to be a constant (defined as 10 cm), and the thermal diffusivity of the organic mat under frozen and thawing conditions also followed Anisimov et al. (Citation1997). The Kudryavtsev's model has two major outputs: ALT and mean annual soil temperature at the depth of thawing, which can be used to determine if permafrost exists.
SND, SM, and temperature play a crucial role in permafrost dynamics. To analyze the relative impacts of SM, SND, and temperature on permafrost and ALT, the partial correlation coefficients are calculated by Equations (2) and (3) between ALT and SND, MAAT, and SM in the permafrost regions.
where r 12,34 indicates the partial correlation between the first and second variable after eliminating the influence of the third and fourth variables on the first variable, and r 12,3 is the partial correlation between the first and second variable after eliminating the influence of the third variable on the first variable. The definitions for r 14,3 and r 24,3 follow that for r 12,3 ; and r 12 is the correlation coefficient between the first and second variable. The definitions for r 13 and r 23 follow that for r 12.
Results
Impacts of SM on Frozen Ground and Its Indicators
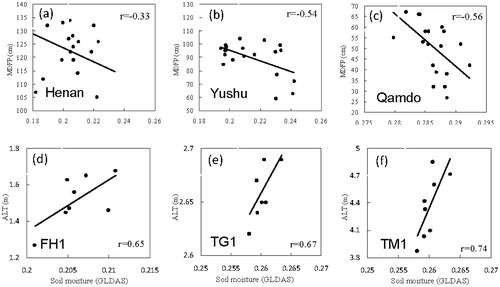
Compared with snow depth and air temperature, SM is a relatively robust factor for frozen ground. When the SM remains constant, changes in heat conduction and heat capacity will have an evident effect on frozen ground (CitationXie et al., 2012; CitationYu and Wang, 2012; CitationWang et al., 2014). To validate the link between SM and frozen ground, shows the relationship between GLDAS's SM and MDFP observed at the Henan, Yushu, and Qamdo stations; and illustrates the correlation between GLDAS's SM and ALT observed at FH1, TG1, and TM1 stations over the TP. There was a significant positive correlation between SM and ALT, and a significant negative correlation between SM and MDFP. This implies that SM contributes to the thickening of ALT and restrains the increase of MDFP.
To quantify the importance of SM on permafrost change over the northern hemisphere permafrost regions, shows the estimated permafrost extent during 1986–2005. The extent of the 0 °C isotherm of MAAT (black line) from CRU is also shown in . SM is a constant factor in (CitationAnisimov et al., 1997), but in , the SM value is replaced by the data from GLDAS. An obvious difference is that the permafrost edge in is more consistent with the 0 °C isotherm than that in , with permafrost areas of 14.09 and 16.71 × 10⁶ km2 in , respectively. The distribution of permafrost extent in is closer to the result from the International Permafrost Association (IPA) (CitationHeginbottom et al., 1993; CitationBrown et al., 1997). This implies that approximately realistic SM can improve the estimation performance of Kudryavtsev's model for permafrost extent, which also illustrates that SM plays an important role in changes of the permafrost.
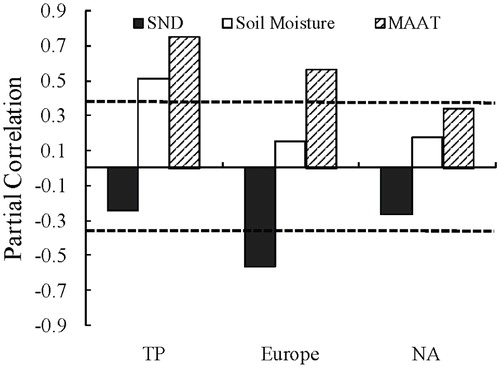
Except for SM, MAAT and SND also play an important role in ALT. shows partial correlation between ALT and SM, SND, and MAAT in three permafrost regions. (Here the ALT is calculated by the SM and MAAT, which are from GLDAS and CRU, with the Kudryavtsev's model.) The result illustrates that both SM and MAAT have a significant impact on ALT over the TP, and with correlations exceeding the 90% significance level, this is likely because of the larger interannual variation of SM and the higher increase of MAAT over the TP, which is consistent with IPCC (CitationStocker et al., 2013). In Europe, the effect of SND and MAAT are stronger than that of SM on ALT. This might be attributed to heavy snowfall in winter and spring, and the resulting stronger insulating effect and high reflectivity of the snow having a more significant effect on ALT (CitationPark et al., 2013). A notable feature is that SND, SM, and MAAT all have a weak relationship with ALT in NA, where permafrost characteristics differ from that in the middle latitudes (such as the TP) and in Mediterranean Europe.This might be attributed to the arctic-alpine climate, and relatively small changes in ALT (CitationZhang et al., 2005).
FIGURE 1. The correlation coefficients between soil moisture (SM) and observed maximum depth of frozen ground (MDFP) at (a) Henan, (b) Yushu, and (c) Qamdo observation sites during the period of 1986–2005; and active layer thickness (ALT) at (d) FH1, (e) TG1, and (f) TM1 during 1998–2005. These six observation stations are located over the Tibetan Plateau (TP). SM is from Global Land Data Assimilation System (GLDAS), over the Qinghai-Xizang (TP).
The IPCC Fifth Assessment Report (AR5) suggested that temperature will increase continuously in the 21st century (CitationStocker et al., 2013), and that warming will be more pronounced in high-latitude and highaltitude regions; the multi-model ensemble projects significant decreases in snow water equivalent (SWE) over the 21st century for most regions of the northern hemisphere for RCPs 2.6, 4.5, and 8.5 (CitationShi and Wang, 2015). Permafrost also will be degrading. An issue that concerns us is what changes of the relative contribution of SND, SM, and MAAT to ALT would be occurring, which also involve the regime of thermal hydrology over permafrost.
Changes in Permafrost Extent and ALT in the 21st Century
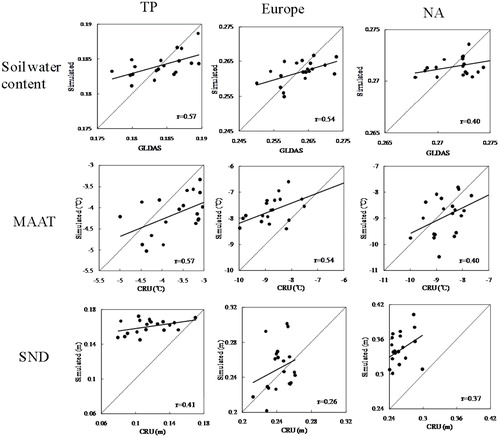
Temperature, SND, and SM are crucial climate variables for permafrost. To validate the reliability of SM, MAAT, and SND simulated by the CMIP5 models, shows that the correlations between the observation of SND (calculated by CRU temperature and precipitation by Equation [1]), MAAT (CRU), SM (GLDAS), agrees with that from the CMIP5 multimodel ensemble simulation in Europe, NA, and TP, respectively. Here, the reanalysis data are regarded as the observations. Although there are some biases between the simulation and observation, however, almost all of the simulations generally captured the characteristics of the variables, and most of the correlations between them exceeded the 90% significance level, i.e., the CMIP5 models can well reproduce temperature, snow depth, and SM.
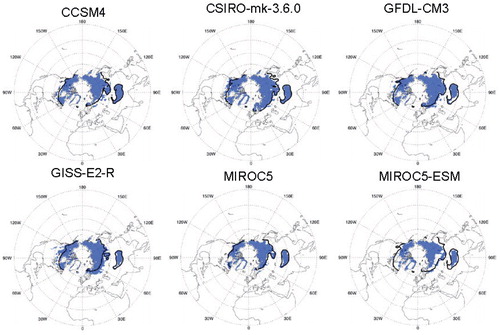
In general, the multi-ensemble mean has better performance than each individual model, similar to the approach of Shi and Wang (Citation2015). shows the estimated mean permafrost extent from six individual and ensemble means in CMIP5 by the Kudryavtsev method during the period 1986–2005; the six model simulations have good correlation with the GlobSnow and the National Snow and Ice Data Center snow water equivalent data sets. Compared with the permafrost extent estimated using the CRU data sets, the six models capture the distribution pattern of permafrost, and the range of permafrost is consistent with the 0 °C isotherm of MAAT, which also agrees with the result from Brown et al. (Citation1997).The estimated permafrost area ranges from 13.8–21.0 × 10⁶ km2 in 1986 to 11.1–16.8 × 10⁶ km2 in 2005. The decreasing trend of multi-model mean permafrost extent during the period of 1986–2005 is about -8 × 10⁵ km2/10 yr (P > 95%). Moreover, the spatial correlations between the permafrost extent calculated by the CMIP5 simulation and CRU data ranges from 0.75 to 0.80 (P > 99.9%), whereas the multi-model ensemble shows that the spatial correlation coefficient reaches 0.82 (P > 99.9%). This illustrates that the model can well reproduce the permafrost distribution, and the multi-model ensemble is more effective for reproducing the permafrost distribution than the individual model.
FIGURE 2. The estimated permafrost extent based on the Climatic Research Unit (CRU) data and Kudryavtsev's method. The black lines indicate the 0 °C isotherm in mean annual air temperature (MAAT) from the CRU data set during the period 1986–2005. (a) SM is a constant, (b) SM is from GLDAS.
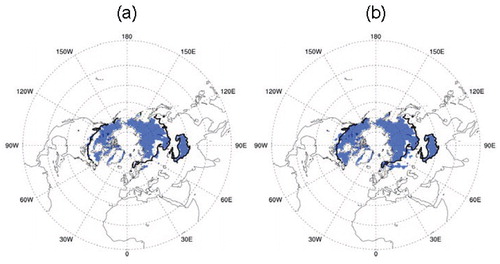
FIGURE 3. The partial correlations between ALT in the persistent permafrost regions and snow depth (SND), SM, and mean annual air temperature (MAAT) in Europe, North America (NA), and Tibetan Plateau (TP) during the period 1986–2005. The dashed lines indicate the 90% significant levels, the partial correlations between ALT and SND, SM, and MAAT are indicated by the black, white, and diagonally-striped bars, respectively.
Permafrost is a product of cold climate, and it has significantly responded to global warming (CitationZhang et al., 2005). The multi-model ensemble shows that the MAGT at the depth of seasonal thawing gradually increased during the three periods of the 21st century for the three RCPs (not shown). In most permafrost regions, MAGT is closer to -2 °C, which indicates that most permafrost gradually changes into warm permafrost. Especially during the late period for RCP8.5, only in arctic regions (north of 60°N) and the TP, MAGT is below 0 °C in other regions, MAGT basically increases to above 0 °C, which implies that most permafrost might change into warm permafrost or even disappear; the changes of permafrost in the 21st century mainly depend on warm permafrost (CitationPeng et al., 2015).
Furthermore, the averaged permafrost distribution for 1986–2005, and the early, middle, and late periods of the 21st century for the three RCPs is given in . For RCP2.6 and RCP4.5, permafrost gradually degenerates from the southern margins of permafrost; this is consistent with general knowledge, but the decreased magnitude of permafrost extent was weak, relative to the reference period of 1986–2005. For RCP8.5, the permafrost degradation gradually becomes significant. Especially during the late period, most permafrost completely disappears, and only exists in the Canadian Arctic, European Russian North, and the center of the TP. Relative to 1986–2005, the mean decreased permafrost extent in 2099 is 1.38 × 10⁶ km2 for RCP2.6, 4.34 × 10⁶ km2 for RCP4.5, and 10.32 × 10⁶ km2 for RCP8.5. In addition, the projected future evolution of permafrost extent mainly depends on the periods and scenarios. The ensemble mean trend of the permafrost area during the period of 1986–2005 is (-0.9 ± 1.09) × 106 km2/10 yr. The decreasing trend of permafrost area during the early, middle, and late periods for RCP2.6 and RCP4.5 is less than that during 1986–2005, and the change trend appears to stabilize during the late period, whereas for RCP8.5, the trend ranges from (-0.9 ± 0.83) to (-1.5 ± 1.07) × 106 km2/10 yr during the three periods in the 21st century.This implies that the permafrost area under RCP8.5 is on a declining trajectory during the entire 21st century.
FIGURE 4. The correlation coefficients between CMIP5 multi-model average and reanalyzed SM, MAAT, and SND over the TP, Europe, and NA during the period of 1986–2005. GLDAS is Global Land Data Assimilation System, and CRU(CRUTEM3) is Climatic Research Unit.
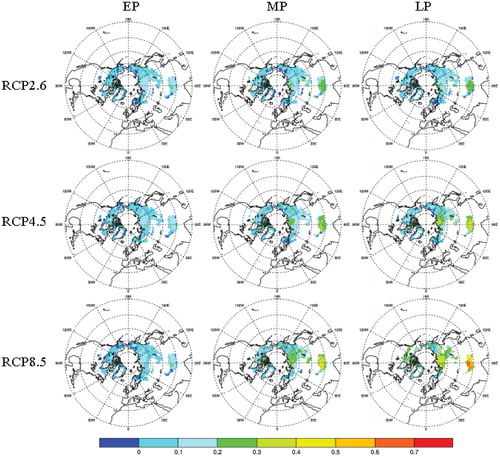
To further investigate the changes in permafrost, the spatial distribution of ALT in persistent permafrost regions is estimated (). Relative to the reference period of 1986–2005, ALT in persistent permafrost regions consistently shows an increasing trend for the three RCPs during the early, middle, and late periods. However, for RCP2.6 and RCP4.5, ALT in the persistent permafrost regions gradually becomes stable in 2099, while RCP8.5 is still showing an increasing trend. The most significant increase in ALT occurs over the TP, especially for RCP8.5 during the late period, the largest increment of ALT is greater than 0.8 m. The TP is a unique, cold, highaltitude permafrost region in the mid-latitudes of the northern hemisphere. The prominent warming over the TP results in the significant change of permafrost (CitationGuo et al., 2012). Permafrost in the center of the TP belongs to continuous permafrost, and is regarded as cold permafrost with a MAGT of below -2 °C. As permafrost temperatures in cold permafrost regions increase faster than those in warm permafrost regions, the increasing rate of ALT at the center of the TP is larger than that at its edge.
FIGURE 5. The estimated mean permafrost extent with CMIP5 simulation by Kudryavtsev's model during the period 1986–2005. The black lines indicate the 0 °C isotherm of MAAT. SM is from the CMIP5 output.
Soil Thermal and Hydraulic Regimes in Permafrost Regions
The fifth assessment report (CitationStocker et al., 2013) suggested that temperature warming will be amplified at high latitudes and high altitudes, which may further lead to permafrost rapidly degrading (CitationZhang et al., 2005). indicates that the increase in ALT over the TP is larger than that in the Arctic and subarctic. A similar feature of MAAT and ALT implies that MAAT over the TP is likely to be an important contributor to ALT. However, the changes in ALT indicate that the response of permafrost to climate change varies regionally, just as soil thermal and hydraulic regimes vary in different permafrost regions.
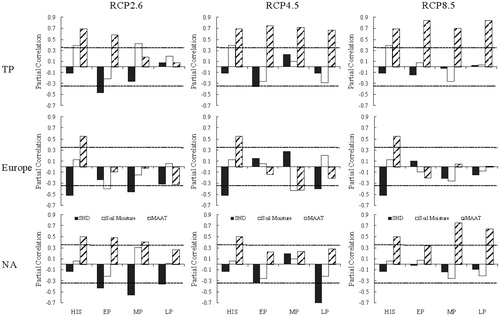
In order to analyze the changes in soil thermal and hydraulic regimes, the partial correlations between ALT and MAAT, SND, and SM for the period 1986–2005 and the early, middle, and late periods for the three RCPs are calculated (). During 1986–2005, ALT is significantly related to MAAT in the three main permafrost regions, and all of the partial correlations exceed the 90% significant level. However, the significant correlation between SM and ALT only occurs over the TP, and SND significantly correlates with ALT only in Europe. This implies that MAAT is the dominant factor for ALT in the persistent permafrost regions, while the impact of SND and SM on ALT varies regionally, which is similar to the previous results of Park et al. (Citation2013).
As the temperature increases in the 21st century, ALT also shows an increasing trend in most regions, but the thermal and hydraulic regimes significantly vary with the regions and the periods. Relative to the reference period of 1986–2005, MAAT has an increasing, stable, and decreasing trend over the TP during the early, middle, and late periods for RCP2.6, respectively. This implies that the impact of MAAT on ALT gradually decreases from the early to the late period under RCP2.6. Under RCP4.5 and RCP8.5, the increasing temperature significantly contributes to ALT. Because of the effect of temperature, the relative significant impact of SM and SND on ALT alternates under RCP2.6 and RCP4.5, and gradually decreases under RCP8.5. Meanwhile, the soil thermal and hydraulic regime varies in the middle and high latitudes. MAAT is significantly correlated with ALT under RCP2.6 and RCP8.5 in NA, and SND significantly contributes to ALT under RCP2.6 and RCP4.5.As snow shows a more significant decreasing trend in NA (north of 60°N) than that in other regions, this might mean that a remarkable temperature rise could result in a rapid snowmelt and later snow accumulation (CitationDyer and Mote, 2006; CitationPark et al., 2013), especially for RCP8.5. The interannual variation of snow will become small and the snow would even disappear completely in some regions, which results in the gradually decreasing contribution of SND to ALT from low to high emission scenarios (RCPs). However, the thermal and hydraulic regimes in Europe completely differ from those in NA and TP. SND had strong effects on the permafrost in Europe, although this significant effect only occurs under RCP2.6 and 4.5.With the temperature increasing, the snow cover extent and SND quickly decrease; this affects SM in the shallow soil layer and results in a significant impact of SM and SND on ALT and, alternately, occurs under RCP2.6 and RCP4.5, and gradually declines under RCP8.5. Under the high emission (RCP8.5), especially during the late period, most permafrost completely degrades, and ultimately the feature of soil thermal and hydraulic regimes under the lower RCPs (RCP2.6, RCP4.5) will disappear under RCP8.5.
FIGURE 6. The estimated mean permafrost extent from six models ensemble mean for the three Representative Concentration Pathways (RCPs) during the early period (EP) (2016–2035), middle period (MP) (2046–2065), and late period (LP) (2080–2099). The orange shading indicates the future permafrost extent, and the blue shading is the mean permafrost extent for 1986–2005.
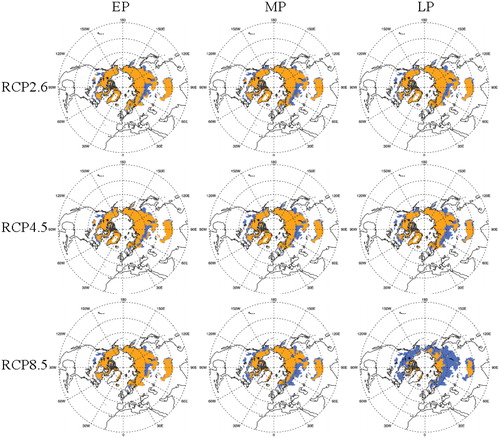
FIGURE 7. The changes in active layer thickness for the three RCPs during the EP (2016–2035), MP (2046–2065), and LP (2080–2099), relative to the reference period of 1986–2005.
In short, changes in ALT are mainly related to the increasing MAAT in persistent permafrost regions in the 21st century, and with the climate warming, the impact of SM and SND on ALT gradually decreases.
Summary and Conclusions
According to the IPCC (CitationStocker et al., 2013), global temperatures will increase more in high latitudes and high-altitude regions. In addition, both SND and SM will show a decreasing trend in the 21st century (CitationHua and Chen, 2011; CitationShi and Wang, 2015), which will have a significant impact on permafrost status. In this paper, we investigated the changes of soil thermal and hydraulic regimes with temperature increasing in the 21st century over permafrost regions.
FIGURE 8. The partial correlations between ALT in persistent permafrost regions and MAAT, snow depth (SND), and SM for the three scenarios (RCP2.6, RCP4.5, and RCP8.5) over the TP, Europe, and NA. The indications for bars are the same as in . HIS, EP, MP, and LP refer to the period of 1986–2005, 2016–2035, 2046–2065, and 2080–2099, respectively.
SM is a crucial variable and plays a robust role in soil thermal and hydraulic regimes in permafrost regions. The strong relationship between SM and the observed MDFP and ALT over the TP illustrates that SM has a significant effect on MDFP and ALT over the TP. Furthermore, employing Kudryavtsev's model, the estimated permafrost extent based on the GLDAS's SM is closer to the result from the IPA than that with a constant SM (CitationAnisimov et al., 1997), which implies that SM is a key factor for estimating permafrost extent. In addition, the relationship between ALT and SM, MAAT, and SND shows that soil thermal and hydraulic regimes varied with the increasing temperature rate and regions. Observations over the period 1986–2005 show that both SM and MAAT significantly contribute to ALT over the TP, and the correlations between them exceed the 90% significance level. In Europe, ALT is mainly related to SND and MAAT, which implies that the soil thermal and hydraulic regimes are different in middle and high latitudes. Over the TP, warming occurs earlier, and the amplitude of warming is larger than that in other regions (CitationLiu and Chen, 2000; CitationZhong et al., 2011); the significant correlation between ALT and MAAT illustrates that MAAT has an important influence on ALT over the TP. Furthermore, SM over the TP has a larger interannual variation than that in NA and Europe (CitationStocker et al., 2013), which suggests that SM has significant effect on ALT over the TP. However, in Europe, where is rich in snow in winter and spring, snow will gradually melt with the temperature increasing, which results in changes in the insulation effects of snow. Hence, snow and temperature both play an important role in ALT in Europe. In NA, especially in northern NA,ALT has large interannual variations, but few significant trends, which is consistent with results from the IPCC (CitationStocker et al., 2013). The relationship between ALT and MAAT, SND, and SM indicates that no single variable significantly contributed to ALT in NA. Therefore, the soil thermal and hydraulic regimes vary regionally.
As the global temperature rises, the near-surface permafrost extent will decrease by 81% for RCP8.5 by the end of the 21st century (CitationStocker et al., 2013). In this study, the permafrost extent estimated by Kudryavtsev models shows that permafrost will disappear along its southern edge. By the end of 2099, there are only 14.7, 12.0, and 5.7 × 10⁶ km2 of permafrost existing for RCP2.6, RCP4.5, and RCP8.5, respectively. Most permafrost completely disappears in the late period for RCP8.5. Relative to the permafrost extent investigated by the IPA, the permafrost area will decrease by 64% by the end of 21st century for RCP8.5; this is less than the projected results from IPCC (CitationStocker et al., 2013), for which the results are based on the surface frost index without considering the impact of SM on permafrost (CitationSlater and Lawrence, 2013). This implies that SM is indeed a key factor for permafrost. Although the results have some uncertainty, it seems certain that permafrost will degrade, and that the soil thermal and hydraulic regimes in permafrost regions will undergo significant changes in the 21st century.
Relative to the reference period of 1986–2005,ALT consistently shows an increasing trend in persistent permafrost regions under the three RCPs during the 21st century, whereas the relationships between ALT and MAAT, SND, and SM illustrate that soil thermal and hydraulic regimes vary with the regions and periods. With increasing temperature, ALT significantly related to MAAT over the TP under RCP4.5 and RCP8.5, whereas the relative significant contribution of SM and SND to ALT only occurs before the middle period under RCP2.6 and RCP4.5, which implies that MAAT is the main contributor to changes in ALT over the TP in the 21 st century. However, in NA, MAAT only has a significant impact on ALT under the RCP2.6 and RCP8.5. With temperature increasing, snow generally begins to melt, and this leads to a significant contribution of snow to ALT for RCP2.6 and RCP4.5. The most significant changes in snow occurred in northern NA (north of 60°N), with the exception of the TP (CitationShi and Wang, 2015), hence, snow may completely disappear under high emission, hence the impact of SND on ALT gradually decreases under RCP8.5. These imply that the thermal and hydraulic regimes in Europe differ from those in NA and the TP. Although MAAT and snow contributes significantly to ALT over the period 1986–2005, all of the contributions of MAAT, SND, and SM gradually decline in the three periods of the 21st century. In Europe, it is rich in snow in winter and spring, with the climate warming, the significant impact of SND on ALT gradually declines and disappears. In general, with increasing temperature, MAAT will still contribute to changes in ALT, whereas the impact of SM and SND will gradually decline. These changes of relationship among ALT, SM, SND, and MAAT reflect the differences of the thermal and hydraulic regimes over permafrost regions.
Although there are uncertainties in this study due to the uncertainty of simulation, CMIP5 outputs can help us quantitatively analyze the characteristics of soil thermal and hydraulic regimes in permafrost regions in the future and deeply understand the feedbacks of permafrost degradation on the local and global climate system.
Acknowledgments
This work was supported by the National Natural Science Foundation of China (91437217, 41471034, and 41661144017) and the National Basic Research Program (2013CBA01808). The soil water content data were obtained from the Global Land Data Assimilation System (GLDAS), and the climate data from the Climatic Research Unit (CRU) .We are grateful for the present and future data from the CMIP5 output.
Related Research Data
References Cited
- Albergel, C. , Rosnay, P. D. , Balsamo, G. , Isaksen, L. , and Muñoz-Sabater, J. , 2012: Soil moisture analyses at ECMWF: evaluation using global ground-based in situ observations. Journal of Hydrometeorology, 13: 1442–1460.
- Anisimov, O. A. , and Nelson, F. E. , 1996: Permafrost distributionin the northern hemisphere under scenarios of climatic change. Global and Planetary Change , 14: 59–72.
- Anisimov, O. A. , Shiklomanov, N. I. , and Nelson, F. E. , 1997: Global warming and active-layer thickness: results from transient general circulation models. Global and Planetary Change , 15: 61–77.
- Bi, H.Y. , 2015 : Evaluation of simulated soil moisture in GLDAS using in-situ measurements over the Tibetan Plateau. Geosciences and Remote Sensing Symposium, 4825–4828, doi http://dx.doi.org/10.1109/IGARSS.2015.7326910 .
- Brown, J. , Ferrians, O. J.,Jr. , Heginbottom, J. A. , and Melnikov, E. S. 1997: Circum-Arctic Map of Permafrost and Ground-Ice Conditions. U.S. Geological Survey in Cooperation with the Circum-Pacific Council for Energy and Mineral Resources, Circum-Pacific Map Series CP-45, scale 1: 10,000,000,1 sheet.
- Burn, C. R. , 1998:The active layer: two contrasting definitions. Permafrost and Periglacial Processes , 9: 411–416.
- Chen, Y. Y. , Yang, K. , Qin, J. , Zhao, L. , Tang, W. J. , and Han, M. L. , 2013: Evaluation of AMSR-E retrievals and GLDAS simulations against observations of a soil moisture network on the central Tibetan Plateau. Journel of Geophysical Research , 118(10): 4466–4475, doi: http://dx.doi.org/10.1002/jgrd.50301 .
- Christensen, T. R. , Johansson, T. , Akerman, H. J. , Mastepanov, M. , Malmer, N. , Friborg, T. , Grill, P. , Svensson, B. H. , 2004: Thawing sub-arctic permafrost: effects on vegetation and methane emissions. Geophysial Research Letters , 31: L04501, doi: http://dx.doi.org/10.1029/2003GL018680 .
- Dyer, J. L. , and Mote, T. L. , 2006: Spatial variability and trends in observed snow depth over North America. Geophysical Research Letters , 33: L16503, doi: http://dx.doi.org/10.1029/2006GL027258 .
- Fyodorov-Davydov, D. G. , Kholodov, A. L. , Ostroumov, V. E. , Kraev, G. N. , Sorokovikov, V. A. , Davudov, S. P. , and Merekalova, A. A. , 2008: Seasonal thaw of soils in the North Yakutian ecosystems. In Kane, D. L. , and Hinkel, K. M. (eds.), Proceedings of the 9th International Conference on Permafrost, 29 June—3 July 2008. Fairbanks: Institute of Northern Engineering, University of Alaska, 481–486.
- Goodrich, L. E. , 1982: The influence of snow cover on the ground thermal regime. Canadian Geotechnical Journal , 19: 421–432.
- Gruber, S. , 2012: Derivation and analysis of a high-resolution estimate of global permafrost zonation. The Cryosphere , 6: 221–233, doi: http://dx.doi.org/10.5194/tc-6-221-2012 .
- Guglielmin, M. , Dalle Fratte, M. , and Cannone, N. , 2014: Permafrost warming and vegetation changes in continental Antarctica. Environmental Research Letters , 9: 045001, doi: http://dx.doi.org/10.1088/1748-9326/9/4/045001 .
- Guo, D. L. , Wang, H. J. , and Li, G. , 2012: A projection of permafrost degradation on the Tibetan Plateau during the 21st century. Journal of Geophysical Research , 117: D05106, doi http://dx.doi.org/10.1029/2011JD016545 .
- Heginbottom, J. A. , Brown, J. , Melnikov, E. S. , and Ferrians, O. J.,Jr. , 1993: Circumarctic map of permafrost and ground ice conditions. In Proceedings of the Sixth International Conference on Permafrost, Vol. 2. Wushan, Guangzhou, China: South China University of Technology Press, 1132–1136.
- Hinkel, K. M. , and Nelson, F. E. , 2003: Spatial and temporal patterns of active layer thickness at Circumpolar Active Layer Monitoring (CALM) sites in northern Alaska, 1995– 2000. Journal of Geophysical Research , 108(D2): 8168, doi: http://dx.doi.org/10.1029/2001JD000927 .
- Hinzman, L. D. , Goering, D. G. , Kinney, T. C. , and Li, S. , 1997: Numerical simulation of thermokarst formation during disturbance. In Crawford, R. M. (ed.), Disturbance and Recovery in Arctic Lands: an Ecological Perspective. Dordrecht, Netherlands: Kluwer Academic Publishers, 191–211.
- Hinzman, L. D. , Bettez, N. D. , Bolton, W. R. , Chapin, F. S. , Dyurgerov, M. B. , Fastie, C. L. , Griffith, B. , Hollister, R. D. , Hope, A. , Huntington, H. P. , Jensen, A. M. , Jia, G. J. , Jorgenson, T. , Kane, D. L. , Klein, D. R. , Kotinas, G. , Lynch, A. H. , Lloyd, A. H. , McGuire, A. D. , Nelson, F. E. , Oechel, W. C. , Osterkamp, T. E. , Racine, C. H. , Romanovsky, V. E. , Stone, R. S. , Stow, D. A. , Sturm, M. , Tweedie, C. E. , Vourlitis, G. L. , Walker, M. D. , Walker, D. A. , Webber, P. J. , Welker, J. M. , Winker, K. , and Yoshikawa, K. , 2005: Evidence and implications of recent climate change in northern Alaska and other Arctic regions. Climatic Change , 72: 251–298.
- Hua, W. J. , and Chen, H. S. , 2011: Response of land surface processes to global warming and its possible mechanism based on CMIP3 multi-model ensemble. Chinese Journal of Atmosphere Sciences , 35: 121–133.
- Instanes, A. , Anisimov, O. , Brigham, L. , Goering, D. , Khrustalev, L. N. , Ladanyi, B. , Larsen, J. O. , Smith, O. , Stervermer, A. , Weatherhead, B. , and Weller, G. , 2005: Infrastructure:Buildings, support systems, and industrial facilities. In Arctic Climate Impact Assessment. New York: Cambridge University Press: 907–944.
- Ishikawa, M. , Sharkhuu, N. , Zhang, Y. S. , Kadota, T. , and Ohata, T. , 2005: Ground thermal and moisture conditions at the southern boundary of discontinuous permafrost, Mongolia. Permafrost and Periglacial Processes , 16: 209–216.
- Jafarov, E. E. , Romanovsky, V. E. , Genet, H. , McGuire, A. D. , and Marchenko, S. S. , 2013: The effects of fire on the thermal stability of permafrost in lowland and upland black spruce forests of interior Alaska in a changing climate. Environmental Research Letters , 8(3): 035030, doi: http://dx.doi.org/10.1088/1748-9326/8/3/035030 .
- Ji, L. , Senay, G. B. , and Verdin, J. P. , 2014: Evaluation of the Global Land Data Assimilation System (GLDAS) air temperature data products. American Geophysical Union Fall Meeting Abstracts : 0818.
- Jin, H. , Li, S. , Cheng, G. , Wang, S. , and Li, X. , 2000: Permafrost and climatic change in China. Global and Planetary Change , 26: 387–404.
- Jorgenson, M.T. , Racine, C. H. , Walters, J. C. , and Osterkamp, T. E. , 2001: Permafrost degradation and ecological changes associated with a warming climate in central Alaska. Climatic Change , 48: 551–579.
- Kane, D. L. , Hinzman, L. D. , and Zarling, J. P. , 1991:Thermal response of the active layer to climate warming in a permafrost environment. Cold Regions Science and Technology , 19:111–122.
- Kane, D. L. , Hinkel, K. M. , and Goering, D. J. , 2001: Nonconductive heat transfer associated with frozen soils. Global and Planetary Change , 29: 275–292.
- Koichi, U. , 1986: Conductive heat flux through active layer in tundra plain. Journal of the Faculty of Science, Hokkaido University, Series 7, Geophysics , 8(1): 29–35.
- Kudryavtsev, V. A. , Garagulya, L. S. , Kondrat'yeva, K. A. , and Melamed, V. G. , 1974: Fundamentals of frost forecasting in geological engineering investigations. Moscow: Nauka, 431 pp. (in Russian) (English translation appears as U.S. Army Cold Regions Research and Engineering Laboratory Draft Translation 606).
- Li, X. , Cheng, G. D. , Jin, H.J. , Kang, E.S. , Che, T. , Jin, R. , Wu, L. Z. , Nan, Z.T. , Wang, J. , and Shen, Y.P. , 2008: Cryospheric change in China. Global and Planetary Change , 62: 210–218.
- Li, X. , Jin, R. , Pan, X. D. , Zhang, T. J. , and Guo, J.W. , 2012: Changes in the near-surface soil freeze-thaw cycle on the Qinghai-Tibetan Plateau. International Journal of Applied Earth Observation and Geoinformation , 17: 33–42.
- Liu, X. D. , and Chen, B. D. , 2000: Climatic warming in the Tibetan Plateau during recent decades. International Journal of Climatology , 20: 1729–1742.
- Mackay, J. R. , 1995: Active layer changes (1968 to 1993) following the forest-tundra fire near Inuvik, N.W.T., Canada. Arctic and Alpine Research , 27: 323–336.
- Mazhitova, G. G. , 2008: Soil temperature regimes in the discontinuous permafrost zone in the east European Russian Arctic. Eurasian Soil Science , 41: 48–62.
- McNamara, J. P. , Kane, D. L. , and Hinzman, L. D. , 1998: An analysis of streamflow hydrology in the Kuparuk River basin, Arctic Alaska: a nested watershed approach. Journal of Hydrology , 206:39–57.
- Nelson, F. E. , and Anisimov, O. A. , 1993: Permafrost zonation in Russia under anthropogenic climatic change. Permafrost and Periglacial Processes , 4: 137–148.
- Nelson, F. E. , Shijlomanov, N. I. , Mueller, G. , Hinkel, K. M. , Walker, D.A. , and Bockheim, J. G. , 1997a: Estimating active-layer thickness over a larger region: Kupaaruk River basin, Alaska, U.S.A. Arctic and Alpine Research , 29: 367–378.
- Nelson, F. E. , Mueller, G. R. , and Shiklomanov, N. I. , 1997b: Sample design for assessing variability of activelayer thickness. Abstracts of the 93rd Annual Meeting of the Association of American Geographers : p. 191.
- Park, H. , Walsh, J. , Fedorov, A. N. , Sherstiukov, A. B. , Lijima, Y. , and Ohata, T. , 2013: The influence of climate and hydrological variables on opposite anomaly in activelayer thickness between Eurasian and North American watersheds. The Cryosphere , 7: 631–645.
- Park, H. , Fedorov, A. N. , Zheleznyak, M. N. , Konstantinov, P.Y. , and Walsh, J. E. , 2015: Effect of snow cover on panArctic permafrost thermal regimes. Climate Dynamics , 44(9–10): 2873–2895.
- Peng, H. , Ma, W. , Mu, Yh. , Jin, L. , and Yuan, K. , 2015: Degradation characteristics of permafrost under the effect of climate warming and engineering disturbance along the Qinghai—Tibet Highway. Natural Hazards , 75(3): doi: http://dx.doi.org/10.1007/s11069-014-1444-5 .
- Pogliotti, P. , Guglielmin, M. , Cremonese, E. , Morra di Cella, U. , Filippa, G. , Pellet, C. , and Hauck, C. , 2015: Warming permafrost and active layer variability at Cime Bianche, Western European Alps. The Cryosphere , 9: 647–661.
- Rodell, M. , Houser, P.R. , Jambor, U. , Gottschalck, J. , Mitchell, K. , Meng, C.-J. , Arsenault, K. , Cosgrove, B. , Radakovich, J. , Bosilovich, M. , Enfin, J. K. , Walker, J. P. , Lohmann, D. , and Toll, D. , 2004: The global land data assimilation system. Bulletin of the American Meteorological Society , 85: 381–394.
- Sazonova, T. S. , Romanovsky, V. E. , Walsh, J. E. , and Sergueev, D. O. , 2004: Permafrost dynamics in the 20th and 21st centuries along the East Siberian transect. Journal of Geophysical Research , 109: D01108, doi: http://dx.doi.org/10.1029/2003JD003680 .
- Shi, H. X. , and Wang, C. H. , 2015: Projected 21st century changes in snow water equivalent over northern hemisphere landmasses from the CMIP5 model ensemble. The Cryosphere , 9: 1943–1953, doi: http://dx.doi.org/10.5194/tc-9-1943-2015 .
- Slater, A. G. , and Lawrence, D. M. , 2013: Diagnosing present and future permafrost from climate models. Journal of Climate , 26: 5608–5623.
- Smith, L. C. , Sheng, Y. , MacDonald, G. M. , and Hinzman, L. D. , 2005: Disappearing arctic lakes. Science , 308:p. 1429.
- Smith, S. L. , Romanovsky, V. E. , Lewkowicz, A. G. , Burn, C. R. , Allard, M. , Clow, G. D. , Yoshikawa, K. , and Throop, J. , 2010: Thermal state of permafrost in North America: a contribution to the International Polar Year. Permafrost and Periglacial Processes , 21: 117–135, doi: http://dx.doi.org/10.1002/ppp.690 .
- Sobota, I. , and Nowak, M. , 2014: Changes in the dynamics and thermal regime of the permafrost and active layer of the High Arctic coastal area in north-west Spitsbergen,Svalbard. Geografiska Annaler: Series A, Physical Geography : 96: 227–240, doi: http://dx.doi.org/10.1111/geoa.12045 .
- Stocker, T. F. , Qin, D. H. , Plattner, G. K. , Tignor, M. M. B. , Allen, S. K. , Boschung, J. , Nauels, A. , Xia, Y. , Bex, V. , Midgley, P. M. , and the IPCC Working Group, 2013: The Scientific Basis, Working Group I Contribution to the Fifth Assessment Report of the Intergovernmental Panel on Climate Change, Summary for Policymakers. New York: Cambridge University Press.
- Tian, H. , Wang, C. H. , Wen, J. , Wang, X. , Lu, D. R. , and Lv, S. N. , 2012: Soil moisture estimation over an arid environment in Mongolia from passive microwave remote sensing based on a simplified parameterization method. Chinese Journal of Geophysics , 55: 415–427, https://www.researchgate.net/publication/278105546_Soil_moisture_estimation_over_an_arid_environment_in_Mongolia_from_passive_microwave_remote_sensing_based_on_a_simplified_parameterization_method (in Chinese).
- Walker, G. , 2007: A world melting from the top down. Nature , 446:718–721.
- Walter, K. M. , Zimov, S. A. , Chanton, J. P. , Verbyla, D. , and Chapin, F. S. , 2006: Methane bubbling from Siberian thaw lakes as a positive feedback to climate warming. Nature , 443: 71–75.
- Wang, C. H. , Jin, S. L. , Wu, Z.Y. , and Cui, Y. , 2009: Evaluation and application of the estimation methods of frozen (thawing) depth over China. Advances in Earth Science , 24: 132–140.
- Wang, C. H. , Jin, S. L. , and Shi, H. X. , 2014: Area change of the frozen ground in China in the next 50 years. Journal of Glaciology and Geocryology , 36: 1–8, doi: http://dx.doi.org/10.7522/j.issn.10000240.2014.000 .
- Wang, Z. L. , and Wang, C. H. , 2012: Predicting the snow water equivalent over China in the next 40 years based on the climate models from IPCCAR4. Journal of Glaciology and Geocryology , 34: 1273–1283.
- Wu, Q. , Shen, Y. , and Shi, B. , 2003: Relationship between frozen soil together with water-heat process and ecological environment in the Tibetan Plateau. Journal of Glaciology and Geocryology , 25: 250–254 ( in Chinese).
- Wu, Q. B. , and Zhang, T. J. , 2010: Changes in active layer thickness over the Qinghai-Tibetan Plateau from 1995 to 2007. Journal of Geophysical Research , 115: D09107, doi: http://dx.doi.org/10.1029/2009JD012974 .
- Xie, C.W. , Zhao, L. , Wu, T.H. , and Dong,X.C. , 2012: Changes in the thermal and moisture regime within the active layer in the Qinghai-Tibet Plateau. Journal of Mountain Science , 9: 483–491.
- Yi, S. , Woo, M.-K. , and Arain, A. M. , 2007: Impacts of peat and vegetation on permafrost degradation under climate warming. Geophysical Research Letters , 34: L16504, doi: http://dx.doi.org/10.1029/2007/GL030550 .
- Yi, S. , McGuire, A. D. , Harden, J. , Kasischke, E. , Manies, K. L. , Hinzman, L. D. , Liljedahl, A. , Randerson, J. T. , Liu, H. , Romanovsky, V. E. , Marchenko, S. , and Kim, Y. , 2009a: Interactions between soil thermal and hydrological dynamics in the response of Alaska ecosystems to fire disturbance. Journal of Geophysical Research , 114: G02015, doi: http://dx.doi.org/10.1029/2008JG000841 .
- Yi, S. , Manies, K. L. , Harden, J. , and McGuire, A. D. , 2009b: The characteristics of organic soil in black spruce forests: implications for the application ofland surface and ecosystem models in cold regions. Geophysical Research Letters , 36: L05501, doi: http://dx.doi.org/10.1029/2008GL037014 .
- Yi, S. , McGuire, A. D. , Kasischke, E. , Harden, J. , Manies, K. L. , Mack, M. , and Turetsky, M. R. , 2010: A dynamic organic soil biogeochemical model for simulating the effects of wildfire on soil environmental conditions and carbon dynamics of black spruce forests. Journal of Geophysical Research , 115: G04015, doi: http://dx.doi.org/10.1029/2010JG001302 .
- Yu, F. , Qi, H. L. , Yao, X. L. , and Liu, Y. Z. , 2015: Comparison of permafrost degradation under natural ground surfaces and embankments of the Qinghai-Tibet Highway. Cold Regions Science and Technology , 114: 1–8.
- Yu, L. , and Wang, C. H. , 2009:The application and improving of Nelson frost index over the Tibet Plateau. China Science Paper 2: 1–10 ( in Chinese).
- Yu, L. , and Wang, C. H. , 2012:The simulation and revision of soil moisture over Tibetan Plateau. Acta Physica Sinica , 61: 029201–029028.
- Zhang, T. , Osterkamp, T. E. , and Stamnes, K. , 1997: Effects of climate on the active layer and permafrost on the North Slope of Alaska, USA. Permafrost and Periglacial Processes , 8: 45–67.
- Zhang, T.J. , Oliver, W. , Frauenfeld, M. Serreze, C. , Etringer, A. , Oelke, C. , McCreight, J. , Barry, R. G. , Gilichinsky, D. , Yang, D. , Ye, H. , Ling, F. , and Chudinova, S. , 2005: Spatial and temporal variability in active layer thickness over the Russian Arctic drainage basin. Journal of Geophysical Research , 110: D16101, doi: http://dx.doi.org/10.1029/2004JD005642 .
- Zhang, Y. , Chen, W. , and Cihlar, J. , 2003 : A process-based model for quantifying the impact of climate change on permafrost thermal regimes. Journal of Geophysical Research , 108(D22): 4695, doi: http://dx.doi.org/10.1029/2002JD003354 .
- Zhao, L. , Wu, Q.B. , Marchenko, S. S. , and Sharkhuu, N. , 2010: Thermal state of permafrost and active layer in Central Asia during the International Polar Year. Permafrost and PeriglacialProcesses , 21: 198–207.
- Zhong, L. , Su, Z. B. , Ma,Y. M ., Salama, M. S. , and Sobrino, J. A. , 2011: Accelerated changes of environmental conditions on the Tibetan Plateau caused by climate change. Journal of Climate , 24: 6540–6550.