
Abstract
Heterogeneous mass wastage has been found across the northwestern Tibet Plateau, and both slight positive and negative average mass budgets were observed using different data sets during the past decades. The north bank of the Bangong Co Basin partly covers the Western Kunlun Mountains and Karakoram Mountains. The assessment of glacier mass budget in this region over a long period is of particular interest to understanding the regional diversity of the mass changes of glaciers. Changes in glacier mass in the area of concern were assessed by differentiation of digital elevation models (DEMs) from the earliest available topographic maps, the Shuttle Radar Terrain Mission (SRTM), and the Advanced Space-borne Thermal Emission and Reflection Radiometer (ASTER) stereo images. Results show that glaciers in this basin have in general experienced a decelerated mass loss but with regional differences. Glaciers were found to have lost a volume of 4.45 ± 0.63 km3 from 1968 to 2007, corresponding to -0.18 ± 0.03 m a-1 water equivalent (w.e.) in the north bank of the Bangong Co Basin. Loss of glacier mass in this region from 1999 to 2007 was 0.11 ± 0.12 m w.e. a-1, which was approximately half the loss that occurred from 1968 to 1999 (-0.20 ± 0.01 m w.e. a-1). From 1968 to 1999, higher mass losses were found in the north with smaller losses in the south, while from 1999 to 2007 there was more loss of mass in the southeast and a somewhat balanced mass budget in the northeast.
Introduction
Approximately 30% of the rise in the global mean sea level (3.2 mm a-1) in the past decade can be attributed to changes in glaciers (CitationGardner et al., 2013; IPCC, 2013). The determination of glacier mass balance is one of the primary focuses of glaciologists (CitationKhalsa et al., 2004). Glacier shrinkage has been linked to climate warming during recent decades, and it has been observed in all key mountain systems, for example, the Himalayas (CitationBolch et al., 2012), Tian Shan (CitationSurazakov and Aizen, 2006; CitationSorg et al., 2012), Altai (CitationSurazakov et al., 2007; CitationNarozhniy and Zemtsov, 2011), and others (CitationYao et al., 2012; CitationNeckel et al., 2014). Despite the fact that most glaciers in the Tibetan Plateau (TP) have experienced a continuous and accelerating recession during the last several decades (CitationYao et al., 2012; CitationWei et al., 2014), heterogeneous behavior of mass budgets since 2000 has been detected in the TP. Observations showed mass gains for glaciers in the central north and northwestern TP that were different from the mass loss for glaciers in other parts of the TP (CitationNeckel et al., 2014). Arguments exist for a slight mass gain or loss in the Karakoram Mountains and Western Kunlun Mountains (Gardelie et al., 2012b; CitationKääb et al., 2012; CitationGardner et al., 2013). Further investigation is required regarding ice mass changes in regions not covered well by previous studies. Changes in mass must also be considered on longer time scales. The Bangong Co (also referred to as Pangong Tso or Nganglha Ringpo) Basin receives runoff from both the Karakoram and Western Kunlun Mountains. Recent study has shown that, from the 1970s to 2009, the glaciers in the Bangong Co Basin experienced a general recession in area at a rate of 0.12%- a-1 (CitationWei et al., 2014). Changes in glacier mass in this region during a similar period are of particular interest to researchers and can aid understanding of the glacier behavior of the past 40 years.
The harsh complex topography and extreme weather have restricted the extent and duration of glaciological field observations of glaciers in remote locations. The geodetic method supplies an alternative to measure the mass budgets (CitationKääb, 2002; CitationKhalsa et al., 2004; CitationShangguan et al., 2009). The goal of the present study is to assess changes in glacier volume in the Bangong Co Basin by investigating glaciers on the north bank of the basin (here, for short, simplified as NBBCB) using the geodetic method based on historical topographic maps, the Shuttle Radar Topography Mission (SRTM), and the stereo images of the Advanced Space-borne Thermal Emission and Reflection Radiometer (ASTER). After relative adjustments of horizontal and vertical biases between the digital elevation models (DEMs) derived from the three data sets, the specific mass balance of glaciers were calculated for the periods investigated and the mass budget of the whole NBBCB was determined as the weighted average.
Study Area
The study area is located in the northwestern TP (33°60′–34°28′N. 78°44′–80°18′E; ) and corresponds to the 5Z421 entry of the World Glacier Inventory (see CitationWei et al., 2014). This region is surrounded by the southern part of the Western Kunlun Mountains, the northeast of the Karakoram Mountains, and Bangong Co to the south. Bangong Co is a transboundary lake basin between western TP and Kashmir. It has a long, narrow shape and a length of 125 km. In the center of the study area was a lake named Ze Co (Dré Tso) with an area of 112.7 km2 and an altitude of 4961 m fed by the surrounding highly glacierized area according to the topographic conditions in the Western Kunlun Mountains (CitationWang et al., 1998; CitationShi et al., 2008). The Chinese Glacier Inventory of 2009 (CGI2009) recorded 1023 glaciers in the NBBCB with a total area of 534.77 km2 and equilibrium line altitudes (ELAs) of 5594–6519 m (CitationWei et al.. 2014). There were 7 glaciers larger than 10 km2, with the largest one (24.2 km2) located on the eastern bank of Ze Co. In the period between the 1970s and 2009, glaciers in this area showed moderate recession with an area of shrinkage of 7.07% (0.18% a-1) (CitationWei et al., 2014). The climate pattern of the NBBCB is predominantly westerly influenced and can be characterized as cold and arid. As indicated by the measurements by the scientific expedition of Chinese Academy of Sciences in the 1980s, the mean annual air temperature was between -6 and -4 °C and the annual precipitation was within the range of 50–75 mm (CitationWang et al., 1998; CitationShi et al., 2008; CitationMaussion et al., 2014). From 1955 to 2004 in the northwestern TP the mean annual air temperature increased by 1.4 °C and the annual precipitation showed a slight increase (CitationWang et al., 2008).
FIGURE 1. Sketch map of the study area. Glacier outlines were based on the Chinese Glacier Inventory of 2009 (CitationWei et al., 2014). Subregions are indicated as I, II, III, and IV.
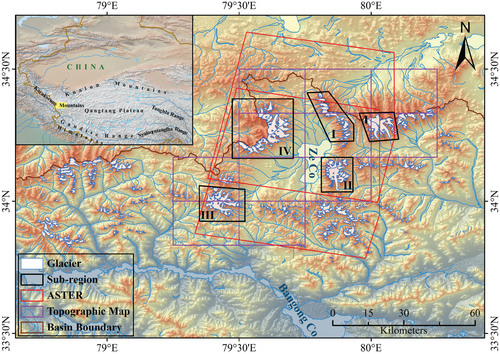
In the NBBCB, there are four highly glacierized regions where all of the glaciers larger than 10 km2 were distributed. For convenience, the four regions were classified into assessment subregions I, II, III, and IV, respectively ( and ). Subregions I and IV were more highly glacierized and had larger mean glacier sizes than other subregions. Subregion IV had the highest glacier tongue but the smallest glacier extent and range of ELA. The most pronounced shrinkage in glacier extent was found in Subregion III, with the smallest mean glacier size of 0.74 km2 and an annual area recession rate of 0.27% a-1. The area recession rates during the period from the 1970s to 2009 were only 0.03% a-1 and 0.02% a-1 for glaciers in Subregions I and II, respectively (CitationWei et al.l 2014).
Data and Methods
HISTORICAL TOPOGRAPHIC MAPS
The historical topographic maps used in the present study were constructed from aerial photographs taken in 1968 and 1980 with a scale of 1:50,000. These maps provide a fine depiction of glacier surface topography and have been widely used for glaciological purposes (CitationShangguan et al., 2008; CitationLi et al., 2010; CitationShangguan et al., 2010; CitationZhang et al., 2010; CitationZhang et al., 2012a; CitationZhang et al., 2012b; CitationXu et al., 2013). To obtain data coverage for the glaciers in the subregions, 10 topographic maps were collected. Three of these maps covered only Subregion III and were constructed in 1980; the others covering Subregions I, II, and IV were constructed in 1968 ( and ). All maps used the coordinates of the BI54 GEOID (datum level is Yellow Sea mean sea level at Qingdao Tidal Observatory in 1956) and were georeferenced into WGS84/EGM96 with a spatial resolution of 30 m (called TOPO hereafter). According to the national photogrametrical mapping standard. these topographic maps were constrained by nominal vertical accuracies better than 5 m for gentle slope area <6° and 8 m for areas with slopes between 6° and 25° (GB/T 12343.1-2008, 2008). In the NBBCB, the mean slope of glaciers ranged from 13.9° to 18.1° (). The accuracy of these TOPO maps was here considered better than 8 m on the glacierized terrain.
TABLE 1 Statistical characteristics of glaciers in four subregions based on the Chinese Glacier Inventory of 2009. The annual area recession was derived from Wei et al. (Citation2014).
SRTM DEM
The SRTM DEM has a spatial resolution of approximately 90 m (hereafter referred to as SRTM) and was derived from C-band radar interferometry using data collected in February 2000 (Citationvan Zyl, 2001). The SRTM was packaged into I° × I° tiles with the coordinate system of WGS84/EGM96 and a specified vertical accuracy of 16 m with a 90% confidence level (Berliner et al., 2006). However, studies have shown that the accuracy in flat areas was better than 10 m and was significantly impacted by slope (Berliner et al., 2004; CitationCarabajal and Harding, 2005; Rodríguez et al., 2006; CitationJacobsen, 2010). In the present study, three original SRTM tiles () were selected from the United States Geological Survey (USGS) (http://dds.cr.usgs.gov/srtm/version2_1/SRTM3/) to roughly demonstrate the glacier surface characteristics of 1999. The penetration of the SRTM C-band into snow and ice can affect the results recorded regarding changes in glacier surface elevation. Penetration depth can range from 0 to 10 m depending on temperature and water content (CitationDall and Madsen, 2001; CitationPapa et al., 2002; Berliner et al., 2006). A separate SRTM DEM simultaneously acquired by X-band beam served as an alternative measurement to quantify the penetration depth, because the penetration depth of the X-band beam is much smaller than C-band, and the elevation difference between these two data sets was considered as a first approximation for the penetration of C-band into snow and ice (CitationGardelle et al., 2012a). Then comparison of the SRTM C-band and X-band showed a 1.94 m average penetration of SRTM C-band signal into snow and ice in the study area. According to the requirements for the comparison of multisource DEMs, the SRTM was resampled into 30 m spatial resolution.
TABLE 2 Details of data sets used in the study.
ASTER DEM
Due to their high spatial resolution (15 m) and reliability, ASTER stereo images have been widely used with the geodetic method for the determination of changes in glacier volume and mass balance (CitationSan and Suzen, 2005; CitationBolch et al., 2008; CitationKääb, 2008; CitationToutin, 2008; CitationMiller et al., 2009; CitationTrisakti et al., 2009). The vertical accuracies of DEMs extracted from ASTER images varied in the range of 7–20 m (CitationKääb, 2008; CitationToutin, 2008). Fujisada (Citation1998) recommended the stereo images acquired in autumn as suitable for DEM extraction because of the low snow/cloud conditions and the superior radiometric contrast on the glacierized terrain. An ASTER stereo image pair acquired in November 2007 was used in the present study and covers all glaciers in the subregions, except for Subregion III which had significant cloud cover. This was substituted with another ASTER image acquired in September 2005 (). The ASTER DEMs were generated using the DEM Extraction Model of ENVI 4.7 and more than 20 ground control points (GCPs) on ice-free terrain for each subregion. These GCPs were obtained from TOPO and Landsat ETM+ images (acquired in 2008) as the elevation and horizontal references, respectively. The DEMs were then georeferenced into the coordinate system of WGS1984/EGM96 with a spatial resolution of 30 m (hereafter referred to as ASTER). The similar trend and characteristics between TOPO, SRTM, and ASTER indicate that the three corresponding DEMs were coincident and applicable for estimation of glacier mass budgets based on the geodetic method (CitationRacoviteanu et al., 2007).
BIAS CORRECTIONS OF DEMS AND ERROR COMPUTATION
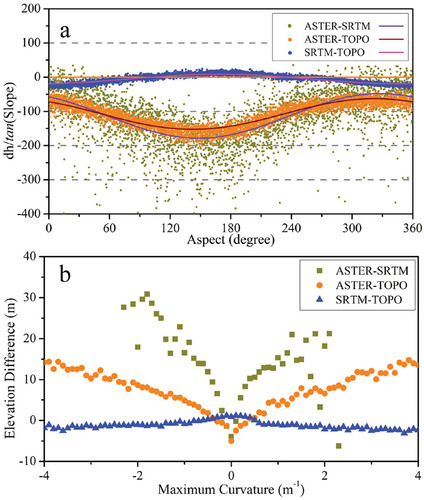
The complex conditions regarding acquisition, generation, and production of data sets create the relative distortion manifested as horizontal and vertical biases that exist even between DEMs acquired in the same area (CitationBerthier et al., 2005). These biases produce the considerable uncertainty in results based on elevation differences of multi-DEMs and should be adjusted before assessing changes in glacier volume (CitationDall and Madsen, 2001; CitationRacoviteanu et al., 2007; CitationShugar et al., 2010). Uncertainty can be estimated using both absolute and relative accuracy. The former should be assessed by field measurements, which are frequently unavailable for remote regions, but the latter is widely used and can be estimated using reference data sets with higher spatial resolution and quality (CitationBolch et al., 2011; CitationGardelle et al., 2012b; CitationKääb et al., 2012; CitationPieczonka et al., 2013; CitationXu et al., 2013 ). In the present study, TOPO served as the reference DEM. Adjustments were earned out based on the elevation differences over ice-free terrain by assuming that no changes in elevation had occurred during the study period, which was relatively short (decades). To identify the non-glacierized area and remove the influence of glacier fluctuation, a mask of the glaciers was obtained by merging the ice coverage derived from the modified Chinese Glacier Inventory of the 1970s (CGI1970) and CGI2009 (CitationWei et al., 2014). In general, the elevation differences in the non-glacierized area showed a strong relationship to topography attributes, that is, aspect, slope, altitude, and max curvature (CitationKääb, 2005; CitationPieczonka et al., 2010; CitationMiliaresis and Paraschou, 2011; CitationGardelle et al., 2012a; CitationPieczonka et al., 2013). There is a significant correlation between standardized elevation differences due to the horizontal shifts and the corresponding slope and aspect, and this relationship can be described by a sinusoidal relationship as a universal co-registration correction (CitationNuth and Kääb, 2011). To fulfill the requirements for comparing different data sets, the SRTM DEMs were resampled into a common spatial resolution of 30 m. This resolution harmonization resulted in elevation biases that can be taking into account the relationship between elevation differences and corresponding maximum curvatures (CitationGardelle et al., 2012a). These relationships between elevation differences versus aspect and maximum curvature were then used for relative adjustments (). Extreme outliers cannot be taken into account well and must be removed using a threshold method, for example, ±100 m in previous studies by Berliner et al. (2010) and Bolch et al. (Citation2011) and ±80–150 m by Gardelle et al. (Citation2013). Statistical characteristics of elevation differences have also been used (Höhle and Höhle, 2009; CitationPieczonka et al., 2013). Herein, pixels representing elevation differences outside the range of 5%-95% were excluded to correct for biases, and then errors were computed (CitationGardelle et al., 2013; CitationPieczonka et al., 2013). The horizontal displacements after the above-mentioned adjustments are listed in . Results showed that the horizontal biases of ASTER relative to TOPO and SRTM were larger than that between TOPO and SRTM. The most significant bias was found in Subregion I between ASTER and SRTM with a y-direction displacement of 142.92 m. The displacements between SRTM and TOPO were less than 13.64 m, indicating superior agreement between the two data sets. This can be observed via the distribution of the frequency histogram of elevations from the adjusted DEMs ().
After relative adjustments, the residual elevation differences over non-glacierized area indicated better accuracy relative to the reference DEM. For repeated measurements, the error Es of mean elevation difference among DEMs should be evaluated using the standard deviation (SD) based on error propagation:
where N is the number of independent measurements. A slightly conservative decorrelation distance of 600 m was selected for the four subregions under the assumption that the auto-correlation of pixels separated by this distance was negligible (CitationBerthier et al., 2010; CitationBolch et al., 2011). The auto-correlation distance may be different if the spatial resolution is different. Koblet et al. (Citation2010) used the decorrelation distance of 100 m for DEMs with 5 m spatial resolution. Based on the Moran's I auto-correlation index, Gardelle et al. (Citation2013) identified auto-correlation distances of 492 ± 72 m for DEMs with 40 m spatial resolution that corresponded to nine regions of the Pamir-Karakoram-Himalaya mountain ranges. Finally, the accuracy E can be estimated with the combination of mean elevation difference E m (CitationBolch et al., 2011):
FIGURE 2. Histograms of elevation distributions for the multi-DEMs covering four subregions. The altitude interval is 50 m.
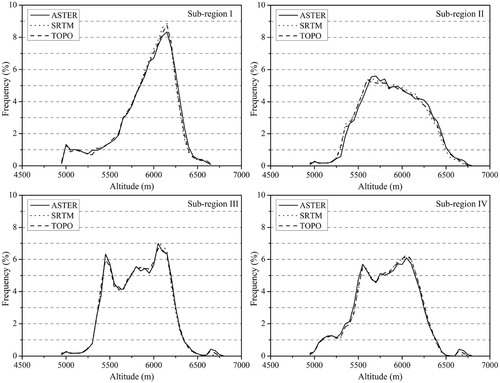
TABLE 3 Displacement between multi-DEMs in four subregions.
The estimated errors were calculated and are shown in . The Em , whose original values ranged from -15.80 to 25.36 m, decreased significantly and was approximately equal to zero after adjustments. The final accuracy was controlled within ±1.54 m. This indicates that the adjustments between DEMs are acceptable and the bias-corrected data sets are suitable for determining the changes in surface elevation of glaciers in the study area.
ESTIMATION OF GLACIER MASS BALANCE
The difficulty in converting changes in glacier volume to mass budget places an important limitation on the geodetic measurement according to the heterogeneous firn-ice transition (CitationNuth et al., 2010; CitationHuss, 2013). Under the assumption of a stable density profile, a simple and constant density of 900 kg m-3 is usually used for glaciers (CitationZemp et al., 2010; CitationBolch et al., 2011; CitationPicczonka et al., 2013). In addition, Kääb et al. (Citation2012) used density scenarios of 600 kg m-3 for the accumulation area and 900 kg m-3 for the ablation area to analyze the sensitivity of density in mass balance estimation of Himalayan glaciers. On the basis of a firn compaction model, Huss (Citation2013) proposed a constant density of 850 kg m-3 for ice-to-mass conversion. Due to the lack of density profile estimations for the NBBCB, a constant density of 850 kg m-3 with an uncertainty of ±60 kg m-3 was used here as recommended by Huss (Citation2013).
FIGURE 3. Adjustments of elevation errors based on (a) sinusoidal relationship, and (b) maximum curvature in subregion II.
Correction for the seasonality of glacier mass balances should be considered when deriving mass balance from geodetic measurements that do not cover time periods that correspond to an integer number of years (CitationGardelle et al., 2012b). Because the mean annual precipitation in the study area is less than 100 mm, seasonality was here assumed to be negligible relative to other uncertainties (CitationWang et al., 1998; CitationMaussion et al., 2014).
The overall glacier mass balance of the whole basin was calculated as the glacier-area-weighted average. This method was chosen because the mass budgets of glaciers in the subregions were representative of glaciers influenced by the similar geographical settings (CitationBolch et al., 2012; CitationKääb et al., 2012; CitationPieczonka et al., 2013). The glacier areas of the subregions used for averaging were extracted from the specific glacier coverage.
Results
The results of this work revealed an average decrease in surface elevation of 7.75 ± 1.10 m for glaciers in the NBBCB from 1968 to 2007, corresponding to an overall volume loss of 4.45 ± 0.63 km3 (-0.10 ± 0.02 km3 a-1) and equivalent to a slight mass deficit of 0.18 ± 0.03 m w.e. a-1 (). The current results also show a slowdown of the mass deficit during the early years of the 21st century. On average, the surface lowering in the period 1968-1999 was 7.03 ± 0.40 m (-0.20 ± 0.01 m w.e. a-1). The lowering was only 0.98 ± 0.97 m from 1999 to 2007, corresponding to specific mass balances of -0.11 ± 0.12 m w.e. a-1.
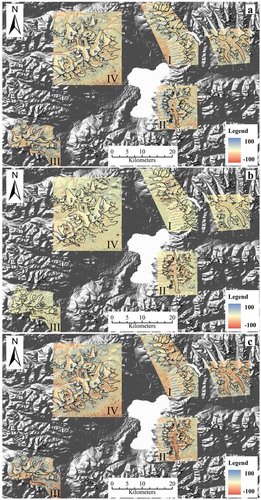
There were regional differences in the changes in glacier mass in the subregions during the considered periods ( and ). The mass wastage from 1968 to 1999 was not homogeneously distributed. The mass losses of glaciers in Subregions II and III (-0.18 ± 0.02 m w.e. a-1 and -0.17 ± 0.01 m w.e. a-1 respectively) were slightly less pronounced than those of Subregions I and IV (-0.22 ± 0.01 m w.e. a-1). From 1999 to 2007, mass wastage decreased but showed a more diverse pattem than in the early period, that is, more negative mass balance for glaciers in Subregion II (-0.16 ± 0.16 m w.e. a-1), less mass loss for glaciers in Subregion I (-0.08 ± 0.08 m w.e. a-1), and intermediate values for Subregions III and IV (∼-0.11 m w.e. a-1). This spatially heterogeneous change in glacier mass during 1968 and 2007 was less obvious than that of the mass changes during the periods 1968-1999 and 1999–2007, with mass deficits of 0.16 ± 0.05 m w.e. a-1 to 0.19 ± 0.02 m w.e. a-1 in the subregions investigated here.
Discussion
In this study, geodetic measurements based on historical topographic maps, SRTM, and ASTER stereo images were used to determine the changes in glacier volume and mass balance. Although relative adjustments of horizontal and vertical biases were carried out. the remaining uncertainty in the estimations of the radar penetration depth and density profile for ice-to-mass conversion is worth discussing.
TABLE 4 Statistical characteristics of original and adjusted errors of multi-DEMs assessed in four subregions in the non-glacierized area.
The comparison between SRTM C-band (5.7 GHz) and X-band (9.7 GHz) was used to assess the radar penetration into snow and ice by assuming the penetration depth of X-band to be negligible (CitationGardelle et al., 2012a, Citation2013). Studies have reported a penetration depth of ∼4 m for a radar beam at ∼10 GHz targeting an Antarctic ice sheet. Reports also indicate that the penetration depth varies with the water content of surface snow cover (CitationDavis and Poznyak, 1993; CitationSurdyk, 2002). Glaciers in the NBBCB are predominantly westerly influenced and have higher temperatures and more snow moisture than the Antarctic ice sheet (CitationWang et al., 2008). For these reasons, the penetration depth of the SRTM Xband beam into snow and ice was expected to be less than the value given in the literature for the Antarctic ice sheet (CitationGardelle et al., 2012a). The penetration depth correction is suitable under the assumption that the influence of slight penetration of the X-band is negligible compared to other confounding factors.
TABLE 5 Changes in glacier surface elevation and mass during the periods investigated. The periods investigated for Subregion III were 1980–1999, 1999–2005, and 1980–2005. For other subregions, the periods were 1968–1999, 1999–2007, and 1968–2007. MED indicates the mean elevation difference (m), and SMB indicates the specific mass balance (m w.e. a-1).
Another limitation of geodetic measurement is the ice-tomass conversion. In a study of the Svalbard Glacier, Nuth et al. (Citation2010) found no significant changes in the depths of firn-ice transition over the course of 8-10 years and depicted the distribution of glacier density using an exponential function of elevation. Nevertheless, it is not suitable to extrapolate this function to glaciers in other regions with such little knowledge of the density profile. To assess the sensitivity of the density conversion factor, the maximum differences between three density scenarios were calculated using the approach utilized by Gardelle et al. (Citation2013): (1) a constant density of 900 kg m-3 throughout. (2) 850 kg m-3 throughout, and (3) 900 kg m-3 for the accumulation area and 600 kg m-3 for the ablation area (CitationKääb et al., 2012). The accumulation area was distinguished using the ELA estimated by the median elevation of glaciers in each subregion derived from the TOPO maps (CitationPieczonka et al., 2013; CitationWei et al., 2014). The ELAs were 6129, 6191, 6038, and 6062 m in Subregions I, II, III, and IV, respectively. The largest difference in mass balance was 0.08 m w.e. a-1 in Subregion III during the period 1999-2005. and the other differences were approximately 0.02 m w.e. a-1. The small difference in mass balance estimation due to different ice-to-mass conversion factors may be negligible relative to other uncertainties (CitationGardelle et al., 2013).
FIGURE 4. Differences in glacier surface elevation during the periods investigated after relative adjustments, (a) SRTMTOPO (1968–1999); (b) ASTER-SRTM (1999–2007); (c) ASTER-TOPO (1968–2007).
Glaciers in the NBBCB experienced a more moderate mass wastage from 1968 to 2007 than glaciers in other regions during the corresponding period. Bolch et al. (Citation2011) found a mass deficit of 0.32 ± 0.08 m w.e. a-1 from 1970 to 2007 in the Himalayas of Nepal using Corona KH-4B and Cartosat-1 data. A more negative mass balance of -0.35 ± 0.15 m w.e. a-1 was observed from 1976 to 2009 in Tian Shan using KH-9 Hexagon and SPOTS data (CitationPieczonka et al., 2013). In situ measurements showed pronounced glacier mass deficits of 0.6 to 0.8 m w.e. a-1 occurred from 1957 to 2008 in the Russian Altai (CitationNarozhniy and Zemtsov. 2011). The current estimation of the change in glacier mass in the study region was consistent with previous conclusions of slight area reduction. Glaciers in the NBBCB shrunk in area by 7.1% (0.18% a-1) from the 1970s to 2009. This is a moderate area reduction for glaciers in the Tibetan Plateau interior area (CitationWei et al., 2014).
A decelerated mass loss of glaciers in the NBBCB during previous decades was detected in the present study. The subregions showed slightly negative mass budgets from 1999 to 2007. and smaller specific mass balances than from 1968 to 1999. Direct comparisons with other studies are difficult because the study areas and investigated time span were not identical. However, the current results were closely consistent with the overall trend that glaciers in the northwestern TP have experienced more balanced mass budgets in the past decade, especially in the Western Kunlun Mountains and Karakoram Mountains, relative to other parts of the TP. that is. the Central TP. Gangdise range. Nyainqentanglha range, and Himalayas (CitationBolch et al., 2012; CitationGardelle et al., 2012b; CitationJacob et al., 2012; CitationYao et al., 2012; CitationGardner et al., 2013; CitationNeckel et al., 2014). Based on the Ice. Cloud, and Land Elevation satellite (ICESat) data and SRTM DEM. a slight positive mass balance was detected from 2003 to 2009 in the Western Kunlun Mountains with the mass budget ranging from +0.03 ± 0.25 m w.e. a-1 (CitationNeckel et al., 2014) to +0.14 ± 0.16 m w.e. a-1 (CitationGardner et al., 2013. converted into mass budget). For the Karakoram Mountains, the mass budget was approximately balanced with a slightly negative mass balance of -0.10 ± 0.16 m w.e. a-1 from 2003 to 2009 based on ICESat and SRTM data (CitationGardner et al., 2013. converted into mass budget) and a mass gain of +0.11 ± 0.11 m w.e a-1 from 2000 to 2008 calculated using SRTM and SPOTS data (CitationGardelle et al., 2012b). It should be noted that surging or advanced glaciers identified from changes in glacier extent were widely observed in these regions (CitationShangguan et al., 2007; CitationFujita and Nuimura, 2011; CitationScherler et al., 2011; CitationYao et al., 2012; CitationWei et al., 2014). Nevertheless, no evidence of positive mass balance was found for any glaciers located in the subregions during the study periods (). However. 12 advanced glaciers were found among the investigated glaciers during the period from the 1970s to 2009 (CitationWei et al., 2014). These advanced glaciers were all smaller than 0.8 km2 and the most pronounced area increase was only 0.03 km2.
Conclusions
Systematic differences in the changes in glacier mass were apparent from region to region. And additional detection of signals indicative of changes in glacier mass may decrease the uncertainty in the estimation of the contribution of changes in glacier mass to increases in the magnitude of the sea level rise. The present study assessed the glacier mass budgets in the NBBCB using the historical topographic maps. SRTM. and ASTER stereo images. The study indicated that pre-processing of relative correction for the vertical and horizontal distortion between data sets derived from different sources is necessary and can be assessed by statistical analysis.
Overall the elevation of glacier surface in the study area decreased by 7.75 ± 1.10 m during 1968 and 2007. This resulted in a volume loss of 4.45 ± 0.63 km3 and an average mass wastage of 0.10 ± 0.02 km3 w.e. a-1 that corresponded to -0.18 ± 0.03 m w.e. a-1 for glaciers in the NBBCB. A decelerated deglaciation was also observed during the recent decade although there were regional differences. From 1999 to 2007. the mass wastage was almost half (-0.11 ± 0.12 m w.e. a-1) the loss that occurred during 1968 and 1999.
Acknowledgments
This work was supported by the National Natural Science Foundation of China (Grant 41190084). the Ministry of Science and Technology of China (MOST) (Grants 2013FY111400 and 2012BAC19B07), and the Key Research Program of Chinese Academy of Sciences (KZZD-EW-12-1). The data sets used in the study were a result of an immediate past project from the MOST (Grant 2006FY110200). Satellite images were from USGS and the U.S. National Aeronautics and Space Administration (NASA).
Related Research Data
References Cited
- Berthier, E. , Arnaud, Y. , Baratoux, D. , Vincent, C. , and Rémy, E. 2004: Recent rapid thinning of the “Mer de Glace” glacier derived from satellite optical images. Geophysical Research Letters , 31: L17401, doi http://dx.doi.org/10.1029/2004GL020706 .
- Berthier, E. , Vadon, H. , Baratoux, D. , Arnaud, Y. , Vincent, C. , Feigl, K. L. , Rémy, F. , and Legrésy, B. , 2005: Surface motion of mountain glaciers derived from satellite optical imagery. Remote Sensing of Environment , 95: 14–28.
- Berthier, E. , Arnaud, Y. , Vincent, C. , and Rémy, F. , 2006: Biases of SRTM in high-mountain areas: implications for the monitoring of glacier volume changes. Geophysical Research Letters , 33: L08502. doi http://dx.doi.org/10.1029/2006GL025862 .
- Berthier, E. , Schiefer, E. , Clarke, G. K. C. , Menounos, B. , and Rémy, F. , 2010: Contribution of Alaskan glaciers to sea-level rise derived from satellite imagery. Nature Geoscience , 3: 92–95.
- Bolch, T. , Buchroithner, M. , Pieczonka, T. , and Kunert, A. , 2008: Planimetrie and volumetric glacier changes in the Khumbu Himal, Nepal, since 1962 using Corona. Landsat TM and ASTER data. Journal of Glaciology , 54(187): 592–600.
- Bolch, T. , Pieczonka, T. , and Benn, D. I. , 2011: Multi-decadal mass loss of glaciers in the Everest area (Nepal Himalaya) derived from stereo imagery. The Cryosphere , 5: 349–358.
- Bolch, T. , Kulkarni, A. , Kääb, A. , Huggel, C. , Paul, F. , Cogley, J. G. , Frey, H. , Kargel, J. S. , Fujita, K. , Scheel, M. , Bajracharya, S. , and Stoffel, M. , 2012: The state and fate of Himalayan glaciers. Science , 336: 310–314.
- Carabajal, C. C. , and Harding, D. J. , 2005: ICESat validation of SRTM C-band digital elevation models. Geophysical Research Letters , 32: L22S01, http://dx.doi.org/10.1029/2005GL023957 .
- Dall, J. , and Madsen, S. N. , 2001: Topography and penetration of the Greenland Ice Sheet measured with airborne SAR interferometry. Geophysical Research Letters , 28(9): 1703–1706.
- Davis, C. H. , and Poznyak, V. I. , 1993: The depth of penetration in Antarctic firn at 10 GHz. IEEE Transactions on Geoscience and Remote Sensing , 31(5): 1107–1111.
- Fujisada, H. , 1998: ASTER Level-1 data processing algorithm. IEEE Transactions on Geoscience and Remote Sensing. 36: 1101–1112.
- Fujita, K. , and Nuimura, T. , 2011: Spatially heterogeneous wastage of Himalayan glacier. PNAS , 108(34): 14011–14014.
- Gardelle, J. , Bert hier, E. , and Arnaud, Y. , 2012a: Impact of resolution and radar penetration on glacier elevation changes computed from DEM differencing. Journal of Glaciology , 58(208): 419–422.
- Gardelle, J. , Bert hier, E. , and Arnaud, Y. , 2012b: Slight mass gain of Karakoram glaciers in the early twenty-first century. Nature Geoscience , 5: 322–325.
- Gardelle, J. , Bert hier, E. , Arnaud, Y. , and Kääb, A. , 2013: Region-wide glacier mass balances over the Pamir-Karakoram-Himalaya during 1999–2011. The Ctyosphere , 7: 1263–1286.
- Gardner, A. S. , Moholdt, G. , Cogley, J. G. , Wouters, B. , Arendt, A. A. , Wahr, J. , Berthier, E. , Hock, R. , Pfeffer, W. T. , Kaser, G. , Ligtenberg, S. R. M. , Bolch, T. , Sharp, M. J. , Hagen, J. O. , van den Broeke, M. R. , and Paul, F. , 2013: A reconciled estimate of glacier contributions to sea level rise: 2003 to 2009. Science , 340: 852–857.
- GB/T 12343.1-2008 . 2008: Compilation specifications for national fundamental scale maps—Part 1: Compilation specifications for 1 : 25 000/1 : 50 000/1 : 100 000 topographic maps. Beijing: General Administration of Quality Supervision. Inspection and Quarantine of the People's Republic of China and Standardization Administration of the People's Republic of China., 40 pp. ( in Chinese).
- Höhle, J. , and Höhle, M. , 2009: Accuracy assessment of digital elevation models by means of robust statistical methods. ISPRS Journal of Photogrammetry and Remote Sensing , 64(4): 398–406.
- Huss, M. , 2013: Density assumptions for converting geodetic glacier volume change to mass change. The Ctyosphere , 7: 877–887.
- IPCC. 2013: Summary for policymakers. In Stocker, T. F. , Qin, D. H. , Platinen G. K. , et al. (eds.). Climate Change 2013: The Physical Science Basis. Contribution of Working Group I to the Fifth Assessment Report of the Intergovernmental Panel on Climate Change. Cambridge. United Kingdom: Cambridge University Press.
- Jacob, T. , Wahr, J. , Pfeffer, W. T. , and Swenson, S. , 2012: Recent contributions of glaciers and ice caps to sea level rise. Nature , 482: 514–518.
- Jacobsen, K. , 2010: Comparison of ASTER GDEMs with SRTM height models. In Rainer, R. (ed.), EARSeL Symposium. Paris: Remote Sensing for Science, Education, and Natural and Cultural Heritage , 521–526.
- Kääb, A. , 2002: Monitoring high-mountain terrain deformation from repeated air- and spacebome optical data: examples using digital aerial imagery and ASTER data. Photogrammetry & Remote Sensing , 57(1): 39–52.
- Kääb, A. , 2005: Remote sensing of mountain glaciers and permafrost creep. Zürich: Geographisches Institut der Universitürich.
- Kääb, A. , 2008: Glacier volume changes using ASTER satellite stereo and ICESat GLAS laser altimetry. A test study on Edgeøya. Eastern Svalbard. IEEE Transactions on Geoscience and Remote Sensing , 46(10): 2823–2830.
- Kääb, A. , Berthier, E. , Nuth, C. , Gardelle, J. , and Arnaud, Y. , 2012: Contrasting patterns of early twenty-first-century glacier mass change in the Himalayas. Nature , 488: 495–498.
- Khalsa, S. J. S. , Dyurgerov, M. B. , Khromova, T. , Raup, B. H. , and Barry, R. G. , 2004: Space-based mapping of glacier changes using ASTER and GIS Tools. IEEE Transactions on Geoscience and Remote Sensing , 42(10): 2177–2183.
- Koblet, T. , Gärtner-Roer, I. , Zemp, M. , Jansson, P. , Thee, P. , Haeberli, W. , and Holmlund, P. , 2010: Reanalysis of multitemporal aerial images of Storglaciren, Sweden (1959–99)—Part 1: Determination of length, area, and volume changes. The Cryosphere , 4: 333–343.
- Li, J. , Liu, S.Y. , Shangguan, D. H. , and Zhang, Y. S. , 2010: Identification of ice elevation change of the Shuiguan River No. 4 glacier in the Qilian Mountains, China. Journal of Mountain Science , 7(4): 375–379.
- Maussion, F. , Scherer, D. , Mölg, T. , Collier, E. , Curio, J. , and Finkelnburg, R. , 2014: Precipitation seasonality and variability over the Tibetan Plateau as resolved by the High Asia Reanalysis. Journal of Climate , 27(5): 1910–1927.
- Miliaresis, G. C. , and Paraschou, C. V. E. , 2011: An evaluation of the accuracy of the ASTER GDEM and the role of stack number: a case study of Nisiros Island, Greece. Remote Sensing Letters , 2(2): 127–135.
- Miller, P. E. , Kunz, M. , Mills, J. P. , King, M. A. , James, T. D. , and Marsh, S. H. , 2009: Assessment of glacier volume change using ASTER-based surface matching of historical photography. IEEE Transactions on Geoscience and Remote Sensing , 47(7): 1971–1979.
- Narozhniy, Y. , and Zemtsov, V. , 2011: Current state of the Altai glaciers (Russia) and trends over the period of instrumental observations 1952–2008. Ambio , 40: 575–588.
- Neckel, N. , Kropáček, J. , Bolch. T ., and Hochschild, V. , 2014: Glacier mass changes on the Tibetan Plateau 2003–2009 derived from ICESat laser altimetry measurements. Environment Research Letters , 9: 014009. doi http://dx.doi.org/10.1088/1748-9326/9/1/014009 .
- Nuth, C. , and Kääb, A. , 2011: Co-registration and bias corrections of satellite elevation data sets for quantifying glacier thickness change. The Ctyosphere , 5: 271–290.
- Nuth, C. , Moholdt, G. , Kohler, J. , Hagen, J. O. , and Kääb, A. , 2010: Svalbard Glacier elevation changes and contribution to sea level rise. Journal of Geophysical Research , 115: F01008. http://dx.doi.org/10.1029/2008JF001223 .
- Papa, F. , Legrésy, B. , Mognard, N. M. , Josberger, E. G. , and Rémy, F. , 2002: Estimating terrestrial snow depth with the TOPEX-Poseidon altimeter and radiometer. IEEE Transactions on Geoscience and Remote Sensing , 40(10): 2162–2169.
- Pieczonka, T. , Bolch, T. , and Buchroithner, M. , 2010: Volumetric glacier changes in the Khumbu Himal since 1962 using space imagery. Grazer Schriften der Geographie und Raumforschung , 45: 295–302.
- Pieczonka, T. , Bolch, T. , Wei, J. F. , and Liu, S. Y, 2013: Heterogeneous mass loss of glaciers in the Aksu-Tarim Catchment (Central Tien Shan) revealed by 1976 KH-9 Hexagon and 2009 SPOT-5 stereo imagery. Remote Sensing of Environment , 130: 233–244.
- Racoviteanu, A. E. , Manley, W. F. , Arnaud, Y. , and Willimas, M. W. , 2007: Evaluating digital elevation models for glaciologic applications: an example from Nevado Coropuna, Peruvian Andes. Global and Planetary Change , 59: 110–125.
- Rodriguez, E. , Morris, C. S. , and Belz, J. E. , 2006: A global assessment of the SRTM performance. Photogrammetric Engineering & Remote Sensing , 72(3): 249–260.
- San, B. T. , and Suzen, M. L. , 2005: Digital elevation model (DEM) generation and accuracy assessment from ASTER stereo data. International Journal of Remote Sensing , 26(22): 5013–5027.
- Scherler, D. , Bookhagen, B. , and Strecker, M. R. , 2011: Spatially variable response of Himalayan glaciers to climate change affected by debris cover. Nature Geoscience , 4: 156–159.
- Shangguan, D. H. , Liu, S. Y. , Ding, Y. J. , Li, J. , Zhang, Y. , Ding, L. F. , Wang, X. , Xie, C. W. , and Li, G. , 2007: Glacier changes in the west Kunlun Shan from 1970 to 2001 derived from Landsat TM/ ETM+ and Chinese glacier inventory data. Annals of Glaciology , 46(1): 204–208.
- Shangguan, D. H. , Liu, S. Y. , Ding, Y. J. , Zhang, Y. , Du, E. J. , and Wu, Z. , 2008: Thinning and retreat of Xiao Dongkemadi glacier, Tibetan Plateau, since 1993. Journal of Glaciology , 54(188): 949–951.
- Shangguan, D. H. , Liu, S. Y. , Ding, Y. J. , Ding, L. F. , Xu, J. L. , and Li, J. , 2009: Glacier changes during the last forty years in the Tarim Interior River Basin, Northwest China. Progress in Natural Science , 19: 727–732.
- Shangguan, D. H. , Liu, S. Y. , Ding, Y. J. , Zhang, Y. , Li, J. , Li, X. Y. , and Wu, Z. , 2010: Changes in the elevation and extent of two glaciers along the Yanglonghe River, Qilian Shan, China. Annals of Glaciology , 56(196): 309–317.
- Shi, Y. F. , Liu, S. Y. , Ye, B. S. , Liu, C. H. , and Wang, Z. T. , 2008: Concise glacier inventory of China. Shanghai: Shanghai Popular Science Press.
- Shugar, D. H. , Rabus, B. T. , and Clague, J. J. , 2010: Elevation changes (1949–1995) of Black Rapids Glacier. Alaska, derived from a multibaseline InSAR DEM and historical maps. Journal of Glaciology. 56(198): 625–634.
- Sorg, A. , Bolch, T. , Stoffel, M. , Solomina, O. , and Beniston, M. , 2012: Climate change impacts on glaciers and runoff in Tien Shan (Central Asia). Nature Climate Change , 2: 725–731.
- Surazakov, A. B. , and Aizen, V. B. , 2006: Estimating volume change of mountain glaciers using SRTM and map-based topographic data. IEEE Transactions on Geoscience and Remote Sensing , 44(10): 2991–2995.
- Surazakov, A. B. , Aizen, V. B. , Aizen, E. M. , and Nikitin, S. A. , 2007: Glacier changes in the Siberian Altai Mountains. Ob river basin. (1952–2006) estimated with high resolution imagery. Environment Research Letters , 2: 045017. http://dx.doi.org/10.1088/1748-9326/2/4/045017 .
- Surdyk, S. , 2002: Using microwave brightness temperature to detect short-term surface air temperature changes in Antarctica: an analytical approach. Remote Sensing of Environment , 80(2): 256–271.
- Toutin, T. , 2008: ASTER OEMs for geomatic and geoscientific applications: a review. International Journal of Remote Sensing , 29(7): 1855–1875.
- Trisakti, B. , Carolita, I. , and Pradana, F. A. , 2009: Digital elevation model from PRISM-ALOS and ASTER stereoscopic data. International Journal of Remote Sensing and Earth Sciences , 6: 29–38.
- van Zyl, J. J. , 2001: The Shuttle Radar Topography Mission (SRTM): a breakthrough in remote sensing of topography. Acta Astronautica , 48(5–12): 559–565.
- Wang, J. S. , Zhang, X. Z. , Zhao, Y. P. , Shen, Z. X. , Shi, P. L. , and Yu, C. Q. , 2008: Spatiotemporal pattern of climate changes in northern Tibet's Qiangtang plateau. Resource Science , 12: 1852–1859 ( in Chinese with English abstract).
- Wang, S. M. , Doufchen, K. Z. , Wang, X. C. , and Jiang, J. H. , 1998: China Lakes Record. Beijing: Science Press ( in Chinese).
- Wei, J. F. , Liu, S. Y. , Guo, W. Q. , Yao, X. J. , Xu, J. L. , Bao, W. J. , and Jiang, Z. L. , 2014: Surface-area changes of glaciers in the Tibetan Plateau interior area since the 1970s using recent Landsat images and historical maps. Annals of Glaciology , 55(66): 213–222.
- Xu, J. L. , Liu, S. Y. , Zhang, S. Q. , Guo, W. Q. , and Wang, J. , 2013: Recent changes in glacial area and volume on Tuanjiefeng Peak Region of Qilian Mountains, China. PloS One , 8(8): e70574, http://dx.doi.org/10.1371/journal.pone.0070574 .
- Yao, T. D. , Thompson, L. , Yang, W. , Yu, W. S. , Gao, Y. , Guo, X. J. , Yang, X. X. , Duan, K. Q. , Zhao, H. B. , Xu, B. Q. , Pu, J. C. , Lu, A. X. , Xiang, Y. , Kattel, D. B. , and Joswiak, D. , 2012: Different glacier status with atmospheric circulations in Tibetan Plateau and surroundings. Nature Climate Change , 2: 663–667.
- Zhang, Y. , Fujita, K. , Liu, S. Y. , Liu, Q. , and Wang, X. , 2010: Multidecadal ice-velocity and elevation changes of a monsoonal maritime glacier: Hailuogou glacier, China. Journal of Glaciology , 56(195): 65–74.
- Zhang, Y. , Hirabayashi, Y. , and Liu, S. Y. , 2012a: Catchment-scale reconstruction of glacier mass balance using observations and global climate data: case study of the Hailuogou catchment, south-eastern Tibetan Plateau. Journal of Hydrology , 444–445: 146–160.
- Zhang, Y. S. , Liu, S. Y. , Shangguan, D. H. , Li, J. , and Zhao, J. D. , 2012b: Thinning and shrinkage of Laohugou No. 12 Glacier in the western Qilian Mountains. China, from 1957 to 2007. Journal of Mountain Science , 9(3): 343–350.
- Zemp, M. , Jansson, P. , Holmlund, P. , Gärtner-Roer, I. , Kohlet, T. , Thee, P. , and Haeberli, W. , 2010: Reanalysis of multi-temporal aerial images of Storglaciären, Sweden (1959–99)—Part 2: Comparison of glaciological and volumetric mass balances. The Ciyosphere , 4: 345–357.