
Remember Current Protocols in Molecular Biology? Those red binder-encased manuals, as common in biology labs as coffee cups and whiteboards, detail everything from nucleic acid extraction and basic cell culture to DNA microarrays and metabolomics.
Current Protocols is divided into chapters called “units.” In Unit 4.9, the instructions for the Northern blot—one of the first methods for studying gene expression—can be found. The RNA equivalent of a DNA Southern blot, a Northern blot uses labeled probes to detect the expression of a particular sequence in gel-fractionated RNA. The recommended amount of RNA per lane is 0.5 to 10 µg—the equivalent of 50,000 to 1 million cells.
Northern blots produce a population profile, often interpreted as a transcriptional description of an “average” cell. But in reality, says Daniel Larson, head of the Systems Biology of Gene Expression Section at the National Cancer Institute, “There is no average cell. Every cell is different.”
Where one cell may have 100 copies of a given RNA transcript, its immediate neighbor may have only 1 or 2, even in theoretically homogeneous populations such as cultured yeast or mammalian cells—a fact that often is overlooked in population-based analyses. The problem is further compounded in tissues, tumors, and other clearly heterogeneous samples.
It's not just steady-state RNA abundances that differ; the kinetics of gene expression itself also vary from gene to gene and cell to cell. Gauging such variability requires examining one cell at a time and reconsidering some assumptions about gene expression—a considerable technical and computational challenge for today's researchers.
Fishing for transcripts
Single-cell transcription studies fall largely into two categories: imaging and sequencing.
The oldest imaging-based method is a variation of fluorescence in situ hybridization (FISH), a fixed-cell technique that uses fluorescently labeled oligonucleotide probes to detect complementary sequences, in either DNA or RNA, at the single-cell level. FISH hails from the 1980s, but its use at the single-transcript level only dates back to 1998, when Robert Singer of Albert Einstein College of Medicine and his colleagues used sets of 5 oligos, each at least 50 nucleotides long and studded with 5 fluorophores apiece, to resolve individual β-actin transcripts in rat kidney cells via epifluorescence microscopy.
“It was, I think, the first demonstration of single-molecule detection in a cell,” Singer says.
(Courtesy of NIH Photography)
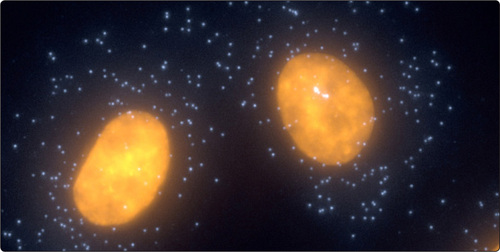
Single-molecule FISH works by effectively reducing each transcript to a single diffraction-limited volume in the cell: the smallest resolvable fluorescent point. By then counting those spots and tracking their appearance over time, Singer's team and others have slowly chipped away at the question of how genes are regulated. Their results imply a level of randomness in gene expression that few researchers, if any, could have imagined.
The traditional view of gene regulation is that transcription regulatory complexes assemble on gene regulatory regions, either activating or repressing RNA polymerase activity. That understanding is codified in the pretty diagrams with looping arrows so often found in transcriptional studies, all of which imply an orderly progression of transcriptional events. It's a foundational tenet of molecular methods such as footprinting, which are predicated on the idea that these complexes are stable.
But FISH tells a different story. “Many of these events that occur are what we've come to realize as ‘stochastic’—that is, they're random. When a gene gets transcribed by a polymerase is subject to the laws of diffusion,” explains Singer.
It turns out that transcription is not a smooth, continuous process; instead, it often occurs in bursts separated by extended periods of inactivity, meaning that apparent differences in transcript abundance from cell to cell might simply be due to when the researcher happens to look.
In 2008, Singer's team used FISH to explore the transcriptional properties of “housekeeping genes,” workaday genes that are always on and whose abundance, theoretically, should never change. Housekeeping genes are routinely used as controls in gene expression studies. Singer's team measured the abundance of transcripts from three essential genes, MDN1, KAP104, and DOA1, from yeast that were believed to harbor exactly one copy of each RNA per cell. The average number was actually between 3 and 6 transcripts per cell, with the absolute number varying from 1 to 15 copies. A small fraction of cells—8% in the case of DOA1—contained no copies of the transcript at all.
“So you say, what the heck is going on here? Here you have a gene that's absolutely required for the cell to survive and some cells have none of them, and some cells are just loaded,” Singer says. But that difference in abundance can lead to tremendous differences in a cell's protein output, enabling a considerable level of robustness.
Take the genes in yeast that mitigate copper toxicity, for example. Although yeast are generally unlikely to encounter toxic levels of the metal, if small numbers of cells in a population carry these stress-response genes, at least a small fraction of a population can survive a toxic insult. “The cell has evolved a way to keep a lot of its baggage, a lot of its DNA, under wraps,” Singer says.
Extending FISH
Such variability could also underlie the variability in disease phenotypes seen in certain genetic disorders, says Arjun Raj, an assistant professor of Bioengineering at the University of Pennsylvania.
As a graduate student in Sanjay Tyagi 's lab at the Public Health Research Institute at the University of Medicine and Dentistry of New Jersey, Raj modified Singer's FISH method. Instead of using a small number of multiply labeled oligos, he performed his RNA-FISH experiments with as many as 52 distinct, singly labeled oligos. He published the updated procedure in 2008. Two years later, as a postdoc with Alexander van Oudenaarden at MIT, Raj applied the method to C. elegans, demonstrating that the stochastic nature of transcription can explain the “incomplete penetrance” of mutant genes' that is, why different individuals with the same mutation display different phenotypes. In effect, Raj explains, it's as if for some individuals, the cell rolled the dice and came up snake-eyes.
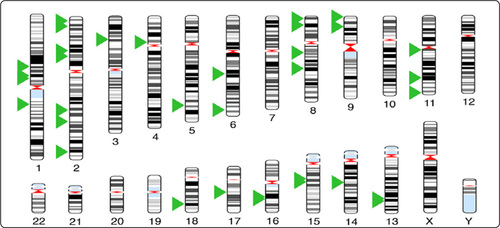
More recently, Raj modified FISH yet again to yield intron chromosomal expression FISH (iceFISH), a method combining the single-cell resolution of RNA FISH with the spatial information inherent in microscopy. The goal was to determine if chromosome structure somehow influences gene expression. By simultaneously lighting up each of 20 genes on human chromosome 19 in fibroblasts and HeLa cells, Raj and his graduate student Marshall Levesque were able to count how often each gene was on or off in each cell. Importantly, they could also see the spatial distribution of each chromosome and trace the chromosomal locations of each gene. As a result, they were able to ask whether chromosomal translocations influence gene expression patterns by directly comparing a translocated chromosome with its normal partner.
(Image courtesy of Olivia Padovan-Merhar, Arjun Raj Lab)
“What we found is that for the 13;19 [translocation], those genes on the translocated portion of chromosome 19 were much more frequently transcribed than the same gene on the normal copy of chromosome 19,” Raj explains.
Long Cai, Assistant Professor of Chemistry at the California Institute of Technology, has also extended the original FISH methodology through multiplexing. In 2012, Cai showed that the technique worked with 32 genes per cell, and theoretically, he says, “high-hundred” multiplexing is possible. “The overarching goal … is to turn single cells into microarrays,” Cai said in a 2012 BioTechniques news story (Citation1). To do that, he is combining superresolution microscopy and fluorescent barcoding.
Typically, the smallest point visible using FISH is a diffraction-limited spot, about 300–400 nm in diameter. While that's far larger than a single RNA molecule, researchers could potentially zoom in further to see more detail. “If you assume a cell is something like 10 microns cubed, and if your resolution is 10 nanometers cubed, then effectively you have something like a billion pixels in one cell,” Cai says. In theory, this is more than enough to spatially resolve the million or so mRNAs present in any single cell.
(Image courtesy of the University of Pennsylvania)

Working with his graduate student, Eric Lubeck, Cai combined 7 fluorescent colors into a 3-color barcode to study 32 yeast genes controlled by the transcription factor Crz1 in each of 62 cells, using STORM superresolution microscopy. The results again underscore the random nature of gene expression. “Even though these genes are controlled by a single transcription factor, they're not turned on at the same time.”
Looking at live cells
Even though FISH has proven a popular technique for single-molecule analyses, it has a significant drawback: it only works in dead, fixed cells. “What's missing in FISH is the time dimension,” explains Singer.
To study transcriptional kinetics, Singer's lab developed a second imaging approach, albeit one that requires some significant genetic manipulation. The gene of interest is tagged on either the 3′ or 5′ end with multiple copies of a stem-loop sequence carrying the binding site for a viral capsid protein called MS2 and then introduced into cells. To make the nascent transcripts light up, the cells are further modified to express a fusion of MS2 and a fluorescent protein. As the transcript is produced, the labeled protein binds to its cognate hairpins, generating a fluorescent signal that can be counted and tracked over time.
Using this approach Singer and his then-postdoc David Grünwald (now an assistant professor at the University of Massachusetts Medical School in Worcester) showed, among other things, that mRNA movement in the nucleus occurs by diffusion rather than as an active process and that export through nuclear pores takes less than two-tenths of a second. As a postdoc in Singer's lab, Larson used the technique to show that transcription initiation is also largely random, and again, driven by diffusion. “This is precisely what people mean when they talk about noise in gene expression,” explains Larson.
Image from Zong at al, Science, 338:1622-26, 2012
Unlike chemical systems, gene expression involves just handfuls of molecules, meaning that—at the level of transcription—each individual molecule counts. Thus, variables like travel time from point A to point B become significant. “In these limits, you're talking about the probability of an event happening,” Larson says. “It becomes very non-deterministic. And synonymous with non-deterministic is stochastic, essentially random.”
Earlier in 2013 Singer, with then-graduate student Sami Hocine, added a second capsid protein/stem-loop pair called PP7 to the MS2 technique. Using two hairpin and capsid protein sets, Hocine and Singer showed that the expression of 2 alleles of the same MDN1 gene varies significantly, correlating by just 15%.
The technique can also be used to label a single transcript at either end with different colors—a trick that Singer says can be used to measure the translation kinetics of mRNAs by watching the appearance and disappearance of the two colors as the ribosome passes through each hairpin region. The conventional wisdom, he says, is that RNAs are passively translated, but, “I've become leery of our biases.”
Indeed, the deeper they look, the more researchers find that, in the world of transcription, nothing is as it seems. For instance, another bit of conventional wisdom in transcriptional biolog y is that the cell can rapidly remove transcripts as needed. How, though, is that possible in this new stochastic model? In 2011 Singer, Larson, and Singer's then-graduate student Tatjana Trcek, used FISH to identify one possible answer.
Certain cell cycle-regulated transcripts get co-transcriptionally saddled with a protein complex called Dbf2p, which can assemble a complex that will rapidly destroy the transcripts at a precise moment during the cell cycle. “It's sort of like a bomb that can be set to go off at a certain time,” Singer explains, describing Dbf2p-mediated transcript degradation as “a very elegant process, because it makes a random event deterministic.”
Single-cell RNA-Seq
Elegant as imaging-based studies are, the power of modern DNA sequencing technology beckons. Take Harvard University chemist X. Sunney Xie, for instance.
Xie has been studying single-molecule biochemistry for years, mostly using fluorescent strategies to watch as proteins are translated one by one. In 2010, his team used both FISH and live cell techniques to compare the transcriptional and protein output of 1,018 individual E. coli strains, validating the first approach for investigating bacterial translation at the single-molecule level.
Still, Xie's team has now gravitated toward sequencing-based approaches. “With sequencing, it's just much easier to see the entire transcriptome,” he explains.
Several such approaches have been described, RNA-Seq variants such as SMART-Seq, CEL-Seq, Quartz-Seq, and STRT-Seq. But none, Xie says, can really yet sample the single-cell transcriptome in its entirety, first, because cDNA synthesis is not 100% efficient, and second, because “the transcriptome has a huge dynamic range,” spanning five or more orders of magnitude.
Last December Xie's team, led by Chenghang Zong and Sijia Lu, described a new genome amplification strategy they call MALBAC, which combines linear and exponential amplification steps to better sample the genome of single cells for sequencing. Using that method, Zong and Lu sequenced the entire genome of a single human cell, even detecting SNPs and copy-number variations. Now Xie's team is working to apply the approach, which already allows them to sample up to about 80% of the cell's mRNA, to the whole transcriptome.
By all accounts, the data arising from these and other single-cell and single-molecule studies are redefining the models researchers have long used when thinking of transcription. But that's not to say everything the scientific community thought it knew was wrong. Rather its assumptions were, perhaps, overly simplistic.
“The same biochemical laws still apply,” says Larson. “You can still talk about first-order RNA decay, you can still talk about Michaelis-Menten kinetics. But all of those basic mechanisms have to be recast in a form that takes into account the discrete nature of macromolecules.”
Meanwhile, it might be time for another update to Current Protocols.
Reference
- Weaver, J. Sept. 12, 2012. Super-resolution barcoding: Turning single cells into microarrays. BioTechniques.

