
Abstract
Phagocytosis—the engulfment of cells and foreign bodies—is an important cellular process in innate immunity, development, and disease. Quantification of various stages of phagocytosis, especially in a rapid screening fashion, is an invaluable tool for elucidating protein function during this process. However, current methods for assessing phagocytosis are largely limited to flow cytometry and manual image-based assays, providing limited information. Here, we present an image-based, semi-automated phagocytosis assay to rapidly quantitate three distinct stages during the early engulfment of opsonized beads. Captured images are analyzed using the image-processing software ImageJ and quantified using a macro. Modifications to this method allowed quantification of phagocytosis only in fluorescently labeled transfected cells. Additionally, the time course of bead internalization could be measured using this approach. The assay could discriminate perturbations to stages of phagocytosis induced by known pharmacological inhibitors of filamentous actin and phosphoinositol-3-kinase. Our methodology offers the ability to automatically categorize large amounts of image data into the three early stages of phagocytosis within minutes, clearly demonstrating its potential value in investigating aberrant phagocytosis when manipulating proteins of interest in drug screens and disease.
Engulfed
Phagocytosis occurs when dedicated phagocytic cells, such as macrophages, recognize a target object or pathogen and respond by recruiting organelles to internalize it. Since the process is essential in development and innate immune response, demand for experimental procedures to accurately assay phagocytosis in a high-throughput fashion is increasing. While current approaches take advantage of flow cytometry or image analysis to detect particles residing either inside or outside the cel l, no assay has yet been developed to detect the intermediate stages of phagocytosis. To address this need, Yeo et al. at the University of Queensland (Brisbane, Australia) developed an image-based, semi-automated assay to quantify engulfment of opsonized beads in three stages of phagocytosis: (i) beads attached to the cell surface, (ii) beads partially engulfed by phagocytic cups, and (iii) fully internalized beads. To do this, the authors applied latex beads bound with human IgG to cells. After a specified time, the cells were fixed and human IgG detected using fluorescent antibodies. Microscopy was used to determine the total number of beads in a visual field and then identify the stage of engulfment for each bead by assessing the percentage of visible fluorescent label on that bead. Automated bead counts and identification of phagocytic stages proved highly reproducible, matching well with manual counts across all three stages of phagocytosis. A time course study demonstrated that changes in internalization were accurately assessed, which also benefited studies using drugs to impede early stages of phagocytosis. Taken together, these experiments demonstrate that this new assay is sensitive, reproducible, and unbiased. And by using automated image analysis, this approach also becomes amenable to high-throughput screening, with the potential to facilitate large-scale studies on the effects of drugs, small molecules, or RNAi on phagocytosis.
See “High-throughput quantification of early stages of phagocytosis” on page 115.
We describe a fast and reliable method for detecting three early stages of phagocytosis and quantifying the percentages of phagocytic events in each stage. Our approach may be used to measure rates of aberrant phagocytosis in drug screens or experimental models of various diseases.
Phagocytosis is the process by which cells engulf large particles, dead cells, or microbes, usually to remove this material from the body (Citation1). In both innate immunity and embryonic development, phagocytosis is an essential function of phagocytic cells such as macrophages (Citation2). Typically, the early stages of phagocytosis involve recognition of target objects or pathogens, recruitment of intracellular organelles to provide membrane for particle engulfment, followed by internalization and maturation of the phagosomes into acidic, destructive compartments upon fusion with lysosomes (Citation3,Citation4). Phagocytosis can also be exploited by certain pathogens, which use this process to gain entry into cells for colonization after the pathogens have subverted the destructive steps of the process (Citation5). While phagolysosomes have been well characterized, recent attention has focused primarily on the early stages of phagocytosis where both membrane perturbations and cytoskeletal rearrangements mediate particle recognition and engulfment but also generate micro-environments for receptor signaling and cell activation (Citation1).
In our own research, studies requiring identification and functional characterization of the cellular machinery and pathogen-derived effectors governing early-stages of phagocytosis have highlighted the need for rapid and quantitative assays. Here we describe new methods for image-based analysis of Fcγ receptor mediated uptake of opsonized beads in macrophages. We show the automation of fluorescence image analysis and the generation of reproducible quantitative data, effectively measuring the three early stages of phagocytosis, namely, (i) beads attached to the cell surface, (ii) partial engulfment of beads by phagocytic cups and, (iii) full internalization of beads. To date, many established assays are able to detect differences in total phagocytosed particles using flow cytometry-based or image-based quantitative methods focusing on particles that are either totally engulfed by the cell or outside the cell surface (Citation6–11). Our methodology includes capture of critical information on beads that are partially phagocytosed or at an in-between stage. Phagocytosis can be abrogated at this in-between stage by disrupting molecular trafficking machinery with pharmacological inhibitors; thus analysis of this stage of phagocytosis is informative (Citation12–14).
Materials and methods
Cell culture and drug treatments
RAW264.7 murine macrophage cells were maintained in RPMI 1640 medium (Lonza, Tullamarine, Australia) supplemented with 10% fetal calf serum (Thermo Trace, Noble Park, Australia) and 1% L-glutamine (Invitrogen, Mulgrave,, Australia) in humidified 5% CO2/95% air atmosphere at 37°C. Primary bone marrow derived macrophages (BMM) were collected, grown, and differentiated as previously described (Citation15). Cells were typically plated on coverslips in 24 well plates and activated with 100 ng/mL lipopolysaccharide (LPS) from Salmonella enterica serotype Minnesota Re 595 (LPS; Sigma-Aldrich, St. Louis, MO). LY294002 (LY; Merck, Kilsyth, Australia) and cytochalasin D (CytD) were used as known inhibitors of phagocytosis to block membrane recruitment and actin polymerization, respectively. LY, a broad spectrum phosphoinositol-3-kinase (PI3K) inhibitor, was added at a final concentration of 100 ng/ mL for 30 min to block phagocytosis at an in-between stage. CytD (Sigma Chemical Co., Sydney, Australia) was added to a final concentration of 20 µg/mL for 30 min to depolymerize filamentous actin (F-actin) and broadly disrupt phagocytosis.
IgG-opsonized phagocytic particles and phagocytosis
Latex beads (3 µm diameter) and sheep red blood cells (sRBCs) were obtained as 10% suspensions from Sigma-Aldrich and coated with human IgG (Invitrogen) by passive adsorption using a method adapted from Scott et al. (Citation16). In brief, the latex bead stock or sRBC suspensions were washed with PBS and then incubated in 2 µg/mL of human IgG or anti-sRBC for 1 h at 37°C, while mixing. The suspensions were then washed and resuspended in PBS. For phagocytosis, 1 µL of this suspension was added to macrophages on coverslips in 1 mL of cold complete RPMI medium, spun onto cells at 1000 rpm for 2 min at 4°C and then incubated at 37°C for 5–20 min. The cells were fixed, immunolabeled, and imaged as described below.
Immunofluorescence and imaging
Cells were fixed in 4% paraformaldehyde for 30 min and then permeabilized, if required, with 0.1% Triton X-100/PBS for 5 min. Washing, blocking, and antibody incubation steps were done using blocking buffer (0.5% BSA/PBS). Human IgG on beads was detected using Cy3 goat anti-human antibody. SRBCs were detected using Alexa488-anti rabbit IgG. Cells were labeled with Alexa350/488-phalloidin to outline cells and show actin-enrichment at sites of phagocytosis. Coverslips were mounted in Prolong Gold (Invitrogen) for imaging.
An Olympus BX-51 epifluorescence microscope equipped with Olympus 60× (numerical aperture 1.35) and 100× (numerical aperture 1.4) oil immersion lenses and an Olympus DP70 camera were used to capture images for phagocytosis assays. Images were captured with Olympus DPcontroller version 2.1 capture software at an image size of 2040 × 1536 pixels. For high resolution analysis, images were captured using Deltavision deconvolution microscopy, where fluorophore excitation was achieved with a 120W Xenon arc lamp and brightfield images were acquired with a 100W LED lamp. Emission spectra were viewed using an Olympus IX71 inverted microscope equipped with Olympus Plan-Apochromat 60× (numerical aperture 1.35) oil objective. Images were captured using a Roper Coolsnap HQ2 Monochrome Camera.
Image analysis and quantification
In all cases, images were analyzed and cropped using Adobe Photoshop 9.0 or ImageJ 1.4 (http://rsbweb.nih.gov/ij/). All automated image analysis steps were implemented using the ImageJ macro language and are provided in the Supplementary Material. Images from 4 fields of view were taken and at least 200 beads were analyzed for each biological replicate.
Statistical analysis
The data from three independent experiments were standardized as percentages before being calculated and presented as mean ± SEM. Unpaired, two-tailed t-tests were used to compare groups of data. Statistics were calculated using Graphpad Prism version 4.0 (Graphpad Software, San Diego, CA).
Results and discussion
Stages of phagocytosis
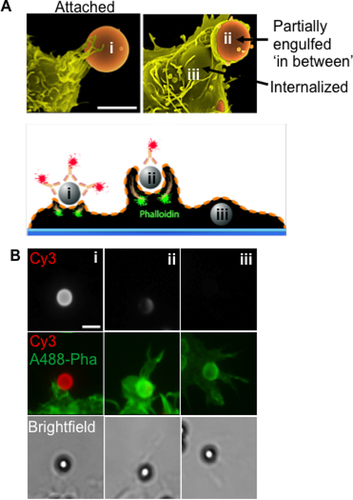
Three successive, early stages of phagocytosis were assayed using opsonized beads and exogenously-applied antibody to detect beads before and after internalization. Bead attachment, an in-between stage of phagocytic cup formation, and full engulfment were the three stages measured. Each stage is depicted by both scanning electron microscopy and fluorescence in (i-iii). Initial attachment of opsonized beads on the cell surface usually involves engagement with cell surface receptors and the beginning of phagocytic engulfment, often in the form of filopodia, as depicted by scanning electron microscopy (). In the fluorescence assay, attached beads are fully accessible to exogenous Cy3-labeled anti-Ig. At the in-between stage, beads have been partially encircled or engulfed by phagocytic cups, which have not yet closed. These beads are also still accessible to exogenous Cy3-labeled antibody. Finally, fully internalized beads are inaccessible to Cy3 antibodies, but they can still be detected by brightfield imaging ( and ). Each of these stages involves a complex series of membrane perturbations, endosomal fusion events, and cytoskeletal rearrangements, including the distinctive enrichment of F-actin at the base of phagocytic cups at the in-between stage, as shown by Alexa488- phalloidin staining. The combination of fluorescence and brightfield imaging allows detection of beads at all three early stages of phagocytosis (). Phagocytosis of IgG-opsonized beads was also carried out in bone marrow-derived macrophages (BMDM) and showed morphological and phagocytic properties similar to RAW264.7 macrophage cells (Supplementary Figure S1).
(A) Top panel—Differential membrane remodeling throughout the three phagocytic stages: i) attached, ii) in between, and iii) internalized, when viewed with electron microscopy. Bottom panel—A diagram depicting the procedure for differential labeling of exposed bead surfaces using Cy3-conjugated anti-human IgG prior to permeabilization with 0.1% Triton-X100. Filamentous actin (F-actin) is stained with Alexa488-conjugated phalloidin. (B) Images of fixed cells depicting the progression of phagocytosis captured using epifluorescence microscopy under 40× magnification. Scale bars = 3 µm.
Quantitative image-based analysis of phagocytosis using ImageJ
For quantitative analysis of phagocytosis, the open source, Java-based software package ImageJ was used. The software was set up to identify the total number of beads in a field of view and then analyze the fluorescent state of the bead to characterize its phagocytic state (i-iii).
Brightfield image analysis
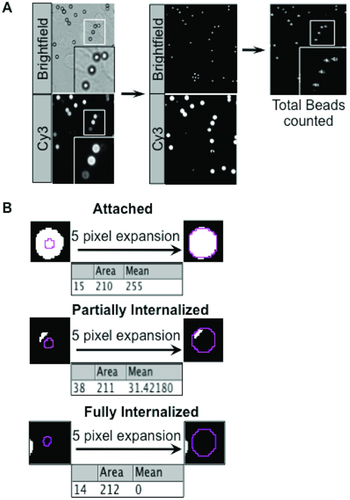
To quantitate the total number of beads in a field of view, a brightfield image was obtained along with images from the fluorescence channels used in each experiment (, left panel). Thresholding, also known as binary contrast enhancement, was then used to convert the brightfield and fluorescence images into their respective binary representations (, middle panel). Thresholding is used to detect particle bodies, count particles, or measure area. A grayscale image is converted to binary (black and white) by defining a grayscale cutoff point wherein values below the cutoff become black and those above become white. The script involves user-defined thresholding by using the slider to adjust the threshold. The red areas will become black in the binary image. The script was set up with a specific set of parameters to detect approximately spherical objects within a given bead size range in the thresholded brightfield image and to discard objects outside this range. The position of each bead in the brightfield image was recorded as a region-of-interest (ROI), which could then be automatically selected by the macro in the corresponding fluorescence intensity image for analysis (, right panel). To allow ImageJ to specifically identify beads instead of other particles, the brightfield image had to be optimized. As such, a dedicated focal plane was chosen to represent beads with absolute white middles and dark rings, which is especially important for differentiating beads adjacent to one another. This is compared with a poorly-focused brightfield image where cellular artifacts were also detected along with the beads (Supplementary Figure S2A).
(A) The brightfield (total beads) and Cy3 (exposed beads) images (left panel) were converted to binary images via thresholding, (middle panel). Total beads were counted in the brightfield binary image (right panel), analyzing particles with circularity index from 0.80–1.00 and pixel number from 30–50. (B) Brightfield bead ROI was imprinted onto the Cy3 binary image. The ROI was expanded five pixels, which resulted in a more accurate diameter of the bead. The software then calculated the percentage of white (exposed) pixels within the ROI and assigned them to one of the three categories: attached (top panel), partially internalized (middle panel), or fully internalized (bottom panel), with a 5% error margin to account for irregularities in pixilation of the beads that are almost (>95%) attached or (<5%) phagocytosed (bottom panel). Note that a typical 3 µm bead corresponds to 15 pixels in diameter. Hence a typical bead image area of 2040 × 1536 pixels corresponds to an area of 378 × 285 µm.
Exposed bead fluorescence analysis
The Cy3 anti-human IgG bead fluorescence image was also user-thresholded to create a binary image revealing only exposed bead surfaces (). Capturing parameters of exposed bead fluorescence images also had to be optimized since experimenting with various exposure and planar parameters showed under and over sampling of fluorescence information, which could lead to data misrepresentation (Supplementary Figure S2B).
Characterization of bead fluorescence in the three phagocytic stages
Brightfield and fluorescence images of bead regions showed that ROIs were uniformly smaller than the true bead diameter (, small purple ring). This was compensated for by expanding the ROIs by 5 pixels (1 µm) to accurately select the bead region. To characterize bead fluorescence, the percentage of total (expanded) ROI area that was surface exposed was calculated. Since the fluorescence had been converted to binary, the total number of pixels that were set to white (255 in a binary 8-bit image) were divided by the total number of pixels in the ROI to obtain the percentage of each bead with exposed surface. Data representation was further optimized to account for a margin of error where exposed surfaces attaining ≥95%, 6%–94%, ≤5% are categorized as attached, in-between, and phagocytosed beads (). This 5% margin is required due to the fact that fluorescent imaging can be noisy; hence, the segmentation of bead regions may not be perfect. Ultimately, by comparing the brightfield binary image with the fluorescent binary image, the program was able to sort each bead into the three distinct phagocytic indices: attached, in-between, and phagocytosed. In this script, thresholding parameters are user-defined, whi le the rest of the commands are automated. The assay was also used to quantitate phagocytosis of IgG-opsonized sRBCs (Ig-sRBCs) to determine its efficiency in identifying and categorizing irregular-shaped, non-refractile phagocytic particles. Our assay was able to determine the phagocytic stages of Ig-sRBCs in macrophages but with less accuracy than beads due to their non-refractile properties for brightfield imaging. We were able to circumvent this by using autofluorescence from sRBCs and manual segmentation to segregate individual sRBCs for analysis (Supplementary Figure S3).
Analysis of transfected cells using a modified macro
For some experiments, we wished to transfect and transiently express fluorescently tagged proteins for simultaneous analysis with phagocytosis. This required incorporating an additional fluorescence label into the macro to depict only the transfected cells in the culture dish. shows two GFP-transfected cells with four phagocytosed beads in total and the corresponding Cy3 and brightfield channels. The fluorescence image of GFP-transfected cells was thresholded and used as a mask to effectively delete all other data from the image analysis. Before using this mask, a 14-pixel expansion was included on the transfected cell image after particle analysis was used to create a binary image. This expansion was roughly the size of one bead so attached beads at the periphery of cells would be included (). Beads that did not fall entirely within the masked area (red boxes) were excluded due to the stringency of the circularity parameters for bead particle analysis. The program then effectively recognized and counted four beads in total (blue circles) and then analyzed their phagocytosis states using bead fluorescence ( and ). Thus, integration of the transfected cell image yielded a powerful tool to assess phagocytosis confined to transfected cells in a heterogeneous population.
(A) Images from GFP-transfected cells after phagocytosing IgG-opsonized beads. (B)The binary image of GFP-transfected cells was first processed to create regions of interest (ROIs). These ROIs were expanded 14 pixels (1 bead size) to account for beads at the cell periphery. (C) The adjusted ROIs were then used to mask the raw brightfield and exposed bead (Cy3) images, resulting in exclusion of non-circular beads at the periphery (red box). (D) Phagocytic assay progression.

Assay validation in time course and inhibition of phagocytosis experiments
To validate the accuracy of automated counts, manual counts were also conducted on the same images of macrophages ingesting IgG-beads at 10 min, as shown in . The automated counts were tightly reproducible and quantitatively similar when compared with the manual counts across the three stages of phagocytosis, showing that the assay accurately quantitates bead populations.
RAW264.7 macrophages activated with 100ng/mL LPS and IgG-opsonized beads were centrifuged onto the cells at 4°C and subsequently incubated at 37°C to synchronize phagocytosis. Phagocytosis was stopped by fixing cells with 4% PFA at desired time points. Exposed beads were labeled with Cy3 goat anti-human IgG and F-actin was labeled with Alexa488-phalloidin. (A) Automated and manual counts of beads in the three stages of phagocytosis. (B) Representative fluorescence images of cells after 2 and 15 min of phagocytosis. Corresponding sections of epifluorescence images at the 2nd and 15th minute are shown with examples of exposed beads (black arrowhead) and phagocytosed beads (white arrowhead). (C) Analysis of time course at 2, 5, 10, and 15 min of phagocytosis. Images from 4 separate fields of view were taken and at least 200 beads were analyzed per experiment. Data from three independent experiments were standardized as percentages before calculating the mean ± SEM. Scale bar = 10 µm.
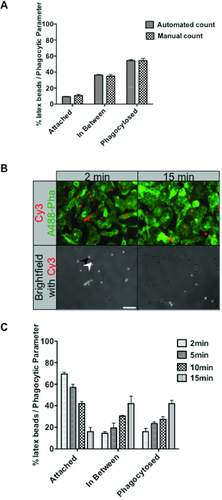
The assay was then further tested using a time course of phagocytosis to demonstrate the changes in internalization over time. We collected images of bead uptake and internalization over time and applied the pipeline. Representative images corresponding to the 2nd and 15th minute of phagocytosis are shown in , in which exposed bead surfaces were labeled with Cy3-anti human antibody and cells were labeled with Alexa488-phalloidin. The brightfield image was overlayed with the Cy3 image to depict differences in attached (black arrowhead) and phagocytosed (white arrowhead) beads over time. Representative results from the time course of phagocytosis are shown in . Two minutes after synchronized phagocytosis was initiated, most of the beads (70%) were found attached to the cell surface; however, some were found partially phagocytosed (in-between) (12%) and some were already fully engulfed (18%). The latter result was expected since active, constitutive probing of the extracellular environment by macrophages can result in very efficient and rapid capture of prey (Citation17). By 15 min, these proportions were gradually reversed with only 20% of beads attached at the cell surface, while 40% were in-between, and 40% were fully phagocytosed. Therefore, most of the beads undergoing phagocytosis progressed in a relatively synchronous fashion over time through the three stages. This progression was also visualized and recorded in the images. As the cells were observed to ingest varying amounts of beads, the engulfment states of at least 200 beads were analyzed using this assay. This sample bead population size was also used for other phagocytosis analyses in this study.
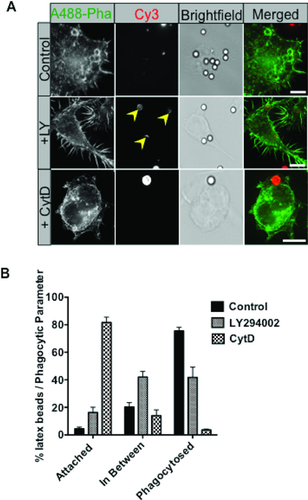
To test whether the assay could detect changes in the early stages of phagocytosis, we analyzed cells treated with drugs known to impede or block this process. LY blocks the catalytic site of PI3K, an important signaling molecule involved in focal membrane exocytosis during phagocytosis. PI3K inhibition is reported to arrest phagocytosis in the partial engulfment or in-between stage (Citation18). CytD binds to the growing end of actin subunits, preventing the formation of actin-dependent cellular protrusions including filopodial and pseudopodial extensions for phagocytosis (Citation19). Cells were either untreated or treated with LY or CytD. Phagocytosis of beads at a single time point was then measured. Representative cell images for LY and CytD treatment are shown in . Attached beads with distinctly abnormal cel lular protrusions were observed in CytD-treated cells. No distinct morphological change was observed in LY-treated cells or control cells. In each case, the beads could be clearly seen. LY and CytD did not completely abrogate phagocytosis, suggesting that PI3K and F-actin were not completely inhibited by these treatments. Control cells phagocytosed and fully internalized ∼80% of beads (out of 200) over 20 min with smaller proportions of attached and in-between beads (). LY-treated cells had significantly less internalized beads (40% out of 200) with corresponding increases in attached and in-between beads (). The increased percentage of in-between beads (40%) corresponds to a previous report showing that PI3K inactivation abrogated phagocytosis at this stage (Citation13,Citation20). Testing of additional LY concentrations might have revealed more pronounced effects on phagocytosis. CytD-treated cells exhibited the most profound perturbation of phagocytosis with less than 5% of the beads phagocytosed and 80% remaining in an attached stage after drug treatment, which was expected due to loss of F-actin (Citation19). These results serve to demonstrate the utility of the assay in detecting quantitative changes in three stages of phagocytosis.
(A) RAW264.7 cells were treated for 30 min with LPS (100 ng/mL) and CytD (20 µM) or LY294002 (100 µM) before addition of IgG opsonised beads. Cells were left to phagocytose beads for 20 min in the presence of the inhibitor before being fixed in 4% PFA to halt phagocytosis. Cells were probed as previously described and analyzed using the extended macro for transfected cells. (B) Quantitation of beads during the three stages of phagocytosis using the automated script. CytD dramatically halted phagocytosis at the attached stage, while LY abrogated phagocytosis in the in-between stage (yellow arrowheads) in treated cells. Images from 4 separate fields of view were taken, and at least 200 beads were analyzed per experiment. The data from three independent experiments was standardized as percentages before calculation of the mean ± SEM. Scale bar = 10 µM.
Our approach produces high-throughput, sensitive, unbiased, reproducible, and robust image analysis, allowing direct quantitative assessment of various phagocytic stages. The simultaneous imaging of fluorescently exposed beads and brightfield channels form the basis of the assay. Opsonized latex beads are a valuable tool for triggering Fγg receptor-mediated phagocytosis via a typically close-fitting phagocytic cup formed by a zipper-like mechanism (Citation21). The tightness of these cups enabled probing and discrimination of exposed beads (versus inaccessible fully engulfed beads) with an exogenous antibody for microscopic detection of different stages of phagocytosis. Overall, this development ensured that the assay is of sufficient sensitivity and reproducibility. Automation enables use for high-content screening of drugs, small molecules, natural products, or RNAi libraries. Adapting this assay for use on transfected cells was particularly important given the relatively low transfection efficiency of cells like macrophages. While the assay uses opsonized latex beads, it could also be adapted for measuring phagocytosis of other particles, cells, or pathogens.
Our assay is more rapid and informative than other phagocytosis assays reported in the literature (Citation22–Citation23). It is able to detect several sequential steps in phagocytosis among the whole bead population. Using the assay, we showed disruption of F-actin and inactivation of PI3K abrogated phagocytosis as expected. Of note, LY treatment caused significant arrest of beads at the in-between stage of phagocytosis, demonstrating a requirement for PI3K (Citation13,Citation20). It is worth mentioning that the degree of automation allows the quantification of much larger numbers of beads than with previous methods. This ensures that subtle effects, such as a 10% increase or decrease in attached beads, for instance, are detectable with statistical significance and minimal user intervention.
Author contributions
J.C.Y. contributed to the experiments, figures, development of the quantification macro, and wrote the manuscript. A.A.W. contributed to the conception and development of quantification macro. J.L.S. contributed to the conception of the macro, wrote, and edited the manuscript. N.A.H. contributed to writing the quantification macro, wrote, and edited the manuscript.
Competing interests
The authors declare no competing interests.
Supplementary Material For: High-throughput quantification of early stages of phagocytosis
Download MS Word (725.5 KB)Acknowledgments
The authors wish to thank Darren Brown for performing electron microscopy (EM) and Tatiana Khromykh and Juliana Venturato for technical assistance. EM was performed in the Centre for Microscopy and Microanalysis at the University of Queensland. Fluorescence imaging was performed in the Australian Cancer Research Foundation funded Cancer Biology Imaging Facility at IMB. This work was funded by National Health and Medical Research Council of Australia (NHMRC) grants (to N.A.H and J.L.S) and by an NHMRC program grant and fellowship ( JLS).
Supplementary data
To view the supplementary data that accompany this paper please visit the journal website at: www.tandfonline.com/doi/suppl/10.2144/000114075
Additional information
Funding
References
- Flannagan, R.S., V.Jaumouille, and S.Grinstein. 2012. The Cell Biology of Phagocytosis.Annu Rev Pathol.7:61–98.
- Dale, D.C., L.Boxer, and W.C.Liles. 2008. The phagocytes: neutrophils and monocytes.Blood112:935–945.
- Swanson, J.A. and A.D.Hoppe. 2004. The coordination of signaling during Fc receptor-mediated phagocytosis.J. Leukoc. Biol.76:1093–1103.
- Taylor, P.R., L.Martinez-Pomares, M.Stacey, H.H.Lin, G.D.Brown, and S.Gordon. 2005. Macrophage receptors and immune recognition.Annu Rev Immunol.23:901–944.
- Underhill, D.M. and A.Ozinsky. 2002. Phagocytosis of microbes: Complexity in action.Annu. Rev. Immunol.20:825–852.
- Beletskii, A., M.Cooper, P.Sriraman, C.Chiriac, L.H.Zhao, S.Abbot, and L.M.Yu. 2005. High-throughput phagocytosis assay utilizing a pH-sensitive fluorescent dye.Biotechniques39:894–897.
- Miksa, M., H.Kornura, R.Wu, K.G.Shah, and P.Wang. 2009. A novel method to determine the engulfment of apoptotic cells by macrophages using pHrodo succinimidylester.J. Immunol. Methods342:71–77.
- Steinberg, B.E., C.C.Scott, and S.Grinstein. 2007. High-throughput assays of phagocytosis, phagosome maturation, and bacterial invasion.Am. J. Physiol. Cell Physiol.292:C945–C952.
- Neaga, A., J.Lefor, K.E.Lich, S.F.Liparoto, and Y.Q.Xiao. 2013. Development and validation of a flow cytometric method to evaluate phagocytosis of pHrodo (TM) BioParticles (R) by granulocytes in multiple species.J. Immunol. Methods390:9–17.
- Van Amersfoort, E.S. and J.A.G.Vanstrijp. 1994. Evaluation of a flow cytometric fluorescence quenching assay pf phagocytosis of sensitized sheep erythrocytes by polymorphonuclear leukocytes.Cytometry17:294–301.
- Wan, C.P., C.S.Park, and B.H.S.Lau. 1993. A rapid and simple microfluorometric phagocytosis assay.J. Immunol. Methods162:1–7.
- Diakonova, M., G.Bokoch, and J.A.Swanson. 2002. Dynamics of cytoskeletal proteins during Fc gamma receptor-mediated phagocytosis in macrophages.Mol. Biol. Cell13:402–411.
- Araki, N., T.Hatae, A.Furukawa, and J.A.Swanson. 2003. Phosphoinositide-3-kinase-independent contractile activities associated with Fc gamma-receptor-mediated phagocytosis and macropinocytosis in macrophages.J. Cell Sci.116:247–257.
- Lee, W.L., D.Mason, A.D.Schreiber, and S.Grinstein. 2007. Quantitative analysis of membrane remodeling at phagocytic cup.Mol. Biol. Cell18:2883–2892.
- Hume, D.A.G.S. 1983. Optimal conditions for proliferation of bone marrow-derived mouse macrophages in culture: the roles of CSF-1, serum, Ca2+, and adherence.J. Cell. Physiol.117:189–194.
- Scott, C.C., W.Dobson, R.J.Botelho, N.Coady-Osberg, P.Chavrier, D.A.Knecht, C.Heath, P.Stahl, and S.Grinstein. 2005. Phosphatidyl inositol-4,5-bisphosphate hydrolysis directs actin remodeling during phagocytosis.J. Cell Biol.169:139–149.
- Mattila, P.K. and P.Lappalainen. 2008. Filopodia: molecular architecture and cellular functions.Nat. Rev. Mol. Cell Biol.9:446–454.
- Beemiller, P., A.D.Hoppe, and J.A.Swanson. 2006. A phosphatidylinositol-3-kinase-dependent signal transition regulates ARF1 and ARF6 during Fc gamma receptor-mediated phagocytosis.PLoS Biol.4:e162.
- Tse, S.M.L., W.Furuya, E.Gold, A.D.Schreiber, K.Sandvig, R.D.Inman, and S.Grinstein. 2003. Differential role of actin, clathrin, and dynamin in Fc gamma receptor-mediated endocytosis and phagocytosis.J. Biol. Chem.278:3331–3338.
- Cox, D., C.C.Tseng, G.Bjekic, and S.Greenberg. 1999. A requirement for phosphatidylinositol 3-kinase in pseudopod extension.J. Biol. Chem.274:1240–1247.
- Swanson, J.A. 2008. Shaping cups into phagosomes and macropinosomes.Nat. Rev. Mol. Cell Biol.9:639–649.
- DeLoid, G.M., T.H.Sulahian, A.Imrich, and L.Kobzik. 2009. Heterogeneity in Macrophage Phagocytosis of Staphylococcus aureus Strains: High-Throughput Scanning Cytometry-Based Analysis.PLoS ONE4:e6209.
- Steinberg, B.E. and S.Grinstein. 2009. Analysis of Macrophage Phagocytosis: Quantitative Assays of Phagosome Formation and Maturation Using High-Throughput Fluorescence Microscopy, p. 45–56. In N.E.Reiner (Ed.), Macrophages and Dendritic Cells, Humana Press.

