
Abstract
Targeted DNA enrichment through hybridization capture (EHC) is rapidly replacing PCR as the method of choice for enrichment prior to genomic resequencing. This is especially true in the case of ancient DNA (aDNA) from long-dead organisms, where targets tend to be highly fragmented and outnumbered by contaminant DNA. However, the behavior of EHC using aDNA has been quite variable, making success difficult to predict and preventing efficient sample equilibration during multiplexed sequencing runs. Here, we evaluate whether quantitative PCR (qPCR) measurements of aDNA samples correlate with on-target read counts before and after EHC. Our data indicate that not only do simple target qPCRs correlate strongly with high-throughput sequencing (HTS) data but that certain sample characteristics, such as overall target abundance as well as experimental parameters (e.g., bait concentration and secondary structure propensity), consistently influenced enrichment of our diverse set of aDNA samples. Taken together, our results should help guide experimental design, screening strategies, and multiplexed sample equilibration, increasing yield and reducing the expected and actual cost of aDNA EHC high-throughput sequencing projects in the future.
We quantified a 49 bp locus of the mammoth 12S rRNA mitochondrial gene on 11 different mammoth DNA extracts indexed libraries, and whole mitochondrial DNA-enriched libraries. The same libraries were high-throughput sequenced, and reads were aligned to the target. qPCR values, bait concentration, and secondary structure propensity were compared against on-target read counts, enrichment rates, and mitogenome coverage patterns.
Recently, high-throughput sequencing (HTS) has enabled reconstruction of large genomic regions from heavily degraded paleontological and archival specimens (Citation1–3). These results promise to expand ancient DNA (aDNA)-based genomic projects to greater breadth and rigor. However, aDNA extracts are typically dominated by DNA from microorganisms, with genomic regions of interest often representing only a tiny fraction of the total genomic content of the target organism. Therefore, even with the significant amount of raw sequence data generated by HTS, obtaining multi-fold coverage of a target genomic region can be prohibitively expensive. As such, most aDNA extracts require targeted enrichment prior to HTS, especially when the goal is to pool and sequence multiple individuals to sufficient coverage depth.
Target aDNAs are typically well under the practical length for resequencing with overlapping PCR amplicons. Thus, enrichment through hybridization capture (EHC) coupled with HTS is rapidly replacing targeted PCR as the method of choice for reconstructing several and/ or long aDNA genomic targets (Citation4–18). However, the reported on-target read proportions obtained using EHC with aDNA vary considerably (). These results hinder efficient sample equilibration in multiplexed sequencing runs, and are a primary barrier to EHC’s routine use by many groups working with aDNA.
Table 1. Summary of aDNA enrichment statistics
EHC variation is unsurprising since the process is driven by mostly unevaluated interactions between experimental parameters, target choice, and DNA sample characteristics (Citation19, Citation20). Of these, the absolute and/or relative abundance of targets are likely particularly relevant, especially given the highly complex non-target DNA content typical of aDNA extracts. Fortunately, quantitative PCR (qPCR) can cheaply, albeit indirectly, estimate target abundance and has been used extensively to evaluate aDNA sample quality (Citation2, Citation21–25). Recently, Wales and colleagues (Citation25) demonstrated that qPCR measures of target and non-target molecules in aDNA samples correspond ordinally to HTS data from non-enriched sequencing libraries. What remains unanswered, however, is whether qPCR-based metrics from aDNA samples correspond to reads-on-target after enrichment. Here we examine this question experimentally to determine if qPCR-based predictions could make EHC-HTS projects more predictable and efficient. In addition, we discuss experimental parameters that impact enrichment results and may thereby inform future experimental design strategies.
Materials and methods
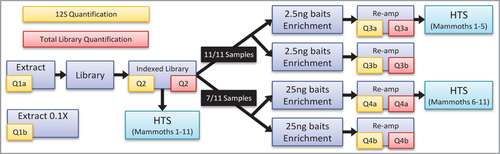
As depicted in , we selected 11 DNA extracts from various Pleistocene-age Mammuthus specimens of a wide range of depositional contexts and preservation levels, as well as 2 associated non-mammoth controls. We then used a highly sensitive proboscidean-specific qPCR assay to measure the amplifiable molecules at a 49 bp locus (including primers) of the mammoth mitochondrial 12S rRNA gene using 2 template concentrations (1× and 0.1×). After converting the extracts to Illumina sequencing libraries (Citation26, Citation27), we quantified the 12S locus again, along with the total number of adapted molecules using a global qPCR assay (Citation26). We then enriched the libraries in duplicate using an in-solution EHC technique with two different concentrations of biotinylated RNA baits matching several known mammoth mitochondrial genome haplogroups (Citation28–30). Following enrichment, we again quantified both the 12S locus and total adapted molecules. Finally, we sequenced the non-enriched and enriched libraries on an Illumina HiSeq platform and measured on-target read proportions, coverage patterns, and enrichment rates, evaluating how these corresponded to qPCR metrics, bait concentration, and bait properties.
12S quantification refers to qPCR of a 49 bp section of the 12S mitochondrial gene. Total quantification refers to qPCR of entire libraries using primers matching the sequencing adapters. Samples were extracted and quantified both undiluted and at 0.1× concentration, then converted to indexed sequencing libraries and sequenced. Portions of those indexed libraries were subsequently subjected to replicate enrichments, with 2.5 ng and/or 25 ng of baits, and were sequenced after re-amplification.
Quantitative PCR assays
Quantitative PCRs were performed using a CFX96 real-time PCR instrument (BioRad, Hercules, CA). For the mammoth 49 bp 12S assay, we paired 2 previously-published (Citation31) primers (B1_Forward: CCCTAAACTTTGATAGCTACC, A1_Reverse: GTAGTTCTCTGGCGGATAGC). The target has GC content of 42.9%, compared with the mammoth mitogenome average of roughly 38%. As a standard, we used a previously generated amplicon encompassing the mammoth 12S rRNA gene quantified with a GeneQuant Pro UV spectrophotometer (Amersham, now GE Healthcare; Freiburg, Germany). An optimal primer annealing temperature (54°C) was determined by a temperature gradient qPCR experiment. The assay exhibits near single-copy sensitivity and is accurate to at least 10 copies. Test amplifications from human, xenarthran, coprolite, soil, and chicken DNAgenerated sporadic and off-size products. For library target and total quantifications, the standards were amplicons of the target that were converted to a non-indexed Illumina sequencing library (Citation26). Total library quantifications used primers matching the universal internal adapter sequence (IS7_short_amp. P5: ACACTCTTTCCCTACACGAC; IS8_short_amp.P7: GTGACTGGAGTTCAGACGTGT) (Citation26).
Each 12S qPCR reaction used 3 µL (extracts) or 1 µL (libraries) template and followed the recipes and thermal programs in Supplementary Table S6, with plate reads after annealing steps. In 12S assays, dissociation ramps from at least 65°C to at least 89°C were used to confirm the positive product (74.5 ± 0.5°C). At least three different concentrations of standard were included in duplicate in each assay and values were estimated using the automatic threshold calculation by the CFX Manager software version 3.0. Extracts were screened using both 1× and 0.1× versions diluted in EBT (QIAGEN Buffer EB brought to 0.05% Tween-20) (QIAGEN, Dusseldorf, Germany). For indexed libraries, 12S quantifications used 0.1× versions and total quantifications used either 0.001× or 0.0001× versions. Duplicate quantifications were averaged, with values projected to be in the undiluted sample reported even when less than 10 copies (Supplementary Table S1).
DNA extraction and library preparation
We extracted DNA from roughly 100 mg subsamples of 11 Mammuthus specimens and a Pleistocene Mylodon darwinii specimen (Supplementary Table S1) in aDNA-dedicated facilities using an organic protocol with filter concentration (Citation2). Libraries used 50 µL of each extract diluted to various concentrations; the 0.1× concentration was used when inhibition was estimated to be >90% (Supplementary Table 1). Library preparation followed Meyer and Kircher (Citation26), with each purification step performed with the MinElute PCR purification kit (QIAGEN) eluting in 20 µL EBT.
Libraries were diluted to between 1× and 0.1× concentration in EBT based on available volume (Supplementary Table S1) and then index-amplified with unique P5 and P7 indexing primers (Citation27) using 5 µL of template according to the recipe and thermal program in Supplementary Table S6. Reactions were removed from the cycler and placed on ice upon reaching similar amplification points (11–23 cycles), estimated to be near PCR plateau. After review of the trace data without baseline correction, it was apparent that Mammoth 7 reached plateau by cycle 9. Reactions were purified with the MinElute kit to 20 µL EBT.
Bait design
For bait references, we used the light strand of several published Mammuthus mitochondrial genomes (Citation30, Citation32) from four different haplogroups (NCBI accession no.s EU153453, JF912199, EU153456, EU153447) and a complete mitogenome sequence from Mammut americanum (American Mastodon, NCBI accession no. EF632344) (Citation33). We also included a 734 bp region of the cytochrome b, tRNA-Pro, tRNA-Thr from a fifth mammoth haplogroup (NCBI accession no. FJ015496) (Citation29). The VNTRs of the control regions were removed prior to bait design. We also selected a number of nuclear loci, which we extracted from the Loxodonta africana genome sequence (NCBI RefSeq Assembly ID: GCF_000001905.1) and a number of entries in the NCBI nucleotide database and did not repeat-mask (Supplementary Datafile 1). With these, we designed 100 bp baits tiled every 6 bp along the targets and then collapsed identical baits, providing 8530 unique mitochondrial and 7996 unique nuclear baits, which MYcroarray manufactured in 2 separate batches as part of a MYbaits enrichment kit. Bait dimer and hairpin scores were calculated with the Primer3 plug-in (Citation34) in Geneious Pro version 5.6.5 (Biomatters, Auckland, New Zealand) using a salt concentration setting matching capture conditions (0.82 M).
Enrichment and re-amplification
We used the MYbaits targeted enrichment kit protocol with some adjustments:
Enrichments used 3.4 µL of indexed library (an estimated 1.5–18.8 ng of template based on total qPCR quantification) rather than the recommended 100–500 ng, as we have successfully enriched concentrations this low previously (data not shown).
Given the short length of the genomic regions targeted, we scaled down the input bait concentration from the typical 500 ng, which is appropriate for up to 2 Mb targets. All 13 libraries as well as 3.4 µL of EBT were enriched in replicate using 2.5 ng total input of each bait set, and then 9 libraries (Mammoths 4, 6–11 and associated blanks) and EBT were enriched in replicate using 25 ng.
We used blocking oligonucleotides matching both strands rather than one strand of double-indexed library (Citation26). These blocks were also used as bait diluents, maintaining 500 ng oligonucleotides per reaction.
The second 2.5 ng bait experiment and both 25 ng bait experiments were erroneously performed using 95% and 105% of the recommended amounts of Block 1 and Block 2, respectively.
Reactions hybridized for between 37 and 39 h at 45°C with 45°C wash steps, rather than 65°C. Previous experiments indicated this lower temperature would improve the capture of short, rare inserts typical to our samples (data not shown).
We used 20 µL of hydrophobic Dynabeads MyOne Streptavidin T1 beads (Invitrogen, Life Technologies, Carlsbad, CA) for enrichment cleanup rather than hydrophilic C1 beads. A previous version of the kit called for hydrophobic M280 beads.
Each enrichment elution was purified to 30 µL EBT with MinElute. An 8 µL aliquot was then amplified using primers that match the 5′ flanks of each index (IS5_reamp. P5: AATGATACGGCGACCACCGA; IS6_reamp.P7: CAAGCAGAAGACGGCATACGA) (Citation26) following the recipe and program in Supplementary Table S6. Reactions were put on ice and purified to 21 µL EBT with MinElute.
Sequencing, demultiplexing
Non-enriched and enriched libraries were sequenced on two separate lanes of a HiSeq 1000 Illumina flowcell. cBot cluster generation and sequencing employed the version 3 chemistry and a 2 × 101 bp dual 8 bp indexing protocol, using the alternative primer mixes from the TruSeq Dual Index Sequencing Primer Kit (paired-end). Raw data were processed with HCS version 1.5.15.1 and RTA version 1.13.48.0. File conversion and demultiplexing using each 7 bp reverse index (requiring a 100% match) were performed using CASAVA version 1.8.2.
Curation
Reads were trimmed of the 3′ universal adapter sequence (AGATCGGAAGAGC) using cutadapt version 1.2 (Citation35), requiring a 1 bp overlap (-O 1) and tolerating 16% sequence divergence (-e 0.16). Paired reads were then merged with FLASH version 1.0.3 (Citation36), requiring an 11 bp overlap (-m 11) and tolerating 15% overlap divergence (-x 0.15). These merged reads were then combined with the non-mergeable Read 1s to generate a final data set for downstream analysis. We used random 3 million read subsets from each library to analyze on-target raw and unique read proportions, while coverage patterns were analyzed using these and full read sets.
Alignment
Using Burrows-Wheeler Aligner (BWA) version 0.6.1-r104 (Citation37), we aligned reads 24 bp and longer to the light strand of a mammoth mitochondrial genome with the VNTR masked with 10 Ns (GenBank Accession No: JF912200.1, a haplogroup C/Clade I mammoth from Alaska). We used default aln parameters except disabled seeding (-l 9999) and allowed 2% of assemblies to be missed assuming a 2% error rate (-n 0.02). We also mapped reads to the nuclear targets (42,127 bp), but given the dominance of repeat-region reads in these alignments, we did not analyze this data further, though alignment rates to hard-masked nuclear targets are shown in Supplementary Table S5. Resulting SAM files were converted to BED with BEDOPS version 2.2.0 (Citation38), and using these we generated complexity curves by randomly sampling raw mapped reads in increments corresponding to 100,000 total library reads up to the available total reads per sample. Unique reads were identified by collapsing reads with unique 5′ and 3′ coordinates and direction. Fragment misincorporation plots, which exhibit typical aDNA deamination patterns, were generated with mapDamage version 2.0 (Citation39) (Supplementary Figures S1a–S1k).
Data availability
HTS data for this project can be found on the NCBI SRA at Study Accession #SRP026317.
Results and discussion
The qPCR results from each mammoth sample, as measured using (i) original DNA extracts, (ii) non-enriched sequencing libraries, and (iii) enriched sequencing libraries, are listed in and Supplementary Table S1 along with the HTS read counts and proportions of reads that map to the mitochondrial genome out of random 3 million read subsets. The nature of qPCR assays requires their values be carefully compared, since they estimate two different parameters. Our mammoth 12S assay measures locus frequency among all fragments ∼49 bp and greater, and therefore correlation of this result to on-target HTS reads will vary depending on the endogenous insert length distribution as well as any intra-target abundance biases. The total assay estimates copy numbers of a heterogeneous length distribution, so this accuracy is also dependent on the overall library length distribution and amplification biases.
Table 2. qPCR and HTS data
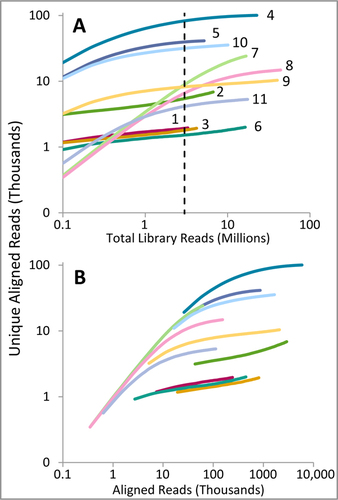
plots qPCR measures against mitogenome reads both before and after enrichment. All 12S qPCR quantifications show significant positive power correlations with raw reads on-target before and after enrichment, with undiluted extract and indexed library quantifications correlating most strongly both before (R2 = 0.69, P = 0.002 and R2 = 0.66, P = 0.003, respectively) and after enrichment (R2 = 0.70, P = 0.001 and R2 = 0.80, P < 0.001, respectively). Interestingly, the ratios between the target values and total qPCR values (referred to hereafter as 12S:Total) are weaker predictors of HTS read counts, likely due at least in part to the well-documented length bias inherent to the polymerase used for our qPCR assays (AmpliTaq Gold; Invitrogen) (Citation40).
Data are depicted for both raw (A) and unique (B) read counts analyzed at 3 million total reads per sample. Open circles correspond to data points from non-enriched libraries, closed circles to enriched libraries. All qPCR values are dilution-corrected. The 0.1× extract scaled markers represent the 12S qPCR values scaled by concentration used for indexing and indexing cycles [the result of the function (0.1× qPCR value) × (library concentration used for indexing) ÷ (1.3 ^ indexing cycles)].
![Figure 2. Relationships between 12S qPCR-based measures and on-target read counts.Data are depicted for both raw (A) and unique (B) read counts analyzed at 3 million total reads per sample. Open circles correspond to data points from non-enriched libraries, closed circles to enriched libraries. All qPCR values are dilution-corrected. The 0.1× extract scaled markers represent the 12S qPCR values scaled by concentration used for indexing and indexing cycles [the result of the function (0.1× qPCR value) × (library concentration used for indexing) ÷ (1.3 ^ indexing cycles)].](/cms/asset/c6f0776a-f2f1-47e4-afa2-63aa9fbf5424/ibtn_a_12359944_f0002.jpg)
This strong correspondence between the single-locus target qPCR measurements and mitogenome raw reads after enrichment is encouraging. However, raw on-target read proportions are often irrelevant in many sequencing projects, with the reliability of consensus calls more appropriately gauged by unique read coverage. Prior to enrichment, qPCR values correlate comparably in strength between unique and raw on-target reads, but this correlation is insignificant following enrichment (best correlation R2 = 0.36, P = 0.0527). This makes sense since the enriched libraries show a range of complexities (). Unsurprisingly, the number of indexing cycles correlates strongly with measures of post-enrichment complexity, such as overall duplication rate (positive power correlation R2 = 0.83, P = 0.0001) and relative increases in unique on-target reads between 100,000 and 3 million reads sequencing depth (negative power correlation R2 = 0.90, P < 0.0001). Indexing cycles also predict raw reads on-target after enrichment with comparable strength as undiluted extract qPCRs (R2 = 0.74, P < 0.0007). As such, scaling the original 0.1× extract target qPCR values by indexing cycles greatly improves their correlation with post-enrichment unique read count, especially when also scaled by the dilution factor of the library used in the indexing amplification reaction (, “0.1× extract scaled”).
Complexity curves in terms of total reads sequenced (A) and raw on-target reads sequenced (B), with mammoth numbers adjacent to each line. Curves were generated by randomly sampling raw mapped reads in increments corresponding to 100 thousand total library reads up to the available total reads per sample (3.3 to 44.1 million). Raw mapped reads with identical 5′ and 3′ end coordinates and strand origin (direction) were collapsed to determine unique counts. The dotted line in (A) marks 3 million total read depth, at which on-target read counts and enrichment rates were analyzed.
These observations demonstrate that simple qPCR metrics can indeed predict on-target read counts after enrichment, and therefore could form the basis of equilibration schemes for efficient sequencing of enriched aDNA libraries. However, the relationship between qPCR and reads-on-target is nonlinear, and for any given combination of samples, targets, enrichment techniques, and data analysis strategies, pilot screening of a subset of enriched samples would be beneficial for accurate equilibration.
In addition to qPCR read count correlations, we also examined variables that potentially influence enrichment rate—the ratio between on-target read proportions after and before enrichment ()—as well as correlations between bait properties and the intra-target variation in enrichment rate and pre- and post-enrichment coverage patterns (Supplementary Figure S2). Correlations between these properties and per-base mitogenome coverage are included in Supplementary Tables S3 and S4.
Table 3. Enrichment rates (proportion after enrichment:proportion before enrichment) in 12S: Total qPCR values and mitogenome-alignable HTS reads.
Whether measured by increases in the qPCR-derived 12S:Total or on-target HTS reads, enrichment rates correlate negatively with starting abundances, a relationship observed in other aDNA enrichment data sets (Citation4, Citation7). This suggests a pattern of diminishing returns wherein the degree to which samples could benefit from additional rounds of enrichment might decrease as the endogenous portion approaches a certain threshold. In addition to abundances, the number of indexing cycles (related to starting input DNA) is again a strong predictive variable, correlating negatively with unique enrichment rate (R2 = 0.84, P < 0.0001).
Bait concentration was influential as well. As measured by increases in the 12S:Total ratio, enrichment rates ranged from 22- to 2,217-fold (mean = 221) when enriched with 2.5 ng of baits, with the 2 lowest-copy libraries (Mammoths 7 and 11) failing to enrich in 1 and both replicates, respectively. With 25 ng of baits, enrichment rates improved 15- to 1374-fold over their 2.5 ng counterparts, with Mammoth 7 and 11 successfully enriching in both replicates. However, inter-replicate enrichment consistency did not improve significantly when bait concentration was increased (Student’s t-test on inter-replicate coefficients of variation P = 0.29).
Bait coverage, which we designed to be deeper (and more diverse) in mitogenomic regions known to be polymorphic in extinct proboscideans, may have also affected enrichment. For all mammoth samples, whether analyzed at 3 million reads or at total available depth, bait and read coverage depth almost universally increased in positive correlation with aligned read coverage after enrichment. Bait coverage also correlates positively with raw enrichment rates. While not as strong an association as seen in other enrichment studies (e.g., Reference (Citation41), this suggests that relatively minor bait coverage variation (mean coverage = 51×, standard deviation = 12.6×) impacts post-enrichment coverage.
The propensity for individual baits to form secondary structures also appeared to impact enrichment. As with bait coverage, correlations between coverage or enrichment rates and per-base average bait hairpin and dimer scores became universally stronger following enrichment (in this case, negatively). However, it is difficult to rule out inter-locus amplification bias as the origin of this pattern; only two samples (Mammoths 9 and 10) show low correlations between regional duplication rate and unique coverage depth, and for these samples unique enrichment rates do not correspond to bait properties. That amplification biases appear to dictate coverage patterns in this data set clearly encourages the use of amplification-minimal techniques (Citation15, Citation42, Citation43) with less biased DNA polymerases (Citation40, Citation44) or emulsion PCR (Citation45).
Both qPCR measures and experimental design features correlate with post-enrichment read counts, enrichment rates, and coverage metrics. More sophisticated qPCR strategies, such as multi-locus and/or techniques that simultaneously estimate the target insert length distribution (Citation22, Citation23, Citation46) might improve predictive power. Predicting unique target reads from qPCR metrics is a more complicated task, requiring complexity-based modification to be accurate. Therefore, normalizing complexity between samples as much as possible is obviously recommended, such as by equalizing starting library molarity prior to indexing as well as indexing amplification cycles. Since higher bait concentration and bait coverage corresponded to higher enrichment, maintaining even target coverage depth in bait sets and/or modifying bait sequences to reduce self-dimer/hairpin propensity might also improve enrichment consistency. However, it is unclear how these correspondences depend on hybridization and washing conditions, especially temperature and salt concentration, among other things. Given the demonstrated power of EHC for aDNA, such knowledge gaps encourage continued systematic evaluation of how enrichment is affected by experimental parameters and sample characteristics, beginning with variables that are cheaply assessed for large sample sets or easily controlled during experimental design.
Author contributions
All authors designed the experiments. JE executed the experiments, performed analyses, and prepared the manuscript. All authors edited the manuscript.
Competing interests
JMR has financial interest in MYcroarray, the company providing the enrichment kit for this study.
Additional file 1
Download Zip (3.2 MB)Acknowledgments
We thank the entire McMaster Ancient DNA Centre for guidance and discussion during the experiments and manuscript preparation. S. Horn, J. Krause, and S. Sawyer graciously provided accessory data to their published works referenced here. M. Clementz, D. Fisher, C.R. Harington, P. Matheus, and G. Zazula and their respective institutions provided mammoth samples. We also thank the McMaster Farncombe Family Digestive Health Research Institute, especially C.E. King, for performing the sequencing experiments and data pre-processing. Comments from two anonymous reviewers greatly improved the manuscript. This research was funded by NSERC and CRC grants to HP and contributions from MYcroarray.
Supplementary data
To view the supplementary data that accompany this paper please visit the journal website at: www.tandfonline.com/doi/suppl/10.2144/000114114
Additional information
Funding
References
- Meyer, M., M.Kircher, M.T.Gansauge, H.Li, F.Racimo, S.Mallick, J.G.Schraiber, F.Jay, et al.. 2012. A high-coverage genome sequence from an archaic Denisovan individual. Science338:222–226.
- Poinar, H.N., C.Schwarz, J.Qi, B.Shapiro, R.D.Macphee, B.Buigues, A.Tikhonov, D.H.Huson, et al.. 2006. Metagenomics to paleogenomics: large-scale sequencing of mammoth DNA. Science311:392–394.
- Green, R.E., J.Krause, A.W.Briggs, T.Maricic, U.Stenzel, M.Kircher, N.Patterson, H.Li, et al.. 2010. A Draft Sequence of the Neandertal Genome. Science328:710–722.
- Avila-Arcos, M.C., E.Cappellini, J.A.Romero- Navarro, N.Wales, J.V.Moreno-Mayar, M.Rasmussen, S.L.Fordyce, R.Montiel, et al.. 2011. Application and comparison of large-scale solution-based DNA capture-enrichment methods on ancient DNA. Sci Rep.1:74.
- Bos, K.I., V.J.Schuenemann, G.B.Golding, H.A.Burbano, N.Waglechner, B.K.Coombes, J.B.McPhee, S.N.DeWitte, et al.. 2011. A draft genome of Yersinia pestis from victims of the Black Death. Nature478:506–510.
- Briggs, A.W., J.M.Good, R.E.Green, J.Krause, T.Maricic, U.Stenzel, C.Lalueza- Fox, P.Rudan, et al.. 2009. Targeted Retrieval and Analysis of Five Neandertal mtDNA Genomes. Science325:318–321.
- Burbano, H.A., E.Hodges, R.E.Green, A.W.Briggs, J.Krause, M.Meyer, J.M.Good, T.Maricic, et al.. 2010. Targeted investigation of the Neandertal genome by array-based sequence capture. Science328:723–725.
- Fu, Q., M.Meyer, X.Gao, U.Stenzel, H.A.Burbano, J.Kelso, and S.Paabo. 2013. DNA analysis of an early modern human from Tianyuan Cave, China. Proc. Natl. Acad. Sci. USA110:2223–2227.
- Horn, S. 2012. Case study: enrichment of ancient mitochondrial DNA by hybridization capture. Methods Mol. Biol.840:189–195.
- Krause, J., A.W.Briggs, M.Kircher, T.Maricic, N.Zwyns, A.Derevianko, and S.Paabo. 2010. A complete mtDNA genome of an early modern human from Kostenki, Russia. Current biology: CB20:231–236.
- Krause, J., Q.Fu, J.M.Good, B.Viola, M.V.Shunkov, A.P.Derevianko, and S.Paabo. 2010. The complete mitochondrial DNA genome of an unknown hominin from southern Siberia. Nature464:894–897.
- Mason, V.C., G.Li, K.M.Helgen, and W.J.Murphy. 2011. Efficient cross-species capture hybridization and next-generation sequencing of mitochondrial genomes from noninvasively sampled museum specimens. Genome Res.21:1695–1704.
- Reich, D., R.E.Green, M.Kircher, J.Krause, N.Patterson, E.Y.Durand, B.Viola, A.W.Briggs, et al.. 2010. Genetic history of an archaic hominin group from Denisova Cave in Siberia. Nature468:1053–1060.
- Schuenemann, V.J., K.Bos, S.DeWitte, S.Schmedes, J.Jamieson, A.Mittnik, S.Forrest, B.K.Coombes, et al.. 2011. Targeted enrichment of ancient pathogens yielding the pPCP1 plasmid of Yersinia pestis from victims of the Black Death. Proc. Natl. Acad. Sci. USA108:E746–E752.
- Sawyer, S., J.Krause, K.Guschanski, V.Savolainen, and S.Paabo. 2012. Temporal patterns of nucleotide misincorporations and DNA fragmentation in ancient DNA. PLoS ONE7:e34131.
- Bouwman, A.S., S.L.Kennedy, R.Muller, R.H.Stephens, M.Holst, A.C.Caffell, C.A.Roberts, and T.A.Brown. 2012. Genotype of a historic strain of Mycobacterium tuberculosis. Proc. Natl. Acad. Sci. USA109:18511–18516.
- Vilstrup, J.T., A.Seguin-Orlando, M.Stiller, A.Ginolhac, M.Raghavan, S.C.Nielsen, J.Weinstock, D.Froese, et al.. 2013. Mitochondrial phylogenomics of modern and ancient equids. PLoS ONE8:e55950.
- Fu, Q., A.Mittnik, P.L.Johnson, K.Bos, M.Lari, R.Bollongino, C.Sun, L.Giemsch, et al.. 2013. A revised timescale for human evolution based on ancient mitochondrial genomes. Current biology: CB23:553–559.
- Farrell, R.E., Jr. 2010. Chapter 13 - Practical Nucleic Acid Hybridization, p. 283–299. RNA Methodologies, 4th Edition. Academic Press, San Diego.
- Harrison, A., H.Binder, A.Buhot, C.J.Burden, E.Carlon, C.Gibas, L.J.Gamble, A.Halperin, et al.. 2013. Physico-chemical foundations underpinning microarray and next-generation sequencing experiments. Nucleic Acids Res.41:2779–2796.
- Allentoft, M.E., M.Collins, D.Harker, J.Haile, C.L.Oskam, M.L.Hale, P.F.Campos, J.A.Samaniego, et al.. 2012. The half-life of DNA in bone: measuring decay kinetics in 158 dated fossils. Proc. Biol. Sci.279:4724–4733.
- Deagle, B.E., J.P.Eveson, and S.N.Jarman. 2006. Quantification of damage in DNA recovered from highly degraded samples--a case study on DNA in faeces. Front. Zool.3:11.
- Schwarz, C., R.Debruyne, M.Kuch, E.McNally, H.Schwarcz, A.D.Aubrey, J.Bada, and H.Poinar. 2009. New insights from old bones: DNA preservation and degradation in permafrost preserved mammoth remains. Nucleic Acids Res.37:3215–3229.
- King, C., R.Debruyne, M.Kuch, C.Schwarz, and H.Poinar. 2009. A quantitative approach to detect and overcome PCR inhibition in ancient DNA extracts. Biotechniques47:941–949.
- Wales, N., J.A.Romero-Navarro, E.Cappellini, and M.T.P.Gilbert. 2012. Choosing the Best Plant for the Job: A Cost- Effective Assay to Prescreen Ancient Plant Remains Destined for Shotgun Sequencing. PLoS ONE7:e45644.
- Meyer, M. and M.Kircher. 2010. Illumina sequencing library preparation for highly multiplexed target capture and sequencing Cold Spring Harb Protoc2010:pdb.prot5448.
- Kircher, M., S.Sawyer, and M.Meyer. 2012. Double indexing overcomes inaccuracies in multiplex sequencing on the Illumina platform. Nucleic Acids Res.40:e3.
- Barnes, I., B.Shapiro, A.Lister, T.Kuznetsova, A.Sher, D.Guthrie, and M.G.Thomas. 2007. Genetic structure and extinction of the woolly mammoth, Mammuthus primigenius. Curr Biol.17:1072–1075.
- Debruyne, R., G.Chu, C.E.King, K.Bos, M.Kuch, C.Schwarz, P.Szpak, D.R.Grocke, et al.. 2008. Out of America: Ancient DNA evidence for a new world origin of late quaternary woolly mammoths. Curr. Biol.18:1320–1326.
- Gilbert, M.T.P., D.I.Drautz, A.M.Lesk, S.Y.W.Ho, J.Qi, A.Ratan, C.H.Hsu, A.Sher, et al.. 2008. Intraspecific phylogenetic analysis of Siberian woolly mammoths using complete mitochondrial genomes. Proc. Natl. Acad. Sci. USA105:8327–8332.
- Krause, J., P.H.Dear, J.L.Pollack, M.Slatkin, H.Spriggs, I.Barnes, A.M.Lister, I.Ebersberger, et al.. 2006. Multiplex amplification of the mammoth mitochondrial genome and the evolution of Elephantidae. Nature439:724–727.
- Enk, J., A.Devault, R.Debruyne, C.E.King, T.Treangen, D.O’Rourke, S.L.Salzberg, D.Fisher, et al.. 2011. Complete Columbian mammoth mitogenome suggests interbreeding with woolly mammoths. Genome Biol.12:R51.
- Rohland, N., A.S.Malaspinas, J.L.Pollack, M.Slatkin, P.Matheus, and M.Hofreiter. 2007. Proboscidean mitogenomics: Chronology and mode of elephant evolution using mastodon as outgroup. PLoS Biol.5:e207.
- Untergasser, A., I.Cutcutache, T.Koressaar, J.Ye, B.C.Faircloth, M.Remm, and S.G.Rozen. 2012. Primer3--new capabilities and interfaces. Nucleic Acids Res.40:e115.
- Martin, M. 2011. Cutadapt removes adapter sequences from high-throughput sequencing reads. EMBnet.journal17:10–12.
- Magoč, T. and S.L.Salzberg. 2011. FLASH: fast length adjustment of short reads to improve genome assemblies. Bioinformatics27:2957–2963.
- Li, H. and R.Durbin. 2009. Fast and accurate short read alignment with Burrows-Wheeler transform. Bioinformatics25:1754–1760.
- Neph, S., M.S.Kuehn, A.P.Reynolds, E.Haugen, R.E.Thurman, A.K.Johnson, E.Rynes, M.T.Maurano, et al.. 2012. BEDOPS: high-performance genomic feature operations. Bioinformatics28:1919–1920.
- Ginolhac, A., M.Rasmussen, M.T.Gilbert, E.Willerslev, and L.Orlando. 2011. mapDamage: testing for damage patterns in ancient DNA sequences. Bioinformatics27:2153–2155.
- Dabney, J. and M.Meyer. 2012. Length and GC-biases during sequencing library amplification: a comparison of various polymerase-buffer systems with ancient and modern DNA sequencing libraries. Biotechniques52:87–94.
- Mokry, M., H.Feitsma, I.J.Nijman, E.de Bruijn, P.J.van der Zaag, V.Guryev, and E.Cuppen. 2010. Accurate SNP and mutation detection by targeted custom microarray-based genomic enrichment of short-fragment sequencing libraries. Nucleic Acids Res.38:e116.
- Kozarewa, I., Z.Ning, M.A.Quail, M.J.Sanders, M.Berriman, and D.J.Turner. 2009. Amplification-free Illumina sequencing-library preparation facilitates improved mapping and assembly of (G+C)-biased genomes. Nat. Methods6:291–295.
- Kozarewa, I. and D.J.Turner. 2011. Amplification-free library preparation for paired-end Illumina sequencing. Methods Mol. Biol.733:257–266.
- Aird, D., M.G.Ross, W.S.Chen, M.Danielsson, T.Fennell, C.Russ, D.B.Jaffe, C.Nusbaum, and A.Gnirke. 2011. Analyzing and minimizing PCR amplification bias in Illumina sequencing libraries. Genome Biol.12:R18.
- Kihana, M., F.Mizuno, R.Sawafuji, L.Wang, and S.Ueda. 2013. Emulsion PCR-coupled target enrichment: An effective fishing method for high-throughput sequencing of poorly preserved ancient DNA. Gene528:347–351.
- Colotte, M., V.Couallier, S.Tuffet, and J.Bonnet. 2009. Simultaneous assessment of average fragment size and amount in minute samples of degraded DNA. Anal. Biochem.388:345–347.
- Briggs, A.W., J.M.Good, R.E.Green, J.Krause, T.Maricic, U.Stenzel, and S.Paabo. 2009. Primer extension capture: targeted sequence retrieval from heavily degraded DNA sources. J Vis Exp.e1573.
- Maricic, T., M.Whitten, and S.Paabo. 2010. Multiplexed DNA sequence capture of mitochondrial genomes using PCR products. PLoS ONE5:e14004.

