
Abstract
Recently, long oligonucleotide (60- to 70-mer) microarrays for two-color experiments have been developed and are gaining widespread use. In addition, when there is limited availability of mRNA from tissue sources, RNA amplification can and is being used to produce sufficient quantities of cRNA for microarray hybridization. Taking advantage of the selective degradation of RNA under alkaline conditions, we have developed a method to “strip” glass-based oligonucleotide microarrays that use fluorescent RNA in the hybridization, while leaving the DNA oligonucleotide probes intact and usable for a second experiment. Replicate microarray experiments conducted using stripped arrays showed high reproducibility, however, we found that arrays could only be stripped and reused once without compromising data quality. The intraclass correlation (ICC) between a virgin array and a stripped array hybridized with the same sample showed a range of 0.90–0.98, which is comparable to the ICC of two virgin arrays hybridized with the same sample. Using this method, once-stripped oligonucleotide microarrays are usable, reliable, and help to reduce costs.
Introduction
DNA microarrays are a powerful tool for functional genomic studies. For many microarrays, pieces of DNA are deposited onto known locations on specially coated glass slides, and then these arrays are hybridized with fluorescently labeled cDNA molecules (Citation1). One important aspect of all microarray studies is the replication of data; for the microarray community, sample replicates are of the utmost importance, and the more replicates one performs, the more statistical power can be gained (Citation2). The expense of performing replicate microarray experiments, however, greatly adds to the overall cost and, in many cases, is impractical due to economic constraints. Typically, a single DNA microarray is used only once; however, there are several characteristics of long oligonucleotide arrays (Citation3) that, when coupled with a linear amplification sample labeling protocol that produces cRNA, makes them a candidate for alkaline-based stripping techniques (i.e., removing the labeled probe from the microarray for reuse, as is done with Southern blot analysis). First, the DNA oligonucleotides are covalently bound to the coated surface of the glass slide. Second, the glass slide and its coating are minimally damaged by base with limited treatment times. Third, the arrays can be utilized with a linear amplification protocol that produces fluorescent cRNA, not cDNA, for hybridization. Microarrays hybridized using this protocol can be stripped by taking advantage of the selective degradation of RNA under alkaline conditions while the DNA (target probes) remains intact.
Sodium hydroxide has been used to degrade RNA during the extraction of DNA from biological materials for many years. It is also used to destroy input RNA in a variety of fluorescent dye cDNA-labeling methods for microarray applications (Citation4). However, most “stripping” protocols typically use temperatures around 95°C (Citation5–7), which is above the melting point of hybridized cRNA-DNA complexes but is high enough to damage the slide coating. Here we describe a methodology for stripping some DNA microarrays that can then be reused with a high level of reproducibility.
Materials and methods
Linear RNA Amplification and Microarray Hybridizations
Total RNA was isolated from a human breast tumor, a human lung squamous cell carcinoma, and from two cultured breast tumor epithelial cell lines (ZR-75-1 and SUM149), according to the manufacturer’s protocol (RNeasy® Midi Kit; Qiagen, Valencia, CA, USA). These total RNA samples were run on a LabChip® Bioanalyzer 2100 (Agilent Technologies, Wilmington, DE, USA) to ensure RNA quality. The total RNA labeling and hybridization protocol used is described in the Agilent Low RNA Input Linear Amplification Kit (Agilent Technologies), with the following two changes: (i) a QIAquick® PCR Purification Kit (Qiagen) was used to clean up the cRNA instead of the LiCl precipitation and (ii) the volumes of all reagents were reduced by one half. This second change conserves reagents and still produces more than enough cRNA to perform several hybridizations. Each sample was assayed versus a common reference sample that was a mixture of Human Universal Reference Total RNA (100 µg; Stratagene, La Jolla, CA, USA) (Citation8) with 0.3 µg MCF-7 mRNA (ATCC, Manassas, VA, USA) and 0.3 µg ME16C mRNA (a gift from Dr. Jerry Shay, UTSW, Dallas, TX, USA) added. All labeling incubations were done with a MiniCycler® Peltier Thermal Cycler (MJ Research, Waltham, MA, USA) with a heated lid. Microarray hybridizations were carried out using Agilent Human 1A and 1A(V2) Oligonucleotide Microarrays (Agilent Technologies) in a Robbins® Scientific Hybridization Oven (Matrix Technologies, Hudson, NH, USA) using a “22k chamber” with 2 µg labeled Cy™3/Reference and 2 µg Cy5/experimental sample using the In Situ Hybridization Kit Plus (Agilent Technologies) as described by the manufacturer. The arrays were incubated overnight and then washed once for 10 min in 2× standard saline citrate (SSC) and 0.0005% Triton® X-102, twice for 5 min in 0.1× SSC, and then immersed into Stabilization and Drying Solution (Agilent Technologies) for 20 s and then air-dried.
Sodium Hydroxide Treatment for Stripping
The used microarrays were first rinsed in acetonitrile for 60 s and then immersed in 400 mL of stripping buffer A (1× SSC, 0.00025% Triton X-102, 8 mM NaOH, 250 mM EDTA) at 60°-62°C for 8 min. The temperature is critical and needs to be controlled precisely because the arrays retain significant signals at temperatures lower than 60°C, and their coating becomes damaged at temperatures higher than 65°C. The arrays are then transferred to stripping buffer B, which is the same as striping buffer A except that it contains 4 mM NaOH, for 5 min at 60°-62°C. Next, the arrays are washed at room temperature for 20 min in 2× SSC/0.005% Triton X-102 on a shaker, and then washed twice for 30 min in 1× SSC, and finally washed once in 0.1% SSC for 10 min and scanned using a GenePix® 4000B Scanner (Molecular Devices, Union City, CA, USA) with the Cy3 channel/photomultiplier tube (PMT) setting at 450 and the Cy5 channel setting at 550. To determine whether a slide needs to be treated for a second cycle, we set the image intensity at 91 and contrast at 99 when scanning; if there are no features other than control spots with an intensity greater than 200, the slide does not need another cycle, but if noncontrol features are observable, repeat the stripping procedure starting with stripping buffer B. Finally, the slides are washed with 0.1% SSC for 20 min, allowed to air dry at room temperature, washed one last time with 100% acetonitrile for 1 min, and then air-dried. The stripped slides should be stored in the dark and under a vacuum until use.
Microarray Scanning and Intraclass Correlation Statistical Analysis
All microarrays were scanned using the GenePix 4000B Scanner. The image files were analyzed with GenePix Pro 4.1 and loaded into the University of North Carolina at Chapel Hill (UNC-CH) Microarray Database (https://genome.unc.edu/), where a Lowess normalization procedure is performed to adjust the Cy3 and Cy5 channels. All primary microarray data associated with this study have been deposited into the National Center for Biotechnology (NCBI)’s Gene Expression Omnibus (GEO; http://www.ncbi.nlm.nih.gov/geo/) under the series GSE1706 containing 20 arrays.
A commonly used method for comparing replicate microarrays has been to calculate a Pearson correlation coefficient (Citation9). The Pearson correlation measures whether there is a relationship or trend between two quantitative variables. If two arrays produce the same results on a gene-by-gene basis, a high, positive Pearson correlation coefficient is likely, but there are cases when the Pearson correlation coefficient fails to detect nonreproducibility (Citation9). The intraclass correlation coefficient (ICC) is a preferable statistic for measuring the agreement between two replicate arrays (Citation10). If both replicates yield identical readings, the ICC is 1 (perfect agreement), while an ICC of zero represents agreement no better than what would be expected from chance alone, and a negative ICC value results if agreement is lower than what would be expected based on chance alone. To estimate the ICC, we used the SAS program presented by Lee et al. (Citation10), with minor modifications to allow for appropriate handling of missing data.
Results and discussion
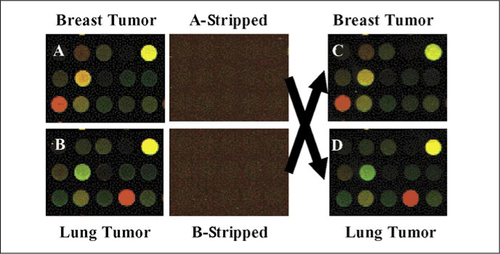
Here we describe a protocol that allows one to strip and reuse long (60- to 70-mer) oligonucleotide DNA microarrays by taking advantage of the fact that some sample labeling protocols generate fluorescent RNA and not DNA; because the probe is RNA, we reasoned that it could be degraded using an alkaline treatment, while the DNA target probes that are covalently attached to the array would remain intact. To test the quality of alkaline-stripped microarrays, we designed a “sample flipping experiment” in which each of two samples was labeled and hybridized to two different arrays, the four arrays were stripped, and each of the same two samples was then hybridized to the two opposite arrays (giving eight arrays in total). The similarity in expression data across virgin versus stripped arrays was first evident by visual examination of the features on a 5 × 3 square shown in . For example, the feature at the lower left corner of , which had been hybridized with breast tumor sample, was red and changed to green in , where the array was stripped and hybridized with a lung tumor sample. Thus, it appears as if stripping using a mild NaOH step is able to completely remove the bound cRNA without compromising the integrity of the covalently bound DNA probes or slide coating.
The upper left-hand corner of each panel starts at row 67 and column 18 of an intact microarray image from an Agilent Human 1A microarray. The arrows show that the stripped arrays were switched and hybridized with the other sample. (A and B) The same section from two virgin arrays hybridized individually with cRNA of each sample indicated. (A-Stripped and B-Stripped) The same sections from the two stripped arrays scanned before the second hybridization. (C and D) The same sections from the two stripped arrays hybridized individually with cRNA of the indicated flipped sample.
A typical method to evaluate microarray reproducibility is to calculate a correlation coefficient between replicate arrays. The result of a Pearson correlation calculation of the virgin arrays versus their stripped arrays showed a high correlation (0.90–0.98). A Pearson correlation, however, may theoretically not be the best method to assess agreement between two replicate arrays. We believe that an ICC analysis as described by Lee et al. (Citation10) is a more appropriate test of reproducibility than a Pearson correlation because the ICC is an assessment of agreement while a Pearson coefficient assesses correlation. The ICC analysis showed that the stripped arrays gave ICC correlation values (0.92 and 0.98) that are equivalent to the values obtained when using virgin arrays (). Another 15 pairs of virgin versus stripped array replicates have been performed in our laboratory and showed ICC values ranging from 0.92–0.99, with 12 of them above 0.96 (data not shown); it also did not matter if these were mouse or human oligonucleotide microarrays. These results suggest that once-stripped arrays can be used with high reproducibility.
A second way to analyze the data is to perform a supervised analysis of virgin versus stripped arrays to determine if there were any genes/spots whose intensity levels correlate with being a virgin or stripped array. We therefore performed a comparison of the four arrays hybridized with the breast tumor versus the four arrays hybridized with the lung tumor using significance analysis of microarrays (SAM; Reference (Citation11) and determined that there were approximately 1200 significantly different genes when the false discovery rate was one gene. For the breast tumor arrays, the SAM of the two virgin versus the two stripped arrays hybridized with the identical sample revealed that there were 13 significant genes of the 17,000 tested (all green spots and none of them changed greater than two-fold). In addition, all of the 13 genes were expressed at low levels (intensity range 29–937). For the lung tumor sample, a similar analysis showed that there was one significant gene with a false discovery rate of one; this result is consistent with the ICC values (both 0.98) of the lung sample arrays (). Another way to examine reproducibility is to perform a SAM analysis of four virgin only or four stripped arrays only (i.e., two breast virgin vs. two lung virgin or two breast stripped vs. two lung stripped), and when we did this, we observed 81%-89% gene overlap between each of the two gene lists and the SAM list of four breast arrays versus four lung arrays; this analysis shows similar values to the correlation analyses, however, it does have the statistical flaw of using only two arrays to represent each SAM class.
Table 1. Intraclass Correlation (ICC) of Four Virgin Arrays Versus Their Stripped Counterparts Hybridized with Two Different Tumor Samples
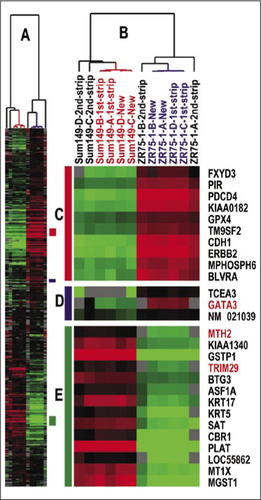
To determine whether an array can be stripped more than once, we performed additional flipping experiments using two different breast epithelial cell lines and compared ICC values after the first, second, and third rounds of stripping. A hierarchical clustering analysis using a breast tumor classification gene list (Citation12) on the 12 arrays that were the four virgin arrays and their first and second stripped counterparts hybridized with the same cRNA from ZR-75-1 and SUM149, demonstrated that first stripped arrays are virtually the same as the virgin counterparts, while the second stripped arrays showed lower similarity ( and Supplementary Table S1). This cluster analysis also showed that some genes expression values were different on second stripped arrays such as GATA3, MTH2, and TRIM29 (, D and E). Compared to virgin arrays, the first stripped arrays showed ICC values between 0.96 and 0.99, while the second stripped arrays showed ICC values between 0.78 and 0.90 (Supplementary Table S1), and the third stripped arrays were deemed to not be usable at all due to damage to the slide coating that resulted in high background values (data not shown).
(A) Scaled-down version of the complete cluster diagram. (B) Close-up of the sample-associated dendrogram. (C) Luminal epithelial gene cluster. (D) A second luminal epithelial enriched cluster. (E) Basal epithelial-enriched gene cluster.
These data show that the mild alkaline stripping of oligonucleotide arrays is possible and that first stripped arrays showed replication correlation values that were equivalent to the values obtained using virgin arrays. To our knowledge, all published microarray stripping protocols are derived from methods to strip Northern or Southern blots and utilize high-temperature alkaline incubations (>95°C) to remove bound probe. These routine stripping protocols destroy the slide coating of our DNA microarrays and thus cannot be used. Our methodology is novel because we optimized two key factors: (i) the mild alkaline conditions, which required a series of sodium hydroxide concentrations to be tested, and (ii) “mild temperatures“ of 60°-62°C. Collectively, we recommend stripping and reusing arrays only once because the once-stripped arrays do not compromise reproducibility, as judged by similar total intensities (data not shown) and ICC values equivalent to virgin arrays (Supplementary Table S1). Twice-stripped arrays could be used for training purposes; however, it is clear that with multiple stripping, the slide coating becomes compromised and results in high background values. In summary, these data show that long oligonucleotide DNA microarrays that have been hybridized with labeled cRNA can be stripped clean and reliably reused once. This protocol will reduce the cost of replicating experimental results for investigations of gene expression profiles.
Competing Interests Statement
The Perou laboratory has collaborations with Agilent Technologies, Inc. to evaluate some of their products and web-based services. Agilent Technologies did not provide any support for this work, nor have they seen this manuscript.
High reproducibility using sodium hydroxide-stripped long oligonucleotide DNA microarrays
Download PDF (106.4 KB)Acknowledgments
We thank Xiaping He for RNA preparation of the samples, Mehmet Karaca for analysis of the data using Pearson Correlation in SAS, and Junyuan Wu for GEO submission. This work was supported by funds from the National Cancer Institute (NCI) Breast SPORE program to UNC-CH (grant no. P50-CA58223-09A1) and by the National Institute of Environmental Health Sciences Toxicogenomics Research Consortium (grant no. 5-U19-ES11391-03) to C.M.P.
Supplementary data
To view the supplementary data that accompany this paper please visit the journal website at: www.tandfonline.com/doi/suppl/10.2144/05381MT02
Additional information
Funding
References
- Brown, P.O. and D.Botstein. 1999. Exploring the new world of the genome with DNA microarrays. Nat. Genet.21:33–37.
- Kerr, M.K. and G.A.Churchill. 2001. Statistical design and the analysis of gene expression microarray data. Genet. Res.77:123–128.
- Hughes, T.R., M.Mao, A.R.Jones, J.Burchard, M.J.Marton, K.W.Shannon, S.M.Lefkowitz, M.Ziman, et al.. 2001. Expression profiling using microarrays fabricated by an ink-jet oligonucleotide synthesizer. Nat. Biotechnol.19:342–347.
- Perou, C.M., T.Sorlie, M.B.Eisen, M.van de Rijn, S.S.Jeffrey, C.A.Rees, J.R.Pollack, D.T.Ross, et al.. 2000. Molecular portraits of human breast tumours. Nature406:747–752.
- Bao, Z., M.Wenli, S.Rong, L.Ling, G.Qiuye, and Z.Wenling. 2002. Re-use of a stripped cDNA microarray. Br. J. Biomed. Sci.59:118–119.
- Consolandi, C., B.Castiglioni, R.Bordoni, E.Busti, C.Battaglia, L.R.Bernardi, and G.De Bellis. 2002. Two efficient polymeric chemical platforms for oligonucleotide microarray preparation. Nucleosides Nucleotides Nucleic Acids21:561–580.
- Dolan, P.L., Y.Wu, L.K.Ista, R.L.Metzenberg, M.A.Nelson, and G.P.Lopez. 2001. Robust and efficient synthetic method for forming DNA microarrays. Nucleic Acids Res.29:E107.
- Novoradovskaya, N., M.L.Whitfield, L.S.Basehore, A.Novoradovsky, R.Pesich, J.Usary, M.Karaca, W.K.Wong, et al.. 2004. Universal reference RNA as a standard for microarray experiments. BMC Genomics5:20.
- Lin, L.I. 1989. A concordance correlation coefficient to evaluate reproducibility. Biometrics45:255–268.
- Lee, J., D.Koh, and C.N.Ong. 1989. Statistical evaluation of agreement between two methods for measuring a quantitative variable. Comput. Biol. Med.19:61–70.
- Tusher, V.G., R.Tibshirani, and G.Chu. 2001. Significance analysis of microarrays applied to the ionizing radiation response. Proc. Natl. Acad. Sci. USA98:5116–5121.
- S⊘rlie, T., R.Tibshirani, J.Parker, T.Hastie, J.S.Marron, A.Nobel, S.Deng, H.Johnsen, et al.. 2003. Repeated observation of breast tumor subtypes in independent gene expression data sets. Proc. Natl. Acad. Sci. USA100:8418–8423.

