

Abstract
Isolation of spheroid-forming cells is important to investigate cancer stem cell (CSC) characteristics. However, conventional tumor spheroid culture methods have not proven suitable because the aggregated spheroids generally maintain their original heterogeneity and harbor multiple cells with various characteristics. Here we cultured spheroids using a polydimethylsiloxane microwell-based method and a limiting dilution protocol. We then isolated and enriched for CSCs that formed single cell-derived spheroids from gastric cancer cell lines. Cells from the microwell demonstrated higher self-renewal, increased expression of stem cell markers and resistance to apoptosis compared with spheroid cells made by the traditional method. This novel approach allows efficient cancer stem cell isolation and represents a step forward in cancer stem cell studies.
Keywords: :
This microwell-based spheroid culture method provides the following advantages over the traditional spheroid culture platforms: it is ready for co-culture without direct cell-to-cell contact; allows easy growth medium changes in the device due to the shear-free structure; and provides unlimited throughput, given that 361 cell spheroids can be obtained from a single device.
Cancer stem cells (CSCs) have been hypothesized to drive tumor initiation, metastasis and chemoresistance. The American Association for Cancer Research defines CSCs as subpopulations of cells within a tumor that possess the capacity for self-renewal and that differentiate into heterogeneous lineages of cancer cells that constitute a tumor [Citation1]. Emerging evidence suggests that CSCs contribute to disease recurrence after completion of initial treatment [Citation2].
To form spheroids, candidate cells are seeded in culture dishes under special nonadherent conditions in serum-free medium. This approach has been used to isolate gastric CSCs in most studies [Citation3,Citation4]. Many studies have reported that the capability of CSCs to form spheroid structures is acquired in various solid tumors [Citation5–9]. Hanging drop culture, surface topology, microwells and microfluidic devices have all been developed as techniques for studying the formation of aggregated multicellular spheroids [Citation10–13]. Nevertheless, these methods have not proven suitable for isolation of specific cells from a heterogeneous cell population because the aggregated spheroids generally maintain their original heterogeneity and harbor multiple cells with various characteristics [Citation14].
Here, we used a limiting dilution protocol [Citation15] in concert with a microwell-based spheroid culture plate to isolate spheroid-forming single cells. Spheroid-forming cells were selected by their capacity for anchorage-independent growth. The selected spheroid cells proliferated without forming agglomerates or cell-to-cell contacts. The ability of a single cell to generate a spheroid is considered indicative of self-renewal ability and is therefore consistent with a CSC phenotype [Citation7]. Using gastric cancer cell lines, we isolated single cell-derived spheroid cells. These spheroids were clear and round and were composed of tightly bound cells; moreover, they were not isolated by the traditional culture method. We also examined whether these cells exhibited distinct stemness gene expression or apoptotic resistance properties compared with spheroid cells isolated by the traditional culture method.
Materials & methods
Cell lines & culture conditions
The human gastric cancer cell lines SNU-638 and SNU-484 were obtained from the Korean Cell Line Bank (Seoul, Korea). Cells were maintained in RPMI-1640 medium (HyClone, MA, USA) supplemented with 10% FBS (HyClone), 25 mM 4-(2-hydroxyethyl)-1-piperazineethanesulfonic acid (HEPES; Invitrogen, CA, USA), 25 mM NaHCO3 (Invitrogen), and 1% penicillin/streptomycin (HyClone). Cells were grown at 37°C in a humidified incubator with 5% CO2 until the monolayers reached confluence.
Spheroid culture
For traditional 3D tumor spheroid culture, 500 cells were seeded onto each poly 2-hydroxyethyl methacrylate (PolyHEMA)-coated (to prevent attachment) 24-well plate as previously described [Citation3,Citation16].
The ‘C-Well’ microwell plate (Incyto, Chonan, Korea) was made of polydimethylsiloxane (PDMS), had 361 microwells, and was 29 × 29 mm2. Each well had an inner diameter of 500 μm and a depth of 500 μm. Seeding density was calculated as number of cells per volume for single cell occupancy in each microwell. For microwell-based spheroid culture, 5 × 10³ parent cells were seeded onto the microwell, which was placed in a 60-mm petri dish (SPL, Pocheon, Korea). After 30 min, the medium was refreshed to remove any cells that had landed outside the microwells. We confirmed the spheroid that derived from a single cell with microscopic observation. For spheroid culture, serum-free RPMI-1640 medium containing 1% B-27 supplement (Invitrogen), 10 ng/ml human recombinant fibroblast growth factor-basic (Invitrogen), 20 ng/ml human recombinant epidermal growth factor (Invitrogen), 10 mM HEPES (Invitrogen), and 1% penicillin/streptomycin (HyClone) was used. The medium was changed every 4 days. After 2 weeks, spheroids were examined using an Olympus CK40 optical microscope (Olympus, Tokyo, Japan) and images were captured with a Canon EOS 600D CCD Camera (Canon, Tokyo, Japan). For the second passage, spheroids were dissociated into single cells using trypsin-EDTA and mechanical disruption with a pipette. The resulting cells were then suspended in spheroid culture medium and plated onto a new microwell to allow spheroid reformation.
Viability
On day 14 of culture, the spheroids were stained using a fluorescence-based live/dead cell viability assay kit (Invitrogen) according to the manufacturer’s instructions. The medium was replaced with medium containing ethidium homodimer-1 and calcein AM, after which the cells were incubated overnight at 37°C. Spheroids were examined using an Olympus DP 71 microscope (Olympus) and an LSM 700 laser scanning microscope (Zeiss, Oberkochen, Germany) to evaluate cellular viability.
Quantitative reverse transcription real-time PCR
Total RNA was prepared using TRIzol (MRC, OH, USA) according to the manufacturer’s instructions. For quantitative RNA analysis, 1 μg of total RNA was reverse transcribed using M-MLV reverse transcriptase (Invitrogen) to produce cDNA. Amplification was performed in a CFX Real-Time PCR Detection System (Bio-Rad, CA, USA) using iQ SYBR Green Supermix (Bio-Rad). For quantitative real-time PCR analysis, the expression level of each mRNA of interest was normalized to the GAPDH mRNA expression levels. The following primer sequences were used:
OCT4: forward 5′-GCAGCGACTATGCACAACGA-3′, reverse 5′-CCAGAGTGGTGACGGAGACA-3′; SOX2, forward 5′-CATCACCCACAGCAAATGACA-3′, reverse 5′-GCTCCTACCGTACCACTAGAACTT-3′; NANOG, forward 5′-AATACCTCAGCCTCCAGCAGATG-3′, reverse 5′-TGCGTCACACCATTGCTATTCTTC-3′; GAPDH, forward 5′-CAGCCTCAAGATCATCAGCAATG-3′, reverse 5′-TCATGAGTCCTTCCACGATACCA-3′.
Western blot analysis
For western blot analysis, parent cells were harvested from cells plated at 70–80% confluence. To collect whole cell extracts, parent and spheroid cells were lysed using PRO-PREP™ (iNtRON Biotechnology, Seongnam, Korea) according to the manufacturer’s instructions. Protein concentrations were determined using the BCA assay (Bio-Rad), after which 30 ug of protein was loaded onto an 8% SDS-PAGE gel. After electrophoresis was carried out, the resolved proteins were transferred to a polyvinylidene difluoride membrane. The membranes were blocked in PBS with 0.1% Tween-20 and 5% nonfat milk for 1 h. After incubation at 4°C overnight with primary antibodies, goat anti-mouse (Bio-Rad) or goat anti-rabbit (Santa Cruz Biotechnology, TX, USA) secondary antibodies conjugated with horseradish peroxidase were added to the membranes at a 1:5000 dilution and incubated for 1 h at room temperature. Immunoreactive bands were detected using the ECL Western Blot Detection system (Amersham Biosciences, CA, USA); images were captured using a Chemi-Doc imager (Bio-Rad). The following concentrations were used for primary antibodies: anti-OCT4, 1:1000 (Abcam); anti-SOX2, 1:1000 (Cell Signaling); anti-NANOG, 1:1000 (Cell Signaling); and anti-beta-actin, 1:10,000 (Sigma Aldrich).
Immunofluorescence
Spheroid cells were washed with PBS and fixed with 4% paraformaldehyde for 10 min. The fixed cells were permeabilized with 0.3% Triton X-100 in PBS for 30 min and then blocked in 5% BSA in PBS for 1 h. Next, the cells were incubated with PE Mouse Anti-Human CD44 (BD Pharmingen, CA, USA) or PE Mouse Anti-Human CD54 (BD Pharmingen) in blocking solution for 1 h according to the supplier’s instructions, after which the cells were washed three times with PBS-T. Nuclei were stained with Hoechst 33342 (Thermo Fisher, MA, USA) and the slides were mounted in mounting medium (Dako). Cells were analyzed on an LSM 700 laser scanning microscope (Zeiss).
Apoptosis assay
Spheroid cells were stained using an annexin V-FITC apoptosis detection kit (BD Pharmingen) according to the supplier’s instructions. The stained cells were analyzed using a FACSCalibur machine (BD Biosciences, CA, USA) and gated according to forward scatter and side scatter to analyze similar cell populations. Annexin V-positive and PI-negative cells were considered early apoptotic cells, while annexin V-positive and PI-positive cells were considered necrotic cells.
Soft agar colony-formation assay
Soft agar assays were constructed in 60 mm dish. Briefly, 5 × 10³ cells were resuspended in 2-ml with final concentration of 1x media containing 0.3% agarose (Amresco, OH, USA), and then paved on a 2 ml base layer containing 0.6% agar. The plates were incubated for 14–21 days at 37°C, 5% CO2 condition, then stained with 0.01% crystal violet, 10% methanol solution for 1 h (Sigma). Assays were repeated a total of three times.
Xenograft model
Xenograft studies were approved by the Institutional Animal Care and Use Committee (IACUC) of Korea University College of Medicine (IACUC approval No. KOREA-2017-0108). 6-week-old male nude mice were purchased from Orient Bio Animal Center (Seongnam, Korea). Nude mice were injected with a suspension of parent of spheroid cells subcutaneously into the flank.
Statistical analysis
Data are expressed as means ± standard deviations. At least three experiments were performed independently for each type of experiment to ensure reproducibility. Statistical differences among the experimental groups were evaluated by analysis of variance, followed by Student’s t-test. p-values less than 0.05 were considered statistically significant.
Results & discussion
Single cell-derived spheroids isolated using microwell-based culture method with gastric cancer cells
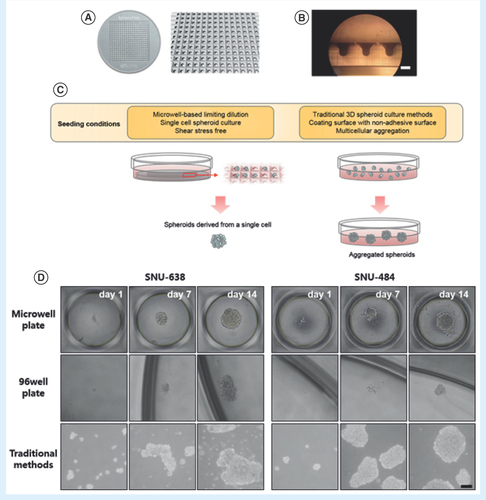
Due to the disadvantages of traditional 3D spheroid screening culture methods, we performed a limiting dilution protocol using a microwell spheroid culture chip to isolate spheroid-forming single cells from mixed populations. The microwell-based chip was made from PDMS (). In , the side of the small wells on the microwell was magnified ten times, enabling the consistency of the chamber shape to be observed. displays a schematic diagram of the culture process and of the process of spheroid isolation from single cells without shear stress. By using a microwell, cell loss was minimized when changing the culture medium. To test the effectiveness of spheroid isolation using the microwell, we used the chip with SNU-638 and SNU-484 cells. On the microwell, several cells formed round spheroids with clear boundaries; these spheroids are hereafter referred to as single-cell-derived spheroids (SS; , top). SS#1 had clear boundaries, were compact, and were tightly adhered to each other, hindering the distinction of individual cells from each other. However, a small portion of these two populations of gastric cancer cells formed irregular spheroids with poor cell-to-cell adhesion by the traditional 3D tumor spheroid culture method; these spheroids are referred to as tumor spheroids (TS; , bottom). Approximately two- to three-fold more TS#1 spheroids were formed compared with the spheroids formed from the microwell. We hypothesized that the TS#1 spheroids were composed of mixed cell populations that formed agglomerates and irregularly shaped spheroids lacking self-renewal ability. In addition, SS#1 spheroids could be detected in the microwell but not on the nonadherent 96-well plates (, middle). The use of the microwell enables precise single-cell seeding and also enables the exclusion of cells under shear stress from agglomerates. Next, we compared the self-renewal capability of spheroids isolated from the traditional method with that of spheroids isolated from the microwell-based culture method.
(A) Illustration of the microwell-based spheroid culture chip. The chip was made of polydimethylsiloxane and had 361 microwells in a 29 × 29 mm2 area. Each well size was 500 μm (inner diameter) × 500 μm (depth). (B) Magnified cross-sectional image of the microwell-based chip (vertical axis, 10x magnification, scale bar = 500 μm). (C) Schematic illustration of the microwell-based and traditional spheroid culture methods. Growth medium can be readily changed in the microwell due to the shear stress-free structure. (D) Sequential microscopic images of spheroid cells from SNU-638 and SNU-484 cells cultured by the microwell-based, nonadherent 96-well culture plate and traditional spheroid culture methods. Representative phase contrast images from day 1 to day 14 are shown of spheroids (40x magnification, scale bar = 100 μm).
Single cell-derived spheroids show self-renewal ability & uniformity
We measured the numbers and diameters of spheroids isolated from both methods to examine the self-renewal potential of each spheroid type. SS#1 spheroids were separated into single cells and seeded at the same concentration on a new microwell. Divided single cells from SS#1 spheroids proliferated on SS#2 spheroids in the same clear, round forms (). The percentage of spheroid-forming cells in the second passage increased from 1.4 to 21.1% (five to 76 in 361 microwells) for SNU-638 cells and from 54 to 96.1% (195 to 347 in total 361 microwells) for SNU-484 cells (). The increased number of spheroids with clear boundaries in the second culture passage provides definitive evidence for the self-renewal capacity of these spheroids. It also indicates that the spheroids were enriched with CSC properties.
(A) Microscopic images of a second-passage spheroid formed from a single SS#1 cell after another 2 weeks in culture (40x magnification, scale bar = 100 μm). (B) Spheroid-forming efficiency as calculated from single dissociated spheroid cells. The single cells were counted in 361-microwells. Error bars represent standard deviation. **p < 0.01 compared with the SS#1 group (n = 4). (C) Size distribution of spheroids cultured on the microwell and on the 96-well plates.
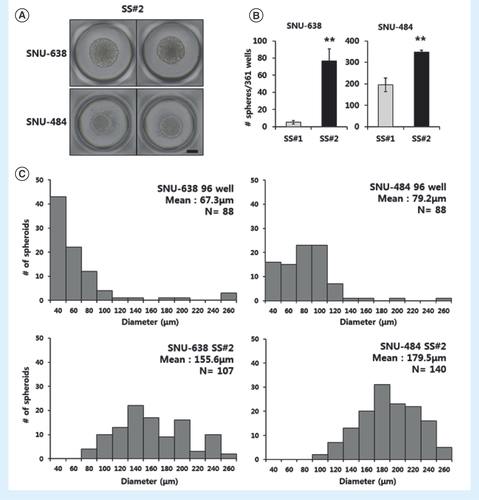
In addition, examination of the SS#2 results showed that the spheroids formed from the microwell were more uniform in size compared with spheroids formed from nonadherent surface-coated 96-well plates. The average diameters of SS#2 spheroids from SNU-638 and SNU-484 cells were 155.6 and 179.5 μm, respectively (). However, the majority of the spheroids from 96-well plates remained small, with mean diameters of 67.3 and 79.2 μm in the two cell lines, respectively. Spheroid uniformity is critical for obtaining reproducible experimental results, since size affects cellular characteristics [Citation17]. Therefore, applying the microwell-based culture method to spheroid isolation was advantageous for long-term culture approaches, since it could be performed in shear-stress free conditions and produced uniform spheroids.
Expression levels of candidate CSC markers are upregulated in single cell-derived spheroids
Many studies have demonstrated that CSCs are characterized by the upregulation of three stem cell-specific transcription factors, OCT4, SOX2 and NANOG [Citation3,Citation18]. We thus examined whether the spheroids expressed genes that have been postulated to play key roles in CSCs. The transcription levels of SOX2 and NANOG in SS#2 spheroids were four- and ten-fold higher than those in the parental cells, respectively (). However, the levels in TS#2 spheroids were not significantly increased compared with the levels in the parental cells. Also, OCT4 transcription was not detected in either TS#2 or SS#2 spheroids. Consistent with these results, the protein levels of SOX2 and NANOG, but not OCT4, were increased in SS#2 spheroids (). These data suggest that among those three genes, SOX2 and NANOG are the key factor conferring ‘stemness’ characteristics in spheroid-forming ability as previous studies reported [Citation19,Citation20]. Furthermore, higher expression levels of those genes in SS#2 than TS#2 demonstrate that our novel method isolated more homogeneous spheroid cells with stem-like characteristics.
(A) mRNA expression of stemness markers in parent and spheroid cells as measured by qRT-PCR. Each data point represents the mean of three replicates. Error bars represent standard deviation. **p < 0.01; *p < 0.05 compared to the parent group (n = 3). Expression levels were normalized to that of GAPDH. (B) Western blot analysis of stemness proteins; beta-actin was used as a loading control. Band intensity was measured with a densitometer and values are expressed relative to that of the loading control. (C) Immunofluorescence images of TS#2 and SS#2 spheroids stained with anti-CD44 or anti-CD54 antibodies (red color). The blue signal represents nuclear DNA staining by Hoechst 33342 (20x magnification, scale bar = 100 μm).
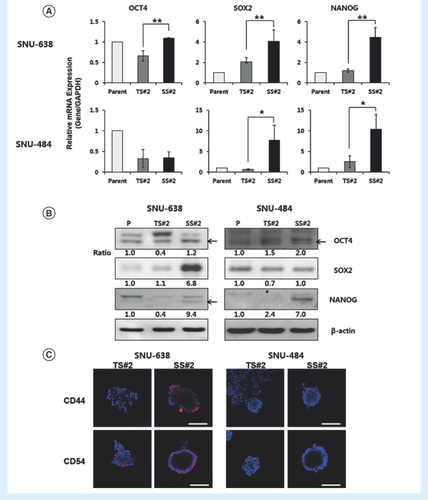
In gastric cancer, CD44 was first identified as a potential gastric CSC marker [Citation7,Citation21]. Also, LGR5 and CD54 have been reported to act as a gastric CSC marker [Citation22–24]. To assess the expression level of those markers, we performed immunocytochemical staining of TS#2 and SS#2 spheroids. CD44 and CD54 expression were remarkably upregulated in SS#2 spheroids compared with TS#2 spheroids from SNU-638 cells (). There was no significant difference between SS#2 and TS#2 spheroids derived from SNU-484 cells. LGR5 was not detectable in both cell lines (data not shown). These results suggest that more cells in SS#2 spheroids than in TS#2 spheroids have stem cell-like properties.
Single-cell-derived spheroids are resistant to apoptosis
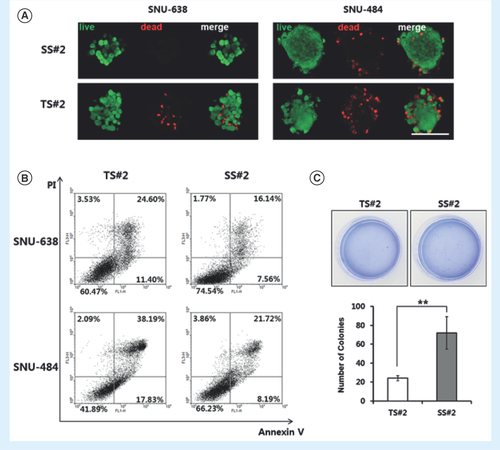
The above results suggested that the derived spheroids are composed of mixed cell populations, including non-CSCs, as previously reported [Citation25]. To test this hypothesis, the percentages of dead and apoptotic cells in both TS#2 and SS#2 spheroids were measured using a live/dead cell viability assay kit and an annexin V-FITC apoptosis detection kit, respectively, according to the manufacturers’ instructions. These assays revealed that TS#2 spheroids included more dead cells than SS#2 spheroids; these results held true for spheroids derived from SNU-638 cells and in spheroids derived from SNU-484 cells (). FACS analysis showed that approximately 40% of the cells in the TS#2 spheroids were apoptotic and necrotic (). By contrast, the SS#2 spheroids were composed of less than 25% apoptotic and necrotic cells. Taken together, our results indicate that the cells in the SS#2 spheroids were more resistant to apoptosis than those in the TS#2 spheroids.
(A) Selected fluorescence images of TS#2 and SS#2 cells. Live cells are green and dead cells are red (20x magnification, scale bar = 100 μm). (B) Representative data from an annexin-V/PI staining assay to assess apoptosis in parental and SS#2 cells. At least three independent experiments were performed, each obtaining similar results. Q3, normal; Q4, annexin V-positive (i.e., the early apoptotic population); Q1, PI positive; and Q2, annexin-V/PI positive (i.e., the late apoptotic population). (C) Representative photographs of colonies in soft agar in 60-mm dishes. Each number of colonies formed per well is presented as the mean of three replicates. Error bars represent standard deviation. **p < 0.01, compared with the parent group (n = 3).
Colony-forming & tumorigenic ability of single cell-derived spheroids
We next investigated anchorage-independent growth by assessing colony formation on soft agar, which is the gold standard assay for cellular transformation in vitro [Citation26]. For SNU-638-derived spheroids, the SS#2 spheroids formed softer agar colonies compared with the TS#2 spheroids (). However, neither SS#2 nor TS#2 spheroids derived from SNU-484 cells formed colonies, despite extended periods of time in culture (data not shown). In addition, we tested the tumorigenicity of isolated spheroid cells in vivo. The SNU-638 cell line did not show tumorigenic ability in both parent and spheroid cells, until 8 weeks from injection despite one million cells injected (data not shown). The spheroids from the SNU-484 cell line developed into a larger size of tumor than the parental cells (data not shown). Therefore, the latent population among the cells could be identified with a simple culture material.
In this study, we used a limiting dilution protocol integrated with a microwell-based spheroid culture chip to isolate spheroid-forming cells from a single cell. Various 3D, multicellular, spheroid-forming methods, such as the hanging drop assay and the use of hydrogels, have been employed to evaluate CSCs [Citation10–12,Citation27]. However, due to the rarity of CSCs, these methods are hindered by poor single-cell seeding and low throughput [Citation28]. In these methods, it is also difficult to change the culture medium for long-term culture without significant cell loss during passage. Additionally, these methods may result in the formation of spheroids containing many cells that are not CSCs. A recent report showed that CSC-like cells protect non-CSCs from anoikis and also promote tumor growth [Citation25]. As spheroid bodies themselves display marked cellular heterogeneity, experiments using spheroids should be interpreted as studies of mixed cell populations, not as purified CSCs [Citation29]. Therefore, we propose that forming spheroids from a single cell on a microwell-based culture chip is the most suitable approach for isolating and evaluating CSCs.
This is the first study demonstrating that single cell-derived spheroids from gastric cancer cells can be isolated using an elastomeric microwell-based culture method. We also showed that spheroids from the microwells have larger populations of cells with stem cell-like properties compared with spheroids formed by conventional tumor spheroid culture methods. The microwell-based spheroid culture method provides the following advantages over the hanging drop method and the other developed spheroid culture platforms: an extended culture period of 10–30 days due to easy medium changes; ready for co-culture without direct cell-to-cell contact [Citation30]; easy generation of size-controlled cell spheroids; easy growth medium changes in the device due to the shear-free and stress-free structure [Citation31]; ready application to various cell types; and unlimited throughput, given that 361 cell spheroids can be obtained from a single device. Moreover, the microwell mimics the in vivo environment and contains CSC-secreted factors [Citation32]. One recent study reported that round spheroids showed a signature of high mRNA expression for secreted molecules, which activate cell cycle-related signaling pathways and their downstream transcriptional regulators [Citation33]. This finding supports the idea that the microwell is more effective at mimicking the in vivo environment by sharing the medium. Therefore, we hypothesize that round spheroids may be acquired only in a microwell, but not in independent 96-well plates (). Additionally, the microwell facilitates independent CSC growth and avoids agglomeration with non-CSCs. Taken together, our microwell-based spheroid culture method is an efficient and suitable approach for isolating spheroid cells with stem-like characteristics on the single-cell level.
Author contributions
JWL designed the study and performed the experiments, gathered data and wrote the manuscript. JSS and YSP designed experimental approaches, and critically reviewed the data. SC constructed the microwell that was used for isolation of spheroid-forming single cells. YHK performed general oversight of the work.
Financial competing interests disclosure
This study was supported by a grant from the National Research Foundation of Korea (NRF), which is funded by the Korean government (MEST) (No. 2010-0020986). The authors have no other relevant affiliations or financial involvement with any organization or entity with a financial interest in or financial conflict with the subject matter or materials discussed in the manuscript apart from those disclosed.
No writing assistance was utilized in the production of this manuscript.
Additional information
Funding
References
- Clarke MF , DickJE, DirksPBet al. Cancer stem cells – perspectives on current status and future directions: AACR Workshop on cancer stem cells. Cancer Res.66(19), 9339–9344 (2006).
- Xu ZY , TangJN, XieHXet al. 5-fluorouracil chemotherapy of gastric cancer generates residual cells with properties of cancer stem cells. Int. J. Biol. Sci.11(3), 284–294 (2015).
- Liu J , MaL, XuJet al. Spheroid body-forming cells in the human gastric cancer cell line MKN-45 possess cancer stem cell properties. Int. J. Oncol.42(2), 453–459 (2013).
- Zhang X , HuaR, WangXet al. Identification of stem-like cells and clinical significance of candidate stem cell markers in gastric cancer. Oncotarget7(9), 9815–9831 (2016).
- Fang D , NguyenTK, LeishearKet al. A tumorigenic subpopulation with stem cell properties in melanomas. Cancer Res.65(20), 9328–9337 (2005).
- Wright MH , CalcagnoAM, SalcidoCD, CarlsonMD, AmbudkarSV, VarticovskiL. Brca1 breast tumors contain distinct CD44+/CD24- and CD133+ cells with cancer stem cell characteristics. Breast Cancer Res.10(1), R10 (2008).
- Takaishi S , OkumuraT, TuSet al. Identification of gastric cancer stem cells using the cell surface marker CD44. Stem Cells27(5), 1006–1020 (2009).
- Todaro M , AleaMP, Di StefanoABet al. Colon cancer stem cells dictate tumor growth and resist cell death by production of interleukin-4. Cell Stem Cell1(4), 389–402 (2007).
- Monterey MD , SzerlipNJ, MathupalaSP. Low-cost media formulation for culture of brain tumor spheroids (neurospheres). Biotechniques55(2), 83–88 (2013).
- Wong SF , No daY, ChoiYY, KimDS, ChungBG, LeeSH. Concave microwell based size-controllable hepatosphere as a three-dimensional liver tissue model. Biomaterials32(32), 8087–8096 (2011).
- Kelm JM , TimminsNE, BrownCJ, FusseneggerM, NielsenLK. Method for generation of homogeneous multicellular tumor spheroids applicable to a wide variety of cell types. Biotechnol. Bioeng.83(2), 173–180 (2003).
- Foty R . A simple hanging drop cell culture protocol for generation of 3D spheroids. J. Vis. Exp. (51), (2011).
- Napolitano AP , DeanDM, ManAJet al. Scaffold-free three-dimensional cell culture utilizing micromolded nonadhesive hydrogels. Biotechniques43(4), 494, 496–500 (2007).
- Brophy CM , Luebke-WheelerJL, AmiotBPet al. Rat hepatocyte spheroids formed by rocked technique maintain differentiated hepatocyte gene expression and function. Hepatology49(2), 578–586 (2009).
- Rota LM , LazzarinoDA, ZieglerAN, LeRoithD, WoodTL. Determining mammosphere-forming potential: application of the limiting dilution analysis. J. Mammary Gland Biol. Neoplasia17(2), 119–123 (2012).
- Song Z , YueW, WeiBet al. Sonic hedgehog pathway is essential for maintenance of cancer stem-like cells in human gastric cancer. PLoS One6(3), e17687 (2011).
- Mehta G , HsiaoAY, IngramM, LukerGD, TakayamaS. Opportunities and challenges for use of tumor spheroids as models to test drug delivery and efficacy. J. Control. Rel.164(2), 192–204 (2012).
- Wang AM , HuangTT, HsuKWet al. Yin Yang 1 is a target of microRNA-34 family and contributes to gastric carcinogenesis. Oncotarget5(13), 5002–5016 (2014).
- Yoon C , ChoSJ, AksoyBAet al. Chemotherapy resistance in diffuse-type gastric adenocarcinoma is mediated by RhoA activation in cancer stem-like cells. Clin. Cancer Res.22(4), 971–983 (2016).
- Yoon C , ParkDJ, SchmidtBet al. CD44 expression denotes a subpopulation of gastric cancer cells in which Hedgehog signaling promotes chemotherapy resistance. Clin. Cancer Res.20(15), 3974–3988 (2014).
- Lau WM , TengE, ChongHSet al. CD44v8–10 is a cancer-specific marker for gastric cancer stem cells. Cancer Res.74(9), 2630–2641 (2014).
- Wang B , ChenQ, CaoYet al. LGR5 is a gastric cancer stem cell marker associated with stemness and the EMT signature genes NANOG, NANOGP8, PRRX1, TWIST1, and BMI1. PLoS One11(12), e0168904 (2016).
- Chen X , WeiB, HanXet al. LGR5 is required for the maintenance of spheroid-derived colon cancer stem cells. Int. J. Mol. Med.34(1), 35–42 (2014).
- Chen T , YangK, YuJet al. Identification and expansion of cancer stem cells in tumor tissues and peripheral blood derived from gastric adenocarcinoma patients. Cell Res.22(1), 248–258 (2012).
- Kim SY , HongSH, BassePHet al. cancer stem cells protect non-stem cells from anoikis: bystander effects. J. Cell. Biochem.117(10), 2289–2301 (2016).
- Rotem A , JanzerA, IzarBet al. Alternative to the soft-agar assay that permits high-throughput drug and genetic screens for cellular transformation. Proc. Natl Acad. Sci. USA112(18), 5708–5713 (2015).
- Wang Y , WangJ. Mixed hydrogel bead-based tumor spheroid formation and anticancer drug testing. Analyst139(10), 2449–2458 (2014).
- Chen YC , IngramPN, FouladdelSet al. High-throughput single-cell derived sphere formation for cancer stem-like cell identification and analysis. Sci. Rep.6, 27301 (2016).
- Schatton T , FrankMH. The in vitro spheroid melanoma cell culture assay: cues on tumor initiation?J. Invest. Dermatol.130(7), 1769–1771 (2010).
- Halldorsson S , LucumiE, Gomez-SjobergR, FlemingRMT. Advantages and challenges of microfluidic cell culture in polydimethylsiloxane devices. Biosens. Bioelectron63, 218–231 (2015).
- Wang Y , KimMH, TabaeiSRet al. Spheroid formation of hepatocarcinoma cells in microwells: experiments and Monte Carlo simulations. PLoS One11(8), e0161915 (2016).
- Singh M , MukundanS, JaramilloM, OesterreichS, SantS. Three-dimensional breast cancer models mimic hallmarks of size-induced tumor progression. Cancer Res.76(13), 3732–3743 (2016).
- Park MC , JeongH, SonSHet al. Novel morphologic and genetic analysis of cancer cells in a 3D microenvironment identifies STAT3 as a regulator of tumor permeability barrier function. Cancer Res.76(5), 1044–1054 (2016).

