

Abstract
We have developed a simple and robust probe-free quantitative PCR (qPCR) assay method that can detect minor mutant alleles with a frequency as low as 0.1% in a heterogeneous sample by introducing a novel T-blocker concept to the allele-specific PCR method. Four new KRAS and BRAF mutation detection assays were developed and their performance was demonstrated by testing a large number of replicates, utilizing a customized PCR protocol. Highly efficient and specific mutant amplification in conjunction with selective wild-type suppression by the T-blocker concept enabled 0.1% detection sensitivity using the intercalating dye-based qPCR chemistry instead of more complex target-specific dye-labeled probes. Excellent consistency in sensitivity and specificity of the T-blocker assay concept was demonstrated.
Four quantitative PCR assays detecting somatic mutations were developed based on a novel T-blocker assay concept that consists of an allele-specific primer and a blocker made of regular nucleotides without a dye-labeled probe molecule. Assay sensitivity down to 0.1% mutant frequency was shown with a large number of reaction replicates using a customized fast PCR protocol.
Molecular genetic testing has become one of the most invaluable diagnostic tools in guiding treatment of cancer patients with the arrival of personalized medicine [Citation1–4]. To be effective, the test needs to accurately detect the genotype of the tumor cells (highly specific) with high sensitivity. In the case of somatic mutation detection, samples are typically heterogeneous with low-frequency mutant DNA that often has only a single base mutation in the abundant wild-type (WT) DNA background. Therefore, assays for somatic mutation detection have to be specific enough to distinguish one base difference in heterogeneous alleles and sensitive enough to pick up a low-level mutation in the sample. Various PCR-based assay platforms [Citation5] have been developed for somatic mutation detection, including quantitative (q)PCR [Citation6–8] and digital PCR [Citation9,Citation10]. All the PCR assays referenced above generate a positive fluorescence signal using a fluorescent dye-labeled probe molecule that is geared toward high specificity. Such a target-specific probe-based assay would enhance the assay accuracy, suppressing the false-positive signal generation that may come from unwanted amplification of the abundant WT DNA. Despite this advantage of high degree of specificity, the probe-based assay adds significant complexity to the assay development process in many cases because a new probe molecule specific to the target of interest needs to be designed, tested and included in each assay. Typically, this process takes several screening and testing iterations with numerous possible probe/primer/blocker candidate combinations to optimize assay performance.
Alternatively, intercalating dye can be used to report positive amplification of the PCR through fluorescence without using an additional reporting probe molecule. This method allows the assay design and development process to be much simpler and faster with an accompanying benefit of lower manufacturing cost. However, this method forces the assay design to be highly specific without generating nonspecific amplicons from the abundant WT DNA because intercalating dye is not target-specific and any amplification would generate a positive signal unlike the probe-based reaction.
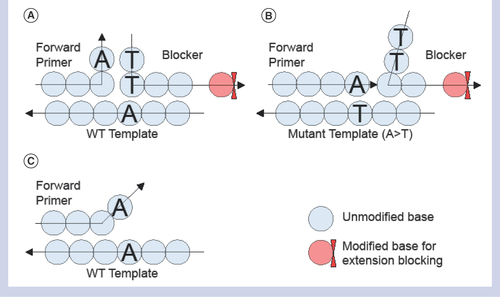
In this study, we have developed a highly specific and sensitive qPCR assay to selectively amplify somatic mutations using an innovative concept that we call the T-blocker assay. The principle of the T-blocker assay is illustrated in . In this method, there is a blocking oligonucleotide (‘blocker’) and two DNA primers that are designed to specifically recognize distinct regions of the target gene. The forward primer is fully matched to the mutant DNA template such that the 3′ end of the primer does not bind to the mismatched nucleotides of the WT DNA template. The blocker is designed to be complementary to both the WT DNA template and the 3′ end of the forward primer that is specific for the mutation. The T-blocker is formed when the 3′ end of the forward primer and the 5′ end of the blocker bind to each other and their remaining nucleotides bind to the complementary strand of a WT DNA template to form a nonextendable triplex that does not allow base-pair extension such that no amplification occurs (). When the forward primer is fully matched to the mutant allele, the primer is extended, the blocker is displaced, and amplification proceeds efficiently (). The extendable or non-extendable triplex (forward primer, blocker and DNA template) formation is realized by the novel blocker design in conjunction with the allele-specific primer. An additional complementary nucleotide base on the 5′ end of the blocker is critical to stabilizing the nonextendable triplex. It is the additional base that makes the T-blocker concept unique. It is designed to be complementary to, and base pairs with, the distinguishing base of the allele-specific primer in the presence of the WT template. The base pairing between the additional base of the blocker and the discriminating base of the allele-specific primer establishes a nonextendable triplex. In this manner, the WT DNA amplification is more effectively suppressed by the T-blocker concept () than by the allele-specific primer alone (). The loss of this key base pairing in the presence of the target variant allele converts the complex back into an extendable format and target mutant templates will be selectively amplified during PCR.
(A) Triplex of forward primer, blocker and WT template with 3′ end base ‘A’ on forward primer forms a base-pairing with 5′ end base ‘T’ on blocker resulting in a tight three-way binding triplex (inverse T shape) and preventing base extension due to 3′ end base modification on the blocker. (B) With a mutant template participating in the complex, 3′ end blocker opens up due to noncomplementary base pairing between T–T. Instead, 3′ end of primer forms an A–T base pairing with the mutant template, allowing the forward primer to be base-extended and displacing the blocker. (C) An alternative configuration to the triplex with the WT template in duplex only with a primer, but this configuration is suppressed significantly compared with the triplex due to a base mismatch at the 3′ end of the primer.
WT: Wild-type.
A typical approach of a blocker-based WT suppression in low-frequency mutation detection utilizes the binding competition with the template molecules between the forward primer and the blocker, which ultimately determines the degree of WT suppression. Such a competition-based approach inherently suffers from lower PCR efficiency with the stronger WT suppression, especially when the discriminating base is in the middle of the blocking oligonucleotide [Citation7]. A more recent study by Wang et al. [Citation8] showed assay sensitivity improvement down to 0.1% by adopting a different blocker design called ‘allele-specific nonextendable primer blocker’ and using a Taqman probe.
We have developed T-blocker-based assays using only intercalating dye chemistry to match the 0.1% detection sensitivity. As a test case, four assays were developed for activating mutations in KRAS (Kirsten rat sarcoma viral oncogene homolog) and BRAF (v- raf murine sarcoma viral oncogene homolog B1) genes that have been identified as risk factors for colorectal [Citation11–15] and lung cancers [Citation16,Citation17].
Materials & methods
Genomic DNA
Genomic DNA, purchased from Texcell (North America, Inc., MD, USA), extracted from cell lines of SK-MEL-28 for BRAF V600E mutation and HeLa are known to have BRAF and KRAS WT alleles [Citation18,Citation19], respectively. Genomic DNA for other KRAS mutations (G12C, G12S and G12V) was purchased (Horizon Discovery, MA, USA) as 50% allelic frequency and the target allelic frequency was adjusted by dilution in WT DNA. The homozygous BRAF V600E mutation carried by the SK-MEL-28 cell line was considered for the copy number estimation of the mutant alleles.
Oligonucleotide design & acquisition
All the primer and blocker designs as well as melting temperature (Tm) calculations were performed with a commercial software, Visual OMP™ (DNASoftware, MI, USA). Tm was calculated with PCR conditions of 0.2 μmol/l for primers and 1.0 μmol/l for T-blockers. Also included in the Tm calculation were 40 mmol/l monovalent cation, 3 mmol/l Mg2+, 1% glycerol, 2% DMSO and 1 mol/l betaine. All the oligonucleotides were purchased (Integrated DNA Technologies, IA, USA) at a purity grade of standard desalting without HPLC purification. Blockers were synthesized with amino modifications at the 3′ end, which does not have a free hydroxyl group for base extension as reported before [Citation20]. No fluorescent labeling was done to any oligonucleotides since the intercalating dye-based chemistry was used for qPCR.
PCR amplification
The 20 μl PCR mix contained 50 ng of DNA in addition to the PCR buffer (20 mmol/l Tris-HCl, pH 8.3, 30 mmol/l KCl, 2% DMSO, 1 mol/l betaine, 3 mmol/l MgCl2, 0.05% BSA and 0.04% Tween 20), 1.5 mmol/l total deoxyribonucleotide triphosphates (dNTP), 1x LC Green, and 1x Titanium Taq DNA polymerase. The primer concentrations were fixed at 1.0 μmol/l for PCR protocols while the blocker concentration was adjusted for the best performance from 0 to 5.0 μmol/l individually for each assay as discussed below. Template DNA of 50 ng per reaction is estimated to have ∼15,000 copies based on 3.3 pg/genome. Typically a single plate has four kinds of reactions with WT DNA only, 10–50% mutant representing a high load for positive control, 0.1% mutant representing our target assay sensitivity, and no template control (NTC).
PCR reactions were run on a CFX96 platform (Bio-Rad Laboratories, CA, USA) with only one fluorescence channel of SYBR/FAM detecting LC green fluorescence. We developed a unique PCR protocol, a modified three-step protocol, to facilitate assay sensitivity. Unlike the conventional three-step PCR, the modified three-step protocol has an additional annealing step at a higher temperature of 68°C for 10 s followed by a lower temperature annealing/extension step at 64°C for 10 s with a 95°C denaturing step for 5 s. The first annealing step was introduced to help anneal the blockers with templates before the primers, as discussed in more detail below. All the PCR reactions were performed with 45 cycles of this modified three-step PCR protocol in addition to the initial 30 s of hot start. Each run was accompanied by a melting analysis at the end to verify the PCR products. Melting analysis was performed only for the assay development purpose and is not required for the mutant/WT genotyping calls. To determine cycle of threshold (Ct) of the qPCR in a consistent manner, the threshold was set manually at 500 with the baseline setting of ‘Baseline subtracted curve fit’ in the Bio-Rad Laboratories CFX software. To check for the individual assay sensitivity and specificity, three 96-well plates were run totaling 24, 96, 96 and 72 reaction replicates of high-load mutant (10 or 100%), 0.1%, WT and NTC, respectively.
Results & discussion
With the completely new assay design concept of T-blocker described above, we have tested several conditions to study feasibility of selective amplification of the mutant DNA and efficient WT suppression. Several conventional two- and three-step PCR protocols with different step durations as well as titrations of Mg2+, primer, enzyme and dNTPs (data not shown) have been tested to achieve the largest Ct separation between WT and 0.1% mutant reactions. After several iterations, we observed that the PCR protocol played the most critical role in achieving 0.1% detection sensitivity in the case of the T-blocker assay. We started with a two-step PCR to simplify the protocol development process, but WT suppression was not readily established with an optimized annealing temperature alone. Thus, we considered a few other protocols and observed that introducing another annealing step at a slightly higher temperature before the second annealing step produced the best result in terms of WT suppression rate. It was inferred that the extra annealing step would help the blockers bind with the templates before the primers, which may suppress extension from the mispriming of the allele-specific primer with the WT template molecules. Based on this finding, two T-blocker assay principles were established and utilized, one in the assay design and the other in the PCR protocol. First, Tm of the blocker was adjusted significantly higher than the allele-specific primer by 6–11°C as seen in . Second, a new annealing step at 68°C was added before the second annealing/extension step to facilitate blocker hybridization before primer binding. shows sequences of the primers, blockers, and their Tm’s. For the BRAF V600E, we used the same allele-specific primer and reverse primer pair from Zhou et al.’s earlier work with a novel blocker [Citation21].
Table 1. Sequence of the primers, blockers and their melting temperatures.
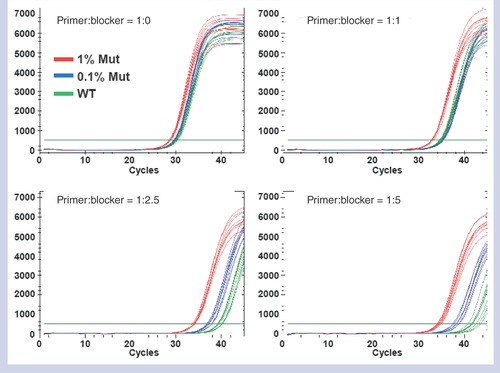
Once we finalized the PCR protocol, a number of candidate primers and blockers were studied to select the best performing allele-specific primer and blocker combination. Typically, 3–5 primer candidate oligonucleotides were tested that have different Tm’s, which composed 15–25 primer–blocker combinations. The first screening was done based on the performance of the WT suppression and minimum NTC activity without any mutant DNA. Any oligonucleotide combination that showed a high occurrence of Ct below 40 with WT DNA or NTC was rejected. The combinations that passed this first screening test were tested with 0.1% mutant DNA at a fixed ratio of 1:5 between allele-specific primers and blockers. One or two combinations were chosen that show the largest Ct separation between the 0.1% mutant and 100% WT reactions. In this test phase, we also considered the PCR efficiency in such a way that Ct of 0.1% reaction is well within 45 cycles. Once the best-performing combination at a fixed primer to blocker ratio (1:5) was identified, the ratio between the primer and the blocker was titrated as shown in (KRAS G12S). When there are only allele-specific primers without blockers, 1% mutant curves (red) are barely distinguishable from the WT curves (green) as seen in the top left panel of . As the blocker ratio increases, the separation between 0.1% mutant curves (blue) and WT curves becomes more pronounced and can clearly be distinguished when the ratio reaches 1:5 as seen in the bottom right panel. These data present clear supporting evidence that blockers are playing the strong WT suppression role expected from the T-blocker concept.
The separation of cycle of threshold (Ct) between 0.1% (blue curves) mutant and WT (green curves) reactions grows as blocker ratio increases. All the curves were acquired in a single run with eight replicates per case per sample. With the blocker titration result at a small scale as shown, another set of tests was run with a larger number of replicates with the two best performing blocker ratios to pick the best ratio. For the example of G12S assay shown above, only 1:2.5 and 1:5 ratios were run again with twice the number of replicates, which led to selecting the blocker ratio of 1:5 (data not shown). The primer to blocker ratios of the other three assays were optimized following the same procedure described above and the best ratios were determined to be 1:1, 1:2.5, and 1:2.5 for KRAS G12C, KRAS G12V and BRAF V600E assays, respectively.
WT: Wild-type.
Once the primer to blocker ratio was determined, an assay sensitivity test at 0.1% mutant frequency was executed by significantly increasing the number of replicates. For all four assays presented here, three 96-well plates were run to check the sensitivity of each assay, which included 96, 96, 24 and 72 replicates for 0.1% mutant, WT, 10% (or 100% for V600E) mutant, and NTC reactions, respectively, as shown below in More replicates were run for 0.1% mutant and WT cases since the assay sensitivity depends on the Ct separation between these two cases.
(A) Plate setup for sensitivity test that holds 8x 10% mutant, 32x 0.1% mutant, 32x wild-type and 24x NTC reactions. Three plates of this configuration were run per assay. (B) qPCR data from one of the three sensitivity plates for G12S showing a clear separation between 0.1% and wild-type reactions. The green horizontal straight line in the graph indicates the threshold universally set at 500. (C) Ct’s from all three sensitivity plates for G12S consolidated in a single graph to visualize the Ct cut-off to separate between 0.1% mutant and WT reactions achieving 100% sensitivity and 100% specificity. Note that any data point at the bottom of the graph indicates Ct was not detected until 45 cycles and that no NTC reactions registered any Ct’s.
Ct: Cycle of threshold; NTC: No template control.
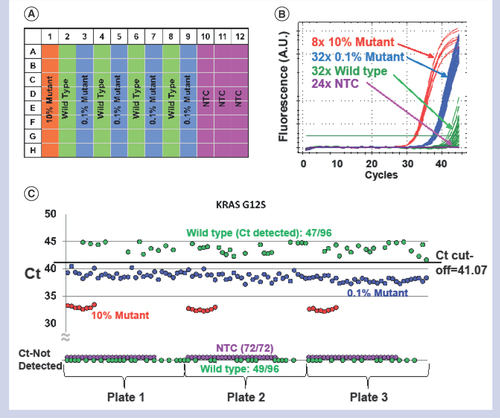
shows the qPCR data from the KRAS G12S assay as a representative for four assays presented in this work. includes all 96 qPCR curves from one of the three sensitivity plates, and it is very clear that 0.1% and WT curves are separated. All Ct’s from the three sensitivity plates are consolidated in a single graph shown in , visualizing that a single Ct cut-off at 41.07 (black dashed line) can be determined to achieve 100% sensitivity and specificity. The single cut-off was determined at a mid-point between the lowest Ct from WT reactions and the highest Ct from 0.1% reactions. This excellent assay accuracy at a mutant allelic frequency as low as 0.1% demonstrates the robustness of the T-blocker assay concept in two regards. First, the amplification of the mutant allele is highly selective and efficient such that the Ct spread at 0.1% allelic frequency is tight enough without overlapping with those from WT reactions. Second, the suppression of the WT amplification is also very effective such that the lowest Ct of the WT reactions is still more than 1 cycle higher than the highest Ct of 0.1% reactions. We were able to achieve comparable performance from the other three assays as presented in .
Table 2. 0.1% mutant sensitivity and specificity data of four assays developed in this work.
shows the sensitivity and specificity data from all four assays based on the above Ct cut-off criteria. Sensitivity considers only 0.1% mutant reactions and specificity considers only 96 WT reactions. All four assays were shown to achieve 100% sensitivity with 96 replicates collected from three different plates run by two operators. Moreover, we were able to concurrently achieve high specificity of 100% with 96 WT reactions except for the KRAS G12C assay, which had only one false-positive signal. On top of the high accuracy of individual assays, these data also support the excellent applicability of the T-blocker assay concept to broad assay targets.
All the DNA used in this work was genomic DNA extracted from cell lines. To verify the four assays presented here with clinical samples, our next step is to test with DNA extracted from blood plasma or formalin-fixed paraffin-embedded (FFPE) tissues that is expected to have smaller fragmentations than cell line DNA. In that case, a reference assay to quantify the amplifiable input DNA amount is expected to be necessary to compensate any quantification errors due to DNA degradation or fragmentation.
Compared with the assays presented in other works [Citation7,Citation8], T-blocker has a few advantages. It is much simpler to design using the intercalating dye-based chemistry since it does not need a separate labeled probe, as discussed above. Therefore, the initial screening effort to find the right combination of oligonucleotides (primer, blocker and probe) is greatly reduced. This advantage also reduces manufacturing cost by having one less component in the assay. The nonspecific amplification can be monitored by running a melting analysis at the end of the run, which we did for all experiments. However, this is only optional since we have demonstrated excellent assay accuracy without depending on the melting analysis in this work.
In conclusion, we have developed a novel T-blocker assay concept that can detect a rare DNA mutation in heterogeneous samples. We successfully demonstrated its applicability of detecting down to 0.1% allelic frequency in four different assays with a large number of replicates achieving 100% sensitivity and close to 100% specificity.
Author contributions
HK, HGS and AKV conceived and designed experiments. HK led the study and wrote the paper. AER and NR performed the experiments and analyzed the data. CMS reviewed the data. JH reviewed the data and the manuscript.
Acknowledgements
We greatly thank Samantha Guarino for assistance with comments and proof-reading of the manuscript.
Financial competing interests disclosure
The authors have no relevant affiliations or financial involvement with any organization or entity with a financial interest in or financial conflict with the subject matter or materials discussed in the manuscript. This includes employment, consultancies, honoraria, stock ownership or options, expert testimony, grants or patents received or pending, or royalties.
No writing assistance was utilized in the production of this manuscript.
References
- Gerber DE , GandhiL, CostaDB. Management and future directions in non-small cell lung cancer with known activating mutations. Am. Soc. Clin. Oncol. Educ. Booke353–e365 (2014).
- Gonzalez de Castro D , ClarkePA, Al-LazikaniB, WorkmanP. Personalized cancer medicine: molecular diagnostics, predictive biomarkers, and drug resistance. Clin. Pharmacol. Ther.93, 252–259 (2013).
- Kalia M . Personalized oncology: recent advances and future challenges. Metabolism62(Suppl. 1), S11–S14 (2013).
- Normanno N , RachiglioAM, RomaCet al. Molecular diagnostics and personalized medicine in oncology: challenges and opportunities. J. Cell Biochem.114, 514–524 (2013).
- Newton CR , GrahamA, HeptinstallLEet al. Analysis of any point mutation in DNA. The amplification refractory mutation system (ARMS). Nucleic Acids Res.17, 2503–2516 (1989).
- Bolton L , ReimanA, LucasK, TimmsJ, CreeIA. KRAS mutation analysis by PCR: a comparison of two methods. PLoS One10, e0115672 (2015).
- Morlan J , BakerJ, SinicropiD. Mutation detection by real-time PCR: a simple, robust and highly selective method. PLoS One4, e4584 (2009).
- Wang H , JiangJ, MostertBet al. Allele-specific, non-extendable primer blocker PCR (AS-NEPB-PCR) for DNA mutation detection in cancer. J. Mol. Diagn.15, 62–69 (2013).
- Pender A , Garcia-MurillasI, RanaSet al. Efficient genotyping of KRAS mutant non-small cell lung cancer using a multiplexed droplet digital PCR approach. PLoS One10, e0139074 (2015).
- Wood-Bouwens C , LauBT, HandyCM, LeeH, JiHP. Single-color digital PCR provides high-performance detection of cancer mutations from circulating DNA. J. Mol. Diagn.19, 697–710 (2017).
- Andreyev HJ , NormanAR, CunninghmaDet al. Kirsten ras mutations in patients with colorectal cancer: the ‘RASCAL II’ study. Br. J. Cancer85, 692–696 (2001).
- Bos JL , FearonER, HamiltonSRet al. Prevalence of ras gene mutations in human colorectal cancers. Nature327, 293–297 (1987).
- Davies H , BignellGR, CoxCet al. Mutations of the BRAF gene in human cancer. Nature417, 949–954 (2002).
- Lang AH , DrexelH, Geller-RhombergSet al. Optimized allele-specific real-time PCR assays for the detection of common mutations in KRAS and BRAF. J. Mol. Diagn.13, 23–28 (2011).
- Orue A , RieberM. Optimized multiplex detection of 7 KRAS mutations by Taqman allele-specific qPCR. PLoS One11, e0163070 (2016).
- Li T , KungHJ, MackPC, GandaraDR. Genotyping and genomic profiling of non-small-cell lung cancer: implications for current and future therapies. J. Clin. Oncol.31, 1039–1049 (2013).
- Pao W , GirardN. New driver mutations in non-small-cell lung cancer. Lancet Oncol.12, 175–180 (2011).
- Jeong D , JeongY, LeeSet al. Detection of BRAF(V600E) mutations in papillary thyroid carcinomas by peptide nucleic acid clamp real-time PCR: a comparison with direct sequencing. Korean J. Pathol.46, 61–67 (2012).
- Satow R , HiranoT, BatoriR, NakamuraT, MurayamaY, FukamiK. Phospholipase Cδ1 induces E-cadherin expression and suppresses malignancy in colorectal cancer cells. Proc. Natl Acad. Sci. USA111, 13505–13510 (2014).
- Dames S , PattisonDC, BromleyLK, WittwerCT, VoelkerdingKV. Unlabeled probes for the detection and typing of herpes simplex virus. Clin. Chem.53, 1847–54 (2007).
- Zhou L , WangY, WittwerCT. Rare allele enrichment and detection by allele-specific PCR, competitive probe blocking, and melting analysis. Biotechniques50, 311–316 (2011).

