

Abstract
Alfie Gleeson and Abigail Sawyer explore the latest advances in high-throughput sequencing for neuroscience on the quest to map out the brain.
High-throughput sequencing technology has enabled research centers across the globe to begin mapping neural connections and deciphering neural wiring circuits. From huge initiatives in the USA to smaller, but no less important research groups in Europe, the quest to map the brain is becoming a worldwide research goal.

In 2016, the USA government’s IARPA branch launched the MICrONS (machine intelligence from cortical networks) project, a US$100 million initiative that was to seek to revolutionize machine learning by reverse-engineering the brain [Citation1]. This is considered a moonshot effort; the research teams involved will attempt to understand and map the structure and function of every piece of neural wiring of a 1 mm3 section of rodent brain.
This huge effort sees three different research groups follow their own 5-year devised approaches and includes teams such as that led by David Cox of Harvard University (MA, USA). Cox’s approach involves utilization of electron micrographs to build a 3D map of actual neural connections.
The second team is led jointly by Andreas Tolias of Baylor University (TX, USA), Clay Reid of the Allen Institute for Brain Science (WA, USA) and Sebastian Seung of Princeton University (NJ, USA). Their approach is data-driven and is heavily reliant on artificial intelligence. They have already mapped connections between 11,000 neuronal pairs and discovered five new types of neurons [Citation2].
The final team is led jointly by Tai Sing Lee and George Church of Carnegie Mellon (PA, USA) and the Wyss Institute for Biologically Inspired Engineering at Harvard University, respectively [Citation3]. They are approaching the project using barcoding, aiming to assign each neuron with a barcode constructed from nucleotides, which then enables the mapping of neurons and synaptic connections.
Famed geneticist and molecular engineer Church is one of the founders of the BRAIN Initiative (2011), a lasting legacy of the Obama administration. The initiative “seeks to deepen understanding of the inner workings of the human mind and to improve how we treat, prevent and cure disorders of the brain” by developing new technologies to explore how brain cells interact. On its launch, the MICrONS project – part of the BRAIN Initiative – was described as the “Apollo project of the brain” [Citation4] due to its ambitious and innovative nature.
Much of the focus of the MICrONS project is on the development of new data collection technologies, including faster scanning techniques. Neuroscientist Tony Zador, of Cold Spring Harbor Laboratory (CSHL; NY, USA), devised a theory for ‘barcoding’ the brain – labeling each neuron with a unique barcode in order to visualize them in greater detail [Citation5].
In the beginning
Zador’s initial idea for building a map of synaptic connections in the brain by barcoding began with utilizing random series of 30 nucleotides to provide each neuron with a unique RNA barcode. He then believed it would be possible to create maps of their connections using high-throughput sequencing technologies.
This technique was named BOINC (barcoding of individual neuronal connections) and, in theory, a complete map of neural connections can be produced, representing the exact locations and shapes of all neurons. This method was to be combined with a fluorescent in-situ sequencing (FISSEQ) method developed by Church and colleagues at the Wyss Institute [Citation6].
FISSEQ can sequence the barcodes and pinpoint their locations utilizing super-resolution microscopy. FISSEQ can be applied to intact brain tissue, avoiding the need to section the brain and speeding up the process of mapping longer neuronal processes.
Barcoding the brain
Zador and his team have since developed a novel method, MAPseq (multiplexed analysis of projections by sequencing), which utilizes RNA barcodes that travel through the brain and are then sequenced using high-throughput technology to identify neural projection patterns [Citation7].
Current mapping techniques are costly and time consuming. MAPseq allows researchers to trace the projections of large numbers of individual neurons from their origins to specific brain regions in a single experiment. This technique differs from other similar mapping projects in that it relies on high-throughput RNA sequencing to identify neural wiring patterns. For the first time, MAPseq converts the task of brain mapping into one of RNA sequencing.
“The RNA sequences, or ‘barcodes’, that we deliver to individual neurons are unmistakably unique. This enables us to determine if individual neurons, as opposed to entire regions, are tailored to specific targets”, explained lead author, Zador.
MAPseq differs from traditional fluorescent protein marker-based methods in that it is able to resolve a neuron’s axonal destination, by determining if any two given neurons project wholly or partially to the same or different regions of the brain.
Zador uses the analogy of trying to catch a flight to Germany at an international airport in order to explain how MAPseq differs to so-called ‘bulk tracing’ methods:
“If you go to the international terminal, you see a long line of ticket counters. If you want to go to Germany, it’s not enough to take any airline at the international terminal. If you stand in line at the counter for Air Chile, you’re probably not going to be able to buy a ticket for Germany.”
“Those many airlines whose counters are adjacent serve many destinations, some of which overlap, some of which are unique. You can print out a map showing all of the foreign countries that all of the airlines serve from your airport, but that doesn’t tell you anything at all about individual airlines and where they go. This is the difference between current labeling methods and MAPseq. The ‘individual airlines’ in my example are adjacent neurons in a part of the brain whose ‘routes’ we want to trace”.
In the MAPseq method, a single injection to the brain administers the RNA barcodes. The injection consists of a deactivated viral library, which contains masses of random unique RNA sequences, or barcodes. Each barcode, consisting of a 30 bp sequence, is bound to a protein designed to travel along axonal pathways. Once injected into the target brain region, each individual barcode is taken up randomly by an individual neuron.
The barcodes travel evenly throughout the brain region along the axons to the terminal synapses. Once the barcodes have had time to travel throughout the region, the brain is dissected and sequenced. This reveals where the RNA sequences have travelled to from the source area.
“Sequencing the RNA is a highly efficient, automated process, which makes MAPseq such a potentially radical tool. In addition to the speed and economy of RNA sequencing, it has the great advantage of making it possible for researchers to distinguish between individual neurons within the same region that project to different parts of the brain”, commented co-author, Justus Kebschull.
The team performed an experiment to demonstrate the abilities of MAPseq. They investigated noradrenaline, a hormone that signals surprise, by injecting their RNA barcodes into the source of the hormone, the locus coeruleus (LC), in the brain stem. They tried to determine where the ‘surprise’ signal was broadcast to in the brain cortex of a mouse; was it the whole area or just relevant places?
“We found that neurons in the LC have a variety of idiosyncratic projection patterns. Some neurons project almost exclusively to a single preferred target in the cortex or olfactory bulb. Other neurons project more broadly, although weakly”, said Zador.
He added that the results were “consistent with, and reconcile, previous seemingly contradictory results about LC projections.” The signal was particularly focused in specific areas of the brain, although it could be found all over the brain in smaller concentrations.
Zador is confident that this technique can increase the efficiency of mapping studies by reducing time, costs and the use of multiple animals. “Once we automate the process of using many injections, we think this kind of experiment can be completed by a single person in just a week or two, and at a cost of only a few thousand dollars”, he explained.
“We are very keen on being able to do these kind of studies in a single animal, which will eliminate the past problem of injecting multiple animals to trace multiple neurons, a method that requires one to make a single map based on many brains, each of which is somewhat different”.
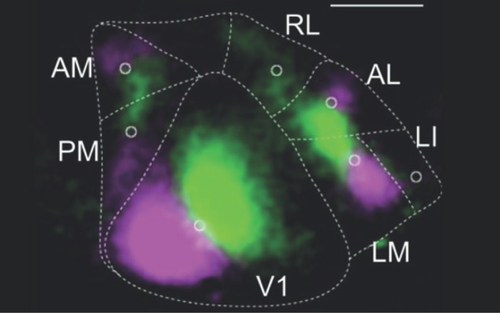
By barcoding 591 neurons in this region, the team used MAPseq to discover patterns of their projections to nearby higher visual cortical areas. Each of the latter is identified in this calibration image, which registers the brain’s reaction to two different kinds of visual stimuli (registering in pink and green fluorescence).
Credit: Zador Lab, CSHL.
A global initiative
A more recent development sees Kebschull and Zador work as part of an international team of scientists from Sainsbury Wellcome Centre for Neural Circuits and Behaviour (London, UK), Biozentrum of the University of Basel (Switzerland) and CSHL, utilizing MAPseq as part of an effort to trace neural projections from the visual cortex [Citation8].
The study, published in Nature, is an exciting development of our current understanding of neural communication and has the potential to overturn traditionally held views. The team discovered that cells from this region project to a wider range of destinations than previously thought, and that the destinations are not random – suggesting that there is higher order logic behind how neurons project information.
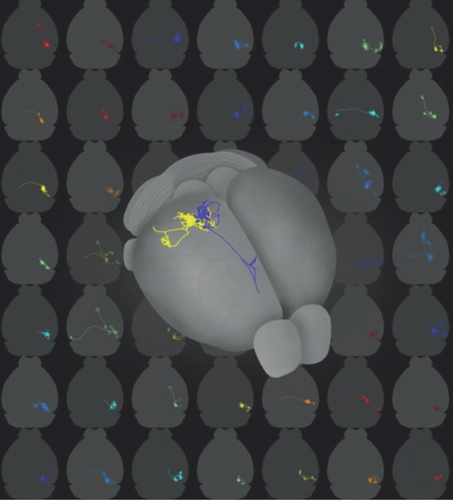
Each panel in the background shows the traced axon of a single neuron from the upper layers of primary visual cortex. The gray outlines are the brain borders. The foreground brain contains two traced cells overlaid in different colors.
Credit: Sainsbury Wellcome Centre.
Classically, models of the visual system have shown information flow from the primary visual cortex to more specialized areas that perform required functions, such as image forming and movement. However, the mechanisms of how the individual cells carry this information are poorly understood.
“Understanding the fine-scale anatomy by which individual neurons distribute signals to their targets is a crucial step for forging the relationship between neuronal structure and function”, explained senior author, Tom Mrsic-Flogel.
In order to achieve their results, the team utilized two complementary methods to map the projection pattern in mice; whole-brain fluorescence-based axonal tracing and whole-brain serial two-photon tomography.
This allowed them to label the neurons with the first method and then image the projections with the second. They then used the Allen Mouse Brain Reference Atlas to identify the areas in which axonal terminations were observed. The projections of the primary visual cortex neurons were found to be diverse and most of the neurons distributed information to multiple areas.
“Our findings reveal that individual neurons in the visual cortex project to several targets in the neocortex. This means that their signals are distributed widely and that individual neurons contribute to multiple parallel computations across the neocortex”, commented Kebschull.
To establish if the projections were targeted or random, the team needed to look to a wider range of neurons. MAPseq is capable of labeling 100–200 neurons in a single experiment and is an incredibly efficient method for analyzing larger numbers of neurons.
The results showed that the majority of neurons project to targeted, and not random, areas. Zador found the results to be somewhat surprising. Whilst he expected that there would be some specific projection patterns from these neurons in the visual cortex, the patterns were actually highly diverse.
The team is now working to make sense of what this structure means, hypothesizing that the activity a subject is performing could have an effect on how the brain directs information.
MAPseq: a new gold standard?
As a result of this study, the researchers also solidified the effectiveness of MAPseq by comparing it to the current gold standard of brain mapping, single neuron tracing.
Kebschull believes understanding this fundamental neural wiring network is crucial to further research. “If we don’t know how information is combined even at the earliest stages, then we have essentially no shot of figuring out how the brain works.”
The team verified their method against single-cell neuron tracing by performing both sets of experiments. It took the team 3 years to map 31 mouse neurons to seven locations from the primary visual cortex using single neuron tracing. Conversely, it took the team only 3 weeks to map 591 neurons from the visual cortex using MAPseq, with both methods reaching similar conclusions. They revealed that most neurons target multiple visual areas. However, this extraordinary increase in results really demonstrates the efficiency of the technique.
MAPseq was also able to reveal more complex patterns than the other technique. It revealed that 73% of neurons fit into one of six projection patterns connecting the primary visual cortex to other visual areas of the cortex. This wiring structure could help to facilitate activity coordination in the visual cortex, providing links between visual information and complex perception.
Kebschull believes these findings will help neuroscientists move away from traditionally held views on brain connectivity. “Our finding signals a shift away from the rather convenient idea of every neuron projecting to just one cortical area. That thinking ignores the underlying structure of the brain, and in the future, the way people do their experiments is going to change drastically”, he concluded.
Conclusion
As the MICrONs project’s three different approaches are all making headway towards the end goal, we ask the question; is high-throughput sequencing the answer? The improvements of high-throughput sequencing technologies, especially the efforts of Zador and colleagues, are already showing some incredibly promising results in the form of MAPseq and look to overhaul currently held views in neuroscience.
MAPseq has shown it can process hundreds of barcodes in weeks, but can it be improved upon? On the horizon is BARseq – the latest product of Zador’s group – and whose authors believe could provide unprecedented insight as to the structure and function of a neural circuit.
BARseq brings together high-throughput sequencing with microscopy. MAPseq requires segments of brain tissue to be destroyed, whilst BARseq can be utilized on whole slices of brain tissue, preserving important anatomical information. In BARseq, a color-coded version of the barcode is sequenced, with the potential to process between 1000 and 3000 neurons in just 2 weeks [Citation9].
The MICrONs project is certainly accelerating the continual development of new and improved technologies for better understanding of the brain. We must now wait in anticipation to see what the final results will bring.
References
- www.iarpa.gov/index.php/research-programs/microns.
- www.quantamagazine.org/mapping-the-brain-to-build-better-machines-20160406/.
- www.technologyreview.com/s/609070/inside-the-moonshot-effort-to-finally-figure-out-the-brain/.
- www.scientificamerican.com/article/the-u-s-government-launches-a-100-million-apollo-project-of-the-brain/.
- http://science.sciencemag.org/content/351/6275/799.
- https://wyss.harvard.edu/wyss-institute-will-lead-iarpa-funded-brain-mapping-consortium/.
- Kebschull JM , Garcia da SilvaP, ReidAP, PeikonID, AlbeanuDF, ZadorAM. High-throughput mapping of single neuron projections by sequencing of barcoded RNA. Neuron doi:10.1016/j.neuron.2016.07.036 (2016).
- Han Y , KebschullJM, CampbellRAAet al. The logic of single-cell projections from visual cortex. Nature556, 51–56 (2018).
- Chen X , KebschullJM, ZhanH, SunY, ZadorAM. High-throughput mapping of long-range neuronal projection using in situ sequencing. bioRxiv preprints doi:10.1101/294637 (2018).

