

Abstract
New technologies have powered rapid advances in cellular imaging, genomics and phenotypic analysis in life sciences. However, most of these methods operate at sample population levels and provide statistical averages of aggregated data that fail to capture single-cell heterogeneity, complicating drug discovery and development. Here we demonstrate a new single-cell approach based on convex lens-induced confinement (CLiC) microscopy. We validated CLiC on yeast cells, demonstrating subcellular localization with an enhanced signal-to-noise and fluorescent signal detection sensitivity compared with traditional imaging. In the live-cell CLiC assay, cellular proliferation times were consistent with flask culture. Using methotrexate, we provide drug response data showing a fivefold cell size increase following drug exposure. Taken together, CLiC enables high-quality imaging of single-cell drug response and proliferation for extended observation periods.
Method Summary
In this study, we use convex lens-induced confinement (CLiC) microscopy, which was originally developed for the study of single particles and biomolecules, and apply it to live cell imaging to detect fluorescently labeled cell compartments and compare the system to conventional imaging. We also performed an extended duration live-cell assay in CLiC by confining Saccharomyces cerevisiae yeast cells in well-defined pits in a flow cell and observing single-cell proliferation for 8 h. Finally, we assessed the effects of the antifolate drug methotrexate on cell morphology and mitochondria integrity by observing cells during drug exposure.
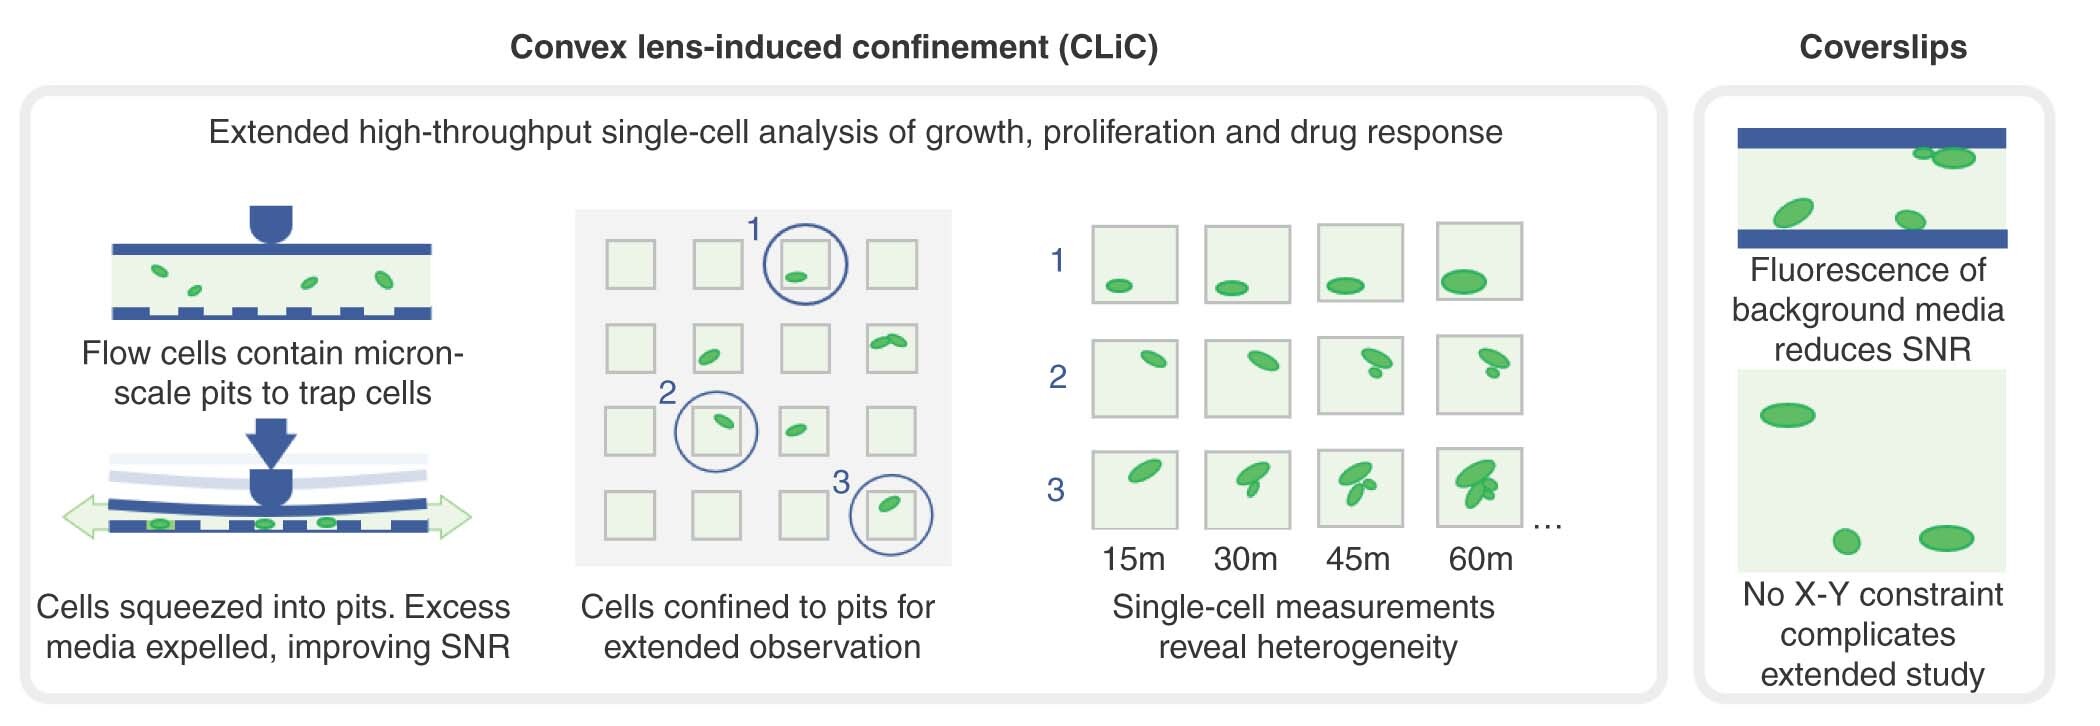
Graphical Abstract
One of the driving forces in systems biology research is the emergence and development of new data-acquisition tools and technologies to better understand biological and biochemical mechanisms at the single-cell level. At present, most practical molecular and cell biology methods capture the average response of a cell sample population. However, results from these approaches can be misleading due to cellular heterogeneity. Such variation may arise from diverse genetic and nongenetic factors, including noise in gene expression. Factors that substantially define the amplitude of such noise include regulatory dynamics, transcription rates, genetic factors and intracellular copy numbers of molecules involved in the genetic network [Citation1].
Single-cell heterogeneity is indeed a well-known phenomenon in microbial resistance and evolution studies, as well as in cancer research. For instance, most cancer cell lines display genomic alterations, as well as other forms of heterogeneity such as chromosomal instability [Citation1,Citation2]. Stochastic cellular process fluctuations, including the state, location, activity and concentration of polymerases, transcription factors and gene expression regulators, may also lead to diversification in an initially uniform cell population [Citation3]. These variations can have a significant impact on the growth and environmental stress response of cells and cannot be captured using conventional cell biology methods. For instance, conducting a drug response analysis in yeast often requires recording its optical density (OD600 nm) at set time intervals over time. However, the recorded data are a bulk representation of the entire population and, as a consequence, may overlook fluctuations at the individual cell level that could lead to drug resistance [Citation4].
The awareness of cell population heterogeneity and the importance of characterizing it have led to the emergence of a number of single-cell analysis tools such as fluorescence-activated cell sorting, microfluidic lab-on-a-chip and cellular microarrays. Microfluidics are a powerful, relatively recent innovation that are being applied for rapid antibiotic and antifungal susceptibility testing at a single-cell level, which can allow one to determine an isolate's drug susceptibility in less than 30 min [Citation5,Citation6]. A range of antibiotic and antifungal drugs (e.g., penicillins such as mecillinam, amoxicillin-clavulate ampicillin, sulfamethoxazole, and so on) have been investigated using microfluidic lab-on-a-chip, and the results emphasize the utility of this technique to identify individual cells that maintain their fast growth rate against a background of drug susceptible cells [Citation5]. The impact of single-cell analysis techniques on drug discovery and drug resistance studies in recent years underscores the clear need for more techniques that are robust in capturing not only the cell-to-cell variations, but also to chart their real-time proliferation and the evolution of the same individual cells for long periods.
Here we introduce a novel approach for single-cell studies using the convex lens-induced confinement (CLiC) instrument [Citation7] combined with flow cells containing embedded pits. CLiC is an imaging system that was primarily developed for the isolation and visualization of single molecules in a flow cell made of two glass layers (A & B). The principle of CLiC is as follows: using a lens-rod perpendicular to the focal plane, pressure is applied downward directly onto the flow cell. The resulting deformation of the flow cell confines molecules between the smooth glass surfaces and can load them into features such as pits, which are embedded in the surfaces (B) [Citation8,Citation9]. This technique had been shown to be able to successfully confine and isolate diffusing [Citation5] and interacting molecules [Citation10–12] for long periods and improve fluorescent signal detection [Citation7]. To date, CLiC has primarily been used to study materials, biomolecules and particles, with only limited information available regarding its suitability for live-cell investigations [Citation13].
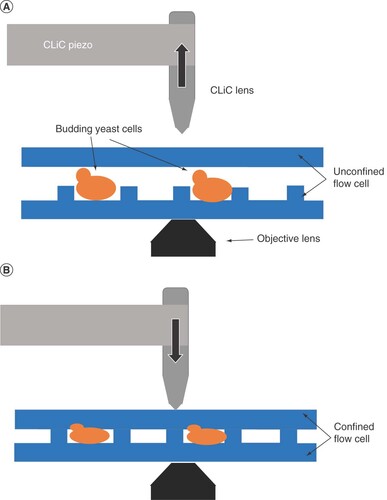
(A) Representative schema of the CLiC instrument with yeast cells loaded into the unconfined flow cell that contains embedded pits. (B) Schematic representation of the CLiC instrument with the lens rod moving downward to confine the yeast cells into the flow cell pits.
CLiC: Convex lens-induced confinement.
In this study, we used the yeast Saccharomyces cerevisiae, which is a well-known and extensively studied model organism used in the investigation of diverse eukaryotic cell biology. The insights gained from yeast are simplified but can be extrapolated into mammalian systems. Due to the high degree of conservation existing between yeast and mammalian genes (over 50% for essential genes), yeast is often used to understand the mechanisms of action of small molecules and drugs and to acquire preliminary data for drug discovery efforts [Citation14–16]. Additional advantageous criteria make yeast an ideal model organism to benchmark the CLiC cell assay. These criteria include: its low level of genomic instability compared with cultured cells, its simple and low-cost growth requirements, and its short doubling time, which allows faster drug effects and pathway perturbation assessment. We therefore used yeast to validate the CLiC instrument for single-cell analyses, specifically comparing the CLiC imaging platform to a conventional microscope slide for fluorescent cell imaging, drug response studies and cell-proliferation observations.
Materials & methods
Yeast cell propagation & staining
For localization experiments with fluorescent probes, we used BY4743 diploid cells (MATa/MATα his3Δ1/his3Δ1 leu2Δ0/leu2Δ0 lys2Δ0/+ met15Δ0/+ ura3Δ0/ura3Δ0) generated from a cross between BY4741 and BY4742 [Citation17].
Vacuolar staining
We inoculated BY4743 cells in 3 ml YPD media and grew them overnight (∼16 h) at 30°C. We subsequently adjusted the cell suspension to an OD600 nm of 10, added 4 μM FM4–64 vacuolar stain in YPD and incubated on an interval mixer for 30 min at 30°C. We then removed the excess probe by centrifuging cells at 500×g for 1 min, aspirating the supernatant and washing cells twice in YPD before suspending in 1 ml YPD.
Nuclear DNA live cell staining
We stained BY4743 cells in mid-log phase with an OD600 nm of 0.5 using 2.5 μg/ml final concentration of 4′,6-diamidino-2-phenylindole (DAPI) on an interval mixer for 30 min at 30°C. We then harvested the cell pellet by centrifugation at 500×g for 1 min, washed with 1× phosphate-buffered saline and resuspended in YPD for a final OD600 nm of approximately 10.
Mitochondrial staining
Upon treatment of BY4743 cells with 2 mM methotrexate or 2% dimethyl sulfoxide (DMSO) as a vehicle control for 20 h, we pelleted and resuspended cells in prewarmed (30°C) staining solution containing YPD media and 200 nM Mitotracker Red CMXRos. We subsequently incubated the cells at 30°C with shaking for 30 min in a thermomixer, pelleted and resuspended them in fresh YPD media prewarmed at 30°C.
Convex lens-induced confinement
The CLiC instrument is composed of five major components assembled to allow confinement of single molecules or cells into embedded wells in the CLiC flow cell, which we refer to in this paper as pits. (i) The first component is a mounting stage that perfectly fits into an inverted microscope's main stage. (ii) The second component is a mounting chuck that holds the flow cell, enables fluid exchange and is inserted onto the mounting stage. (iii) The third and main part is the flow cell made of two thin glass coverslips. The bottom coverslip contains embedded wells and is attached to the upper flat coverslip by a 30-μm thick double-sided adhesive [Citation11]. Cell samples can be loaded between the two layers through a fluidic access port. (iv) The fourth component is a piezo, which controls the y-axis of the lens rod. (v) Last is the lens-rod, which consists of a convex lens, mounted curved-side down, on a narrow rod. When lowered, the lens-rod pushes on the top coverslip, deforming it downward, which consequently restrains cells into the embedded wells. This instrument does not tether or stick down cells, but simply confines them. Cells can then be imaged following the microscope's standard protocols.
Wide-field microscopy
Image acquisition on microscope slide & processing
We used a 63× 1.4 NA oil-immersion objective mounted on a Zeiss (Oberkochen, Germany) Axiovert 200 m microscope, an Excelitas (MA, USA) X-Cite 120 LED light source and a Zeiss AxioCam HRm Rev.2 camera to capture images of cells in brightfield channel exposed for 10 ms under 4.0-V transmitted light. We used excitation and emission filters appropriate for FM4–64 (Cy3, excitation/emission: 515/640 nm), DAPI (excitation/emission: 359/461 nm) and Mitotracker Red (Cy3, excitation/emission: 579/603 nm) with 830 ms, 125 ms and 150 ms of exposure, respectively. Images were captured using the multi-dimensional acquisition setting on the AxioVision 4.8.2 software (Zeiss).
Image acquisition in flow cell & processing
For cell imaging using the Scopesys (QC, Canada) CLiC instrument, we loaded 5 μl of the stained cell suspension into the flow cell-containing embedded pits and imaged with the 63× oil-immersion objective as described above. We captured images in the brightfield channel using 100 ms exposure under 11.0 V transmitted light and in the DAPI or Cy3 fluorescent channels with acquisition settings identical to those used for imaging cells on a microscope slide.
Microscopy image analysis & fluorescent signal quantification
ImageJ software (with the Fiji plugin) was used to measure the ‘area’, ‘integrated intensity’ and ‘mean gray value’ of fluorescent cells [Citation18,Citation19]. We first selected the regions of interest (ROI) delineating every single cell on channel 1 (brightfield-transmitted channel) and subsequently performed fluorescent signal measurements on channel 2 (fluorescent channel). For normalization, we measured an empty background area on the field of view and determined the corrected total cell fluorescence (CTCF) using the following formula:
Cell proliferation under flask versus flow cell platform
For the growth comparison experiment, we used the dfr1/DFR1 heterozygous deletion strain, derived from BY4743 [Citation20]. This strain is deleted for a single copy of the enzyme dihydrofolate reductase, which is the established target of methotrexate [Citation21].
Yeast growth in flasks
We propagated a cell suspension, characterized by an optical density measured at 600 nm (OD600 nm) of 0.25, in 50 ml YPD in a flask at 30°C for three generations, and performed readings with an Eppendorf (Hamburg, Germany) Biophotometer every 15 min.
Yeast growth in flow cell
We loaded 5 μl of a cell suspension with an OD600 nm of 5 into a flow cell, and grew the cells at 30°C. To monitor and control the temperature of the flow cell environment, we used a silicon heat tracing cable and temperature sensor wrapped around the 63× oil-immersion objective. The Zeiss Axiovert 200 m microscope captured images of proliferating cells every 15 min for 8 h.
Viability assay
To prepare the samples for the spot assay, we grew BY4743 cells in the presence of 2.0, 1.0, 0.5 or 0.25 mM methotrexate, or 2% DMSO vehicle control for 20 h, normalized them to an OD600 nm of 1 and transferred them to a 96-well plate. We subsequently performed fivefold serial dilutions on each sample, spotted them onto YPD agar by transferring 5 μl of each suspension, and grew the cells at 30°C for 48 h prior to image acquisition.
Results & discussion
Fluorescent signal detection comparison in flow cell versus microscope slide
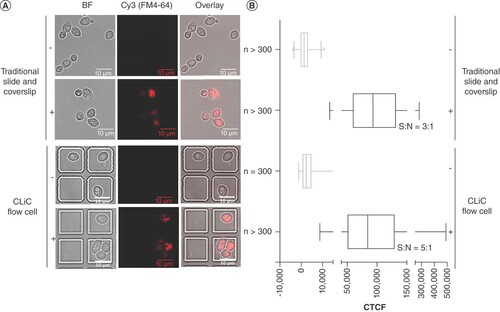
To study the ability to obtain fluorescent signals from live cells on the CLiC instrument and compare the data to that obtained from conventional microscope slides, we captured images of BY4743 cells stained with 4-μM FM4–64 vacuolar rim stain on a microscope slide and a CLiC flow cell under similar fluorescent settings. An unstained BY4743 negative control sample was also analyzed. Both platforms detected fluorescent signals consistent with vacuolar rims in stained cells (A). From visual inspection, the CLiC instrument captured the stained vacuolar rims with high contrast. Quantitatively, the average signal-to-noise ratio with CLiC was enhanced compared with the microscope slide, 5:1 versus 3:1, respectively (B). The CTCF distribution of the stained samples on the two platforms were not significantly different; however, the distribution obtained with CLiC extended over a larger dynamic range of signals, highlighting the CLiC ability to detect higher signals (B).
(A) Representative images of BY4743 unstained (-) or stained with FM4-64 vacuolar stain (+) and captured under a traditional microscope slide or when confined in the CLiC flow cell. Imaging performed under BF channel and fluorescent channel (Cy3, FM4-64). (B) Box and Whisker plot of corrected total cell fluorescence distribution for n ≥ 300 cells per condition.
BF: Brightfield; CLiC: Convex lens-induced confinement; CTCF: Corrected total cell fluorescence; S:N: Signal-to-noise ratio.
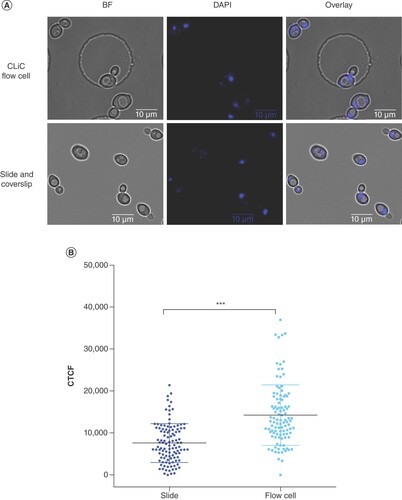
Signal detection of cells stained with 2.5 μg/ml DAPI for 30 min also demonstrated signal detection sensitivity differences between the CLiC flow cell versus the microscope slide. The average integrated fluorescence per stained cell was 10,517 for n = 110 cells visualized on a microscope slide compared with 17,192 for n = 104 cells imaged under confinement with CLiC. Under a student's two-tailed t-test, assuming equal variances between the samples, the distribution of signals was significantly higher in CLiC flow cells (p < 0.05) (A & B).
(A) DAPI-stained BY4743 cells captured under BF and fluorescent (DAPI) channels. Imaging performed under flow cell confinement (top) and on a microscope slide (bottom). (B) Column scatter plot of CTCF of n ≈ 100 cells per condition. Image displays individual data (blue markers), their average (black horizontal lines) and standard deviation (blue error bars) for each condition.
***p < 0.05 under an unpaired two-tailed t-test.
BF: Brightfield; CLiC: Convex lens-induced confinement; CTCF: Corrected total cell fluorescence; DAPI: 4′,6-diamidino-2-phenylindole.
The fluorescence signal detection comparison validated the ability of the CLiC instrument to image cellular compartments with high resolution and precision (A & A). Additionally, DAPI fluorescent signal detection was greater with increased sensitivity in CLiC flow cells compared with microscope slides. This higher sensitivity could be explained by the decrease in the vertical volume of the cells when squeezed, allowing higher background signal rejection and better fluorophore detection [Citation8].
Methotrexate effect on yeast in flow cells
After validating that the CLiC instrument was suitable for fluorescence imaging, this platform was used to study the effect of the antifolate drug methotrexate, a dihydrofolate reductase inhibitor, on BY4743 cells [Citation21]. In yeast, the dihydrofolate reductase enzyme is encoded by DFR1 and is required for tetrahydrofolate biosynthesis. This enzyme is functionally conserved between yeast and human cells; that is, the viability and antifolate resistance of a yeast dfr1 mutant can be rescued by expression of the human enzyme DHFR [Citation20]. Inhibition by methotrexate results in fitness defects of yeast cells, which is likely due to the adverse effects of the drug on nucleic acid and amino acid biosynthesis [Citation21]. Dfr1 has previously been reported to be necessary for mitochondrial morphology maintenance in the presence of 10 μg/ml doxycycline [Citation22]. We therefore hypothesized that inhibiting Dfr1 with methotrexate would have an impact on the mitochondrial structure of the cells.
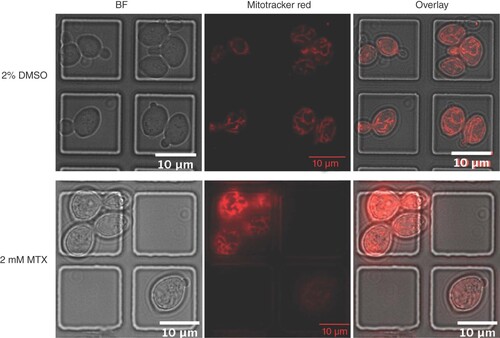
BY4743 cells treated with 2.0 mM methotrexate for 20 h showed no major mitochondrial structural damage based on observations of Mitotracker Red stained cells (). Methotrexate treatment did, however, result in a drastic morphology change in BY4743 cells. Treated cells were almost fivefold larger in volume than the 2% DMSO-treated cells, with an average volume ± SEM of 900.8 ± 35.41 μm3 (n = 100) compared with 185.9 ± 8.168 μm3 (n = 100), respectively. Most strikingly, methotrexate had a pronounced effect on cell cycle progression. When assayed for budding index [Citation23], we found a 1.36-fold increase in the population budding index of n ≈ 200 treated cells (87%) compared with the DMSO-treated control (64%) (A & B). When treated with methotrexate, 73% of the cell population was found in the telophase/anaphase stage of the cell cycle compared with 16% for the DMSO-treated control, suggesting that methotrexate either caused mitotic arrest or delayed mitotic exit [Citation24].
mitotracker stained BY4743 cells treated for 20 h with 2% DMSO vehicle control (top) or 2 mM methotrexate (bottom) and captured in flow cells under BF and Cy3 Fluorescent (Mitotracker Red™) channels.
BF: Brightfield; DMSO: Dimethyl sulfoxide; MTX: Methotrexate.
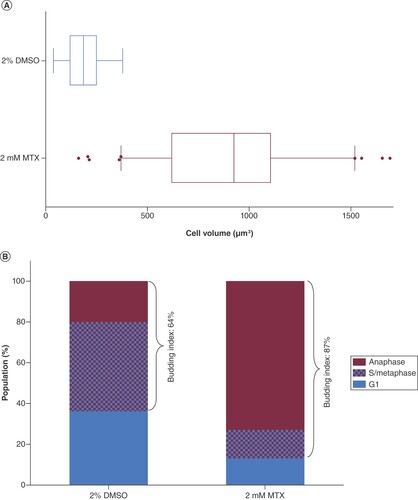
(A) Box and Whisker plot representation of the cell volume distribution of n = 100 BY4743 cells treated for 20 h with 2 mM MTX versus the control treated with 2% DMSO. (B) Population percentage of cells in anaphase, S/metaphase and G1 phase of the cell cycle and the deduced budding indices of MTX- versus DMSO-treated cells.
DMSO: Dimethyl sulfoxide; MTX: Methotrexate.
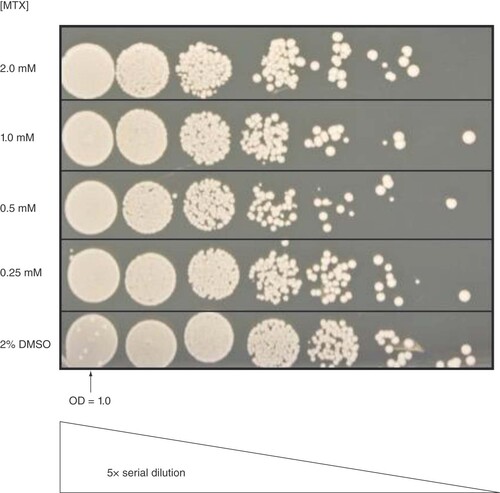
To further investigate methotrexate's effect on BY4743 cell viability, cells treated with 2.0 mM methotrexate for 20 h were spotted onto YPD agar for 48 h. To our surprise, despite their dramatic morphology change, budding alterations and growth inhibition (, A & B), methotrexate treatment did not exhibit a major impact on the cell viability following recovery on YPD in the absence of methotrexate (). This observation suggests that methotrexate is cytostatic and not cytocidal under the conditions tested.
Cells treated for 20 h with 2.0 , 1.0 , 0.5 or 0.25 mM MTX, or 2% DMSO, spotted onto YPD agar and incubated for 48 h are displayed on this image. From left to right, spots correspond to 5× serially diluted cells starting with a cell suspension with an OD600 nm of 1.0.
DMSO: Dimethyl sulfoxide; MTX: Methotrexate.
Yeast cell growth study in flow cell
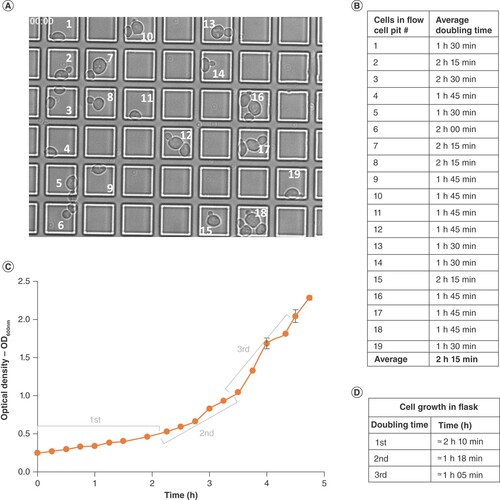
To investigate whether the CLiC instrument is useful for observing live cell growth, cells in log phase were re-suspended in YPD, adjusted to an OD600 nm of 5 and loaded into a flow cell confined by CLiC. Observations recorded at 30°C using brightfield illumination (refer to ‘Materials & methods’ for temperature control). Confined single cells had an initial doubling time that ranged from 1 h 30 min to 2 h 30 min (A & B), with an average of 2 h 15 min, which was consistent with the first doubling time recorded when the same strain is grown in flasks (C & D, Supplementary Video 1). With the CLiC instrument and a cell suspension with an initial OD600 nm of 5 prior to loading, we were able to reproducibly observe two cell doublings (Supplementary Videos 1–4). This assay validated the use of the CLiC instrument for single cell proliferation studies and could be used to observe the real-time drug response variabilities among a cell population.
(A) Timepoint 00:00 image of cells confined in convex lens-induced confinement flow cell and grown at 30°C in YPD for 8 h (refer to Supplementary Video 1 for complete growth cycle) and numeric labeling of pits containing cells. (B) Average doubling time of cells in Figure 7A numerically labelled pits. (C) Growth curve of cells grown in flask at 30°C with shaking in YPD, n = 2. (D) First, second and third doubling time of cells grown in flasks and deduced from Figure 7C.

This study validated the use of the CLiC instrument for accurate single-cell investigations. We observed that fluorescently labelled cells had improved background rejection (i.e., lower nonspecific fluorescence), which resulted in a higher signal-to-noise ratio within the flow cell compared with the microscope slides. The platform detected cellular DNA with higher precision and sensitivity, which also applied to other cellular compartments (vacuoles and mitochondria in this study). Most importantly, the CLiC instrument allows robust growth of yeast cells during single-cell confinement and observation in real time. This device could be used in future studies to observe the real-time emergence of resistant drug suppressors as well as yeast and bacterial persistence [Citation4], a phenomenon whereby, upon drug treatment, a small surviving subgroup regrows into a population that has not acquired any resistance and is still as sensitive to the treatment. This device also holds great potential for routine use in fields such as cancer research, where single-cell variabilities and instabilities are especially important for developing effective therapies. While we focused on yeast cells as a model system in this work, previous studies performed on adherent Chinese hamster ovary (CHO-K1) cells demonstrated the feasibility of customizing the CLiC instrument with a cytoindentor, which allows precise indentation and imaging of live mammalian cells without significantly changing their oxidative stress or causing detectable impacts on cell fitness [Citation13]. To manipulate cell adherence, the flow cells could be customized and coated with fibronectin as previously demonstrated [Citation13]. Further optimization and validation studies will, however, be needed for application on drug response and proliferation studies of mammalian cell lines. As with any single-cell technique, we acknowledge that drug response analysis on mammalian cells might be challenging with the CLiC instrument and not completely reflect their response in vivo. Nevertheless, single-cell technologies are essential to understand cell-to-cell variations in a heterogeneous population. Additionally, with the open architecture of the flow cell, it is possible to rapidly modify the environment for growth optimization (e.g., a stage-top incubator system enclosing the CLiC instrument can be used to maintain the temperature and humidified CO2 for mammalian cells). Based on the data collected during this investigation, we suggest that CLiC is a useful new tool for single-cell biology and is well-suited for the study of single-cell heterogeneity in drug response.
Future perspective
While extraordinary progress has been made in developing and implementing high-throughput, high-content screening platforms with powerful analysis software, there are still obstacles to wide adoption of real-time cellular imaging. These challenges can be broadly grouped into: hardware, data collection and analysis, and cost and ease of use. With regards to the hardware issue, the current imaging platforms can be categorized as: i) traditional microscopes that have been automated; ii) automated, dedicated imagers; iii) plate readers with single-cell resolution; and iv) flow cytometers. Each of these platforms is capable of single-cell resolution, but some are unable to re-identify and track individual cells over time (e.g., plate readers and cytometers), and even dedicated imagers struggle to faithfully track large numbers of individual cell trajectories.
The flow cell and CLiC instrument therefore fills several important gaps; it is a relatively inexpensive accessory that can be added to any inverted microscope and, most importantly, the confinement afforded by CLiC, combined with flow cells containing ordered features, allows one to track individual cell trajectories over an extended period in real-time in physiological conditions. This capability is key to understanding the individual cell's response to drugs or other perturbations. This is especially true when performing high-resolution phenotyping. The improved signal that can be obtained from fluorescently labeled molecules should aid in the subcellular localization of ligands in single cells.
While generating arrays of cells within an imaging field is not a new idea [Citation25], CliC provides a flexible (the only constraints are in the initial flow cell design) means to achieve living cell microarrays that are unique in that no tethers are required to keep cells within the focal plane over extended periods. The next challenges with CLiC as applied to phenotypic screens will be to increase the capacity of the flow cells and to introduce automation, for example, for loading flows cells and liquid exchanges.
Author contributions
NKT, NC, DB, SL and CN designed and supported the microscopy experiments; NKT acquired and analyzed the data; RT developed and fabricated the flow cells. NKT, SL and CN wrote the manuscript.
Acknowledgments
We thank ScopeSys (www.scopesys.ca) for access to the CLiC technology package. The project was supported by a grant from the CFI to CN.
Supplementary data
To view the supplementary data that accompany this paper please visit the journal website at: www.tandfonline.com/doi/suppl/10.2144/btn-2019-0067
Financial & competing interests disclosure
SL acknowledges the NSERC Discovery, Accelerator, and Idea to Innovation programs as well as McGill University for research funding and support. SL and DB have a financial interest in ScopeSys, the company which is commercializing CLiC imaging. The authors have no other relevant affiliations or financial involvement with any organization or entity with a financial interest in or financial conflict with the subject matter or materials discussed in the manuscript apart from those disclosed.
No writing assistance was utilized in the production of this manuscript.
Additional information
Funding
References
- Abdallah BY , HorneSD, StevensJBet al. Single cell heterogeneity: why unstable genomes are incompatible with average profiles. Cell Cycle12(23), 3640–3649 (2013).
- Heng HH , BremerSW, StevensJBet al. Chromosomal instability (CIN): what it is and why it is crucial to cancer evolution. Cancer Metastasis Rev.32(3–4), 325–340 (2013).
- Elowitz MB , LevineAJ, SiggiaED, SwainPS. Stochastic gene expression in a single cell. Science297(5584), 1183–1186 (2002).
- Balaban NQ , MerrinJ, ChaitR, KowalikL, LeiblerS. Bacterial persistence as a phenotypic switch. Science305(5690), 1622–1625 (2004).
- Baltekin Ö , BoucharinA, TanoE, AnderssonDI, ElfJ. Antibiotic susceptibility testing in less than 30 min using direct single-cell imaging. Proc. Natl Acad. Sci. USA114(34), 9170–9175 (2017).
- Dai J , HamonM, JambovaneS. Microfluidics for antibiotic susceptibility and toxicity testing. Bioengineering (Basel)3(4), E25 (2016).
- Leslie SR , FieldsAP, CohenAE. Convex lens-induced confinement for imaging single molecules. Anal. Chem.82(14), 6224–6229 (2010).
- Berard D , McFaulCM, LeithJS, ArsenaultAK, MichaudF, LeslieSR. Precision platform for convex lens-induced confinement microscopy. Rev. Sci. Instrum.84(10), 103704 (2013).
- Berard DJ , ShayeganM, MichaudF, HenkinG, ScottS, LeslieS. Formatting and ligating biopolymers using adjustable nanoconfinement. Appl. Physics Lett.109(3), 033702 (2016).
- Scott S , XuZM, KouzineFet al. Visualizing structure-mediated interactions in supercoiled DNA molecules. Nucleic Acids Res.46(9), 4622–4631 (2018).
- Scott S , ShaheenC, McGuinnessBet al. Single-molecule visualization of the effects of ionic strength and crowding on structure-mediated interactions in supercoiled DNA molecules. Nucleic Acids Res.47(12), 6360–6368 (2019).
- Shayegan M , TahvildariR, MeteraK, KisleyL, MichnickSW, LeslieSR. probing inhomogeneous diffusion in the microenvironments of phase-separated polymers under confinement. J. Am. Chem. Soc.141(19), 7751–7757 (2019).
- Jia B , WeeTL, BoudreauCGet al. Parallelized cytoindentation using convex micropatterned surfaces. BioTechniques61(2), 73–82 (2016).
- Simon JA , BedalovA. Yeast as a model system for anticancer drug discovery. Nat. Rev. Cancer4(6), 481–492 (2004).
- Giaever G , NislowC. The yeast deletion collection: a decade of functional genomics. Genetics197(2), 451–465 (2014).
- Lee AY , StOnge RP, ProctorMJet al. Mapping the cellular response to small molecules using chemogenomic fitness signatures. Science344(6180), 208–211 (2014).
- Brachmann CB , DaviesA, CostGJet al. Designer deletion strains derived from Saccharomyces cerevisiae S288C: a useful set of strains and plasmids for PCR-mediated gene disruption and other applications. Yeast14(2), 115–132 (1998).
- Schneider CA , RasbandWS, EliceiriKW. NIH Image to ImageJ: 25 years of image analysis. Nat. Methods9(7), 671–675 (2012).
- Schindelin J , Arganda-CarrerasI, FriseEet al. Fiji: an open-source platform for biological-image analysis. Nat. Methods9(7), 676–682 (2012).
- Wong LH , SinhaS, BergeronJRet al. Reverse chemical genetics: comprehensive fitness profiling reveals the spectrum of drug target interactions. PLoS Genet.12(9), e1006275 (2016).
- Lagosky PA , TaylorGR, HaynesRH. Molecular characterization of the Saccharomyces cerevisiae dihydrofolate reductase gene (DFR1). Nucleic Acids Res.15(24), 10355–10371 (1987).
- Altmann K , WestermannB. Role of essential genes in mitochondrial morphogenesis in Saccharomyces cerevisiae. Mol. Biol. Cell16(11), 5410–5417 (2005).
- Zettel MF , GarzaLR, CassAMet al. The budding index of Saccharomyces cerevisiae deletion strains identifies genes important for cell cycle progression. FEMS Microbiol. Lett.223(2), 253–258 (2003).
- Bi E , ParkHO. Cell polarization and cytokinesis in budding yeast. Genetics.191(2), 347–387 (2012).
- Jonczyk R , KurthT, LavrentievaA, WalterJG, ScheperT, StahlF. Living cell microarrays: an overview of concepts. Microarrays (Basel).5(2), (2016).

